. 2022 Mar;603(7902):736-742.
doi: 10.1038/s41586-022-04488-5. Epub 2022 Mar 9.

Regulation of liver subcellular architecture controls metabolic homeostasis

Affiliations

Regulation of liver subcellular architecture controls metabolic homeostasis

Güneş Parlakgül et al. Nature. 2022 Mar.

Abstract

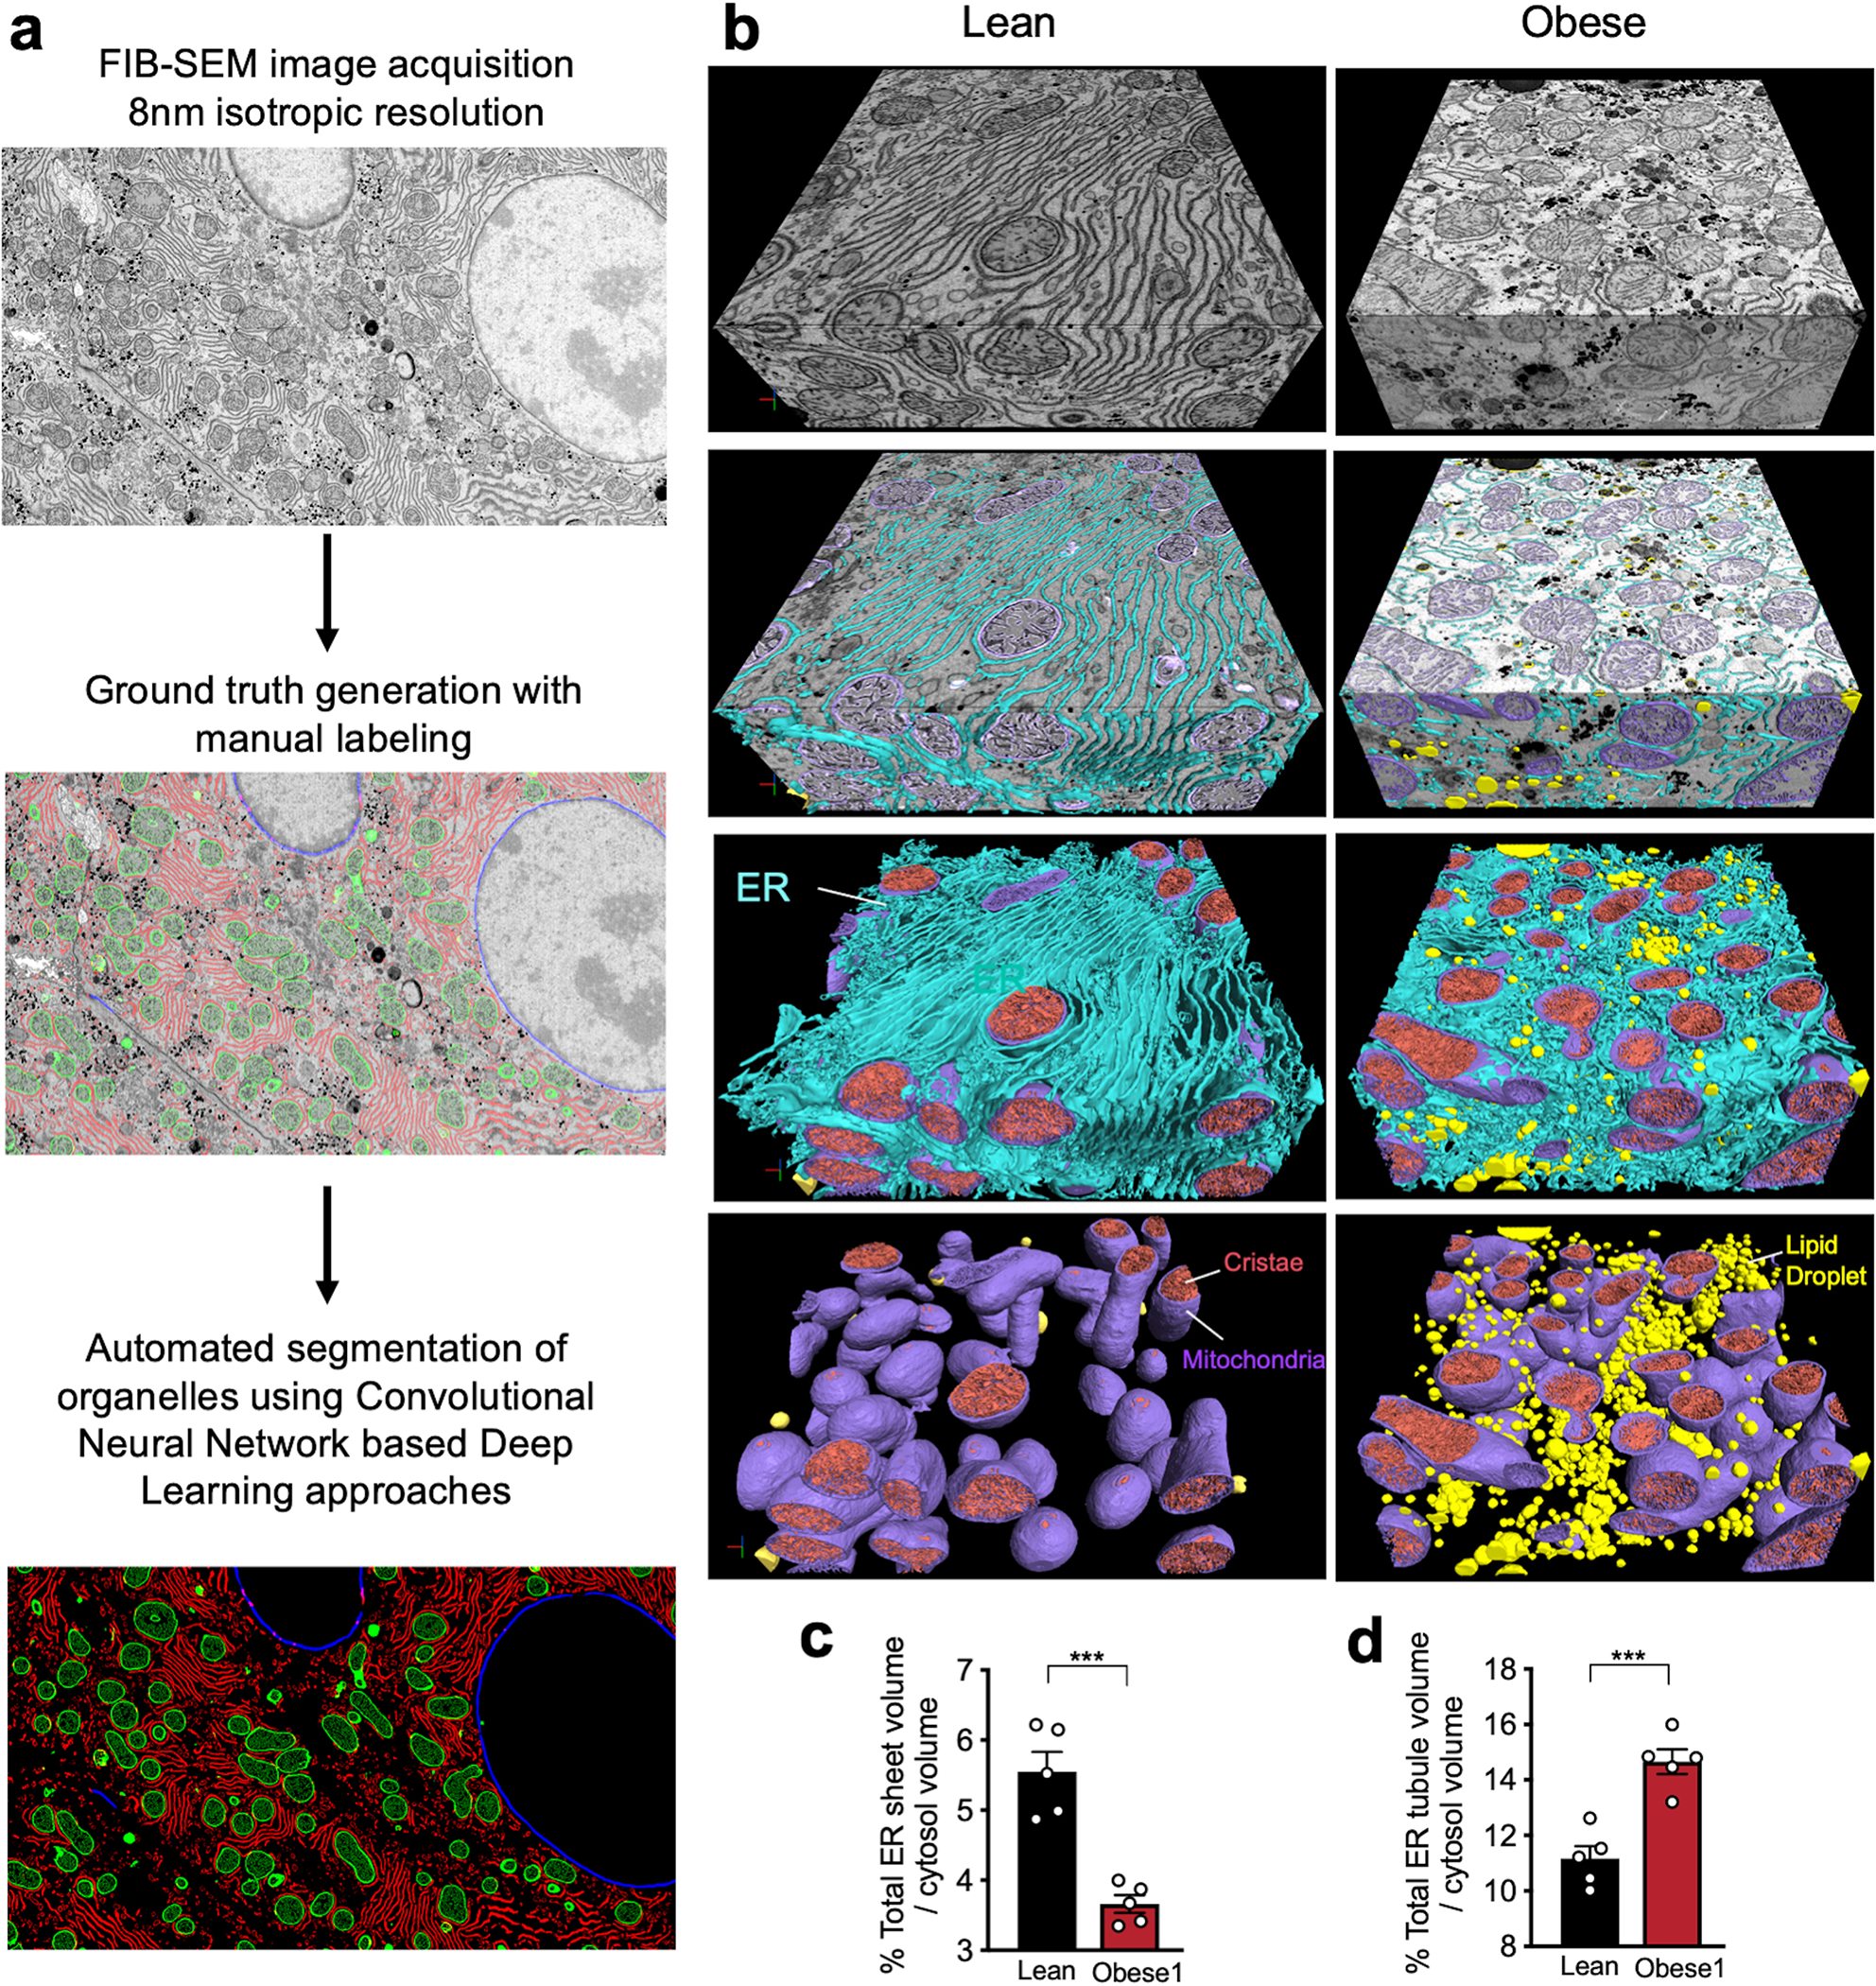
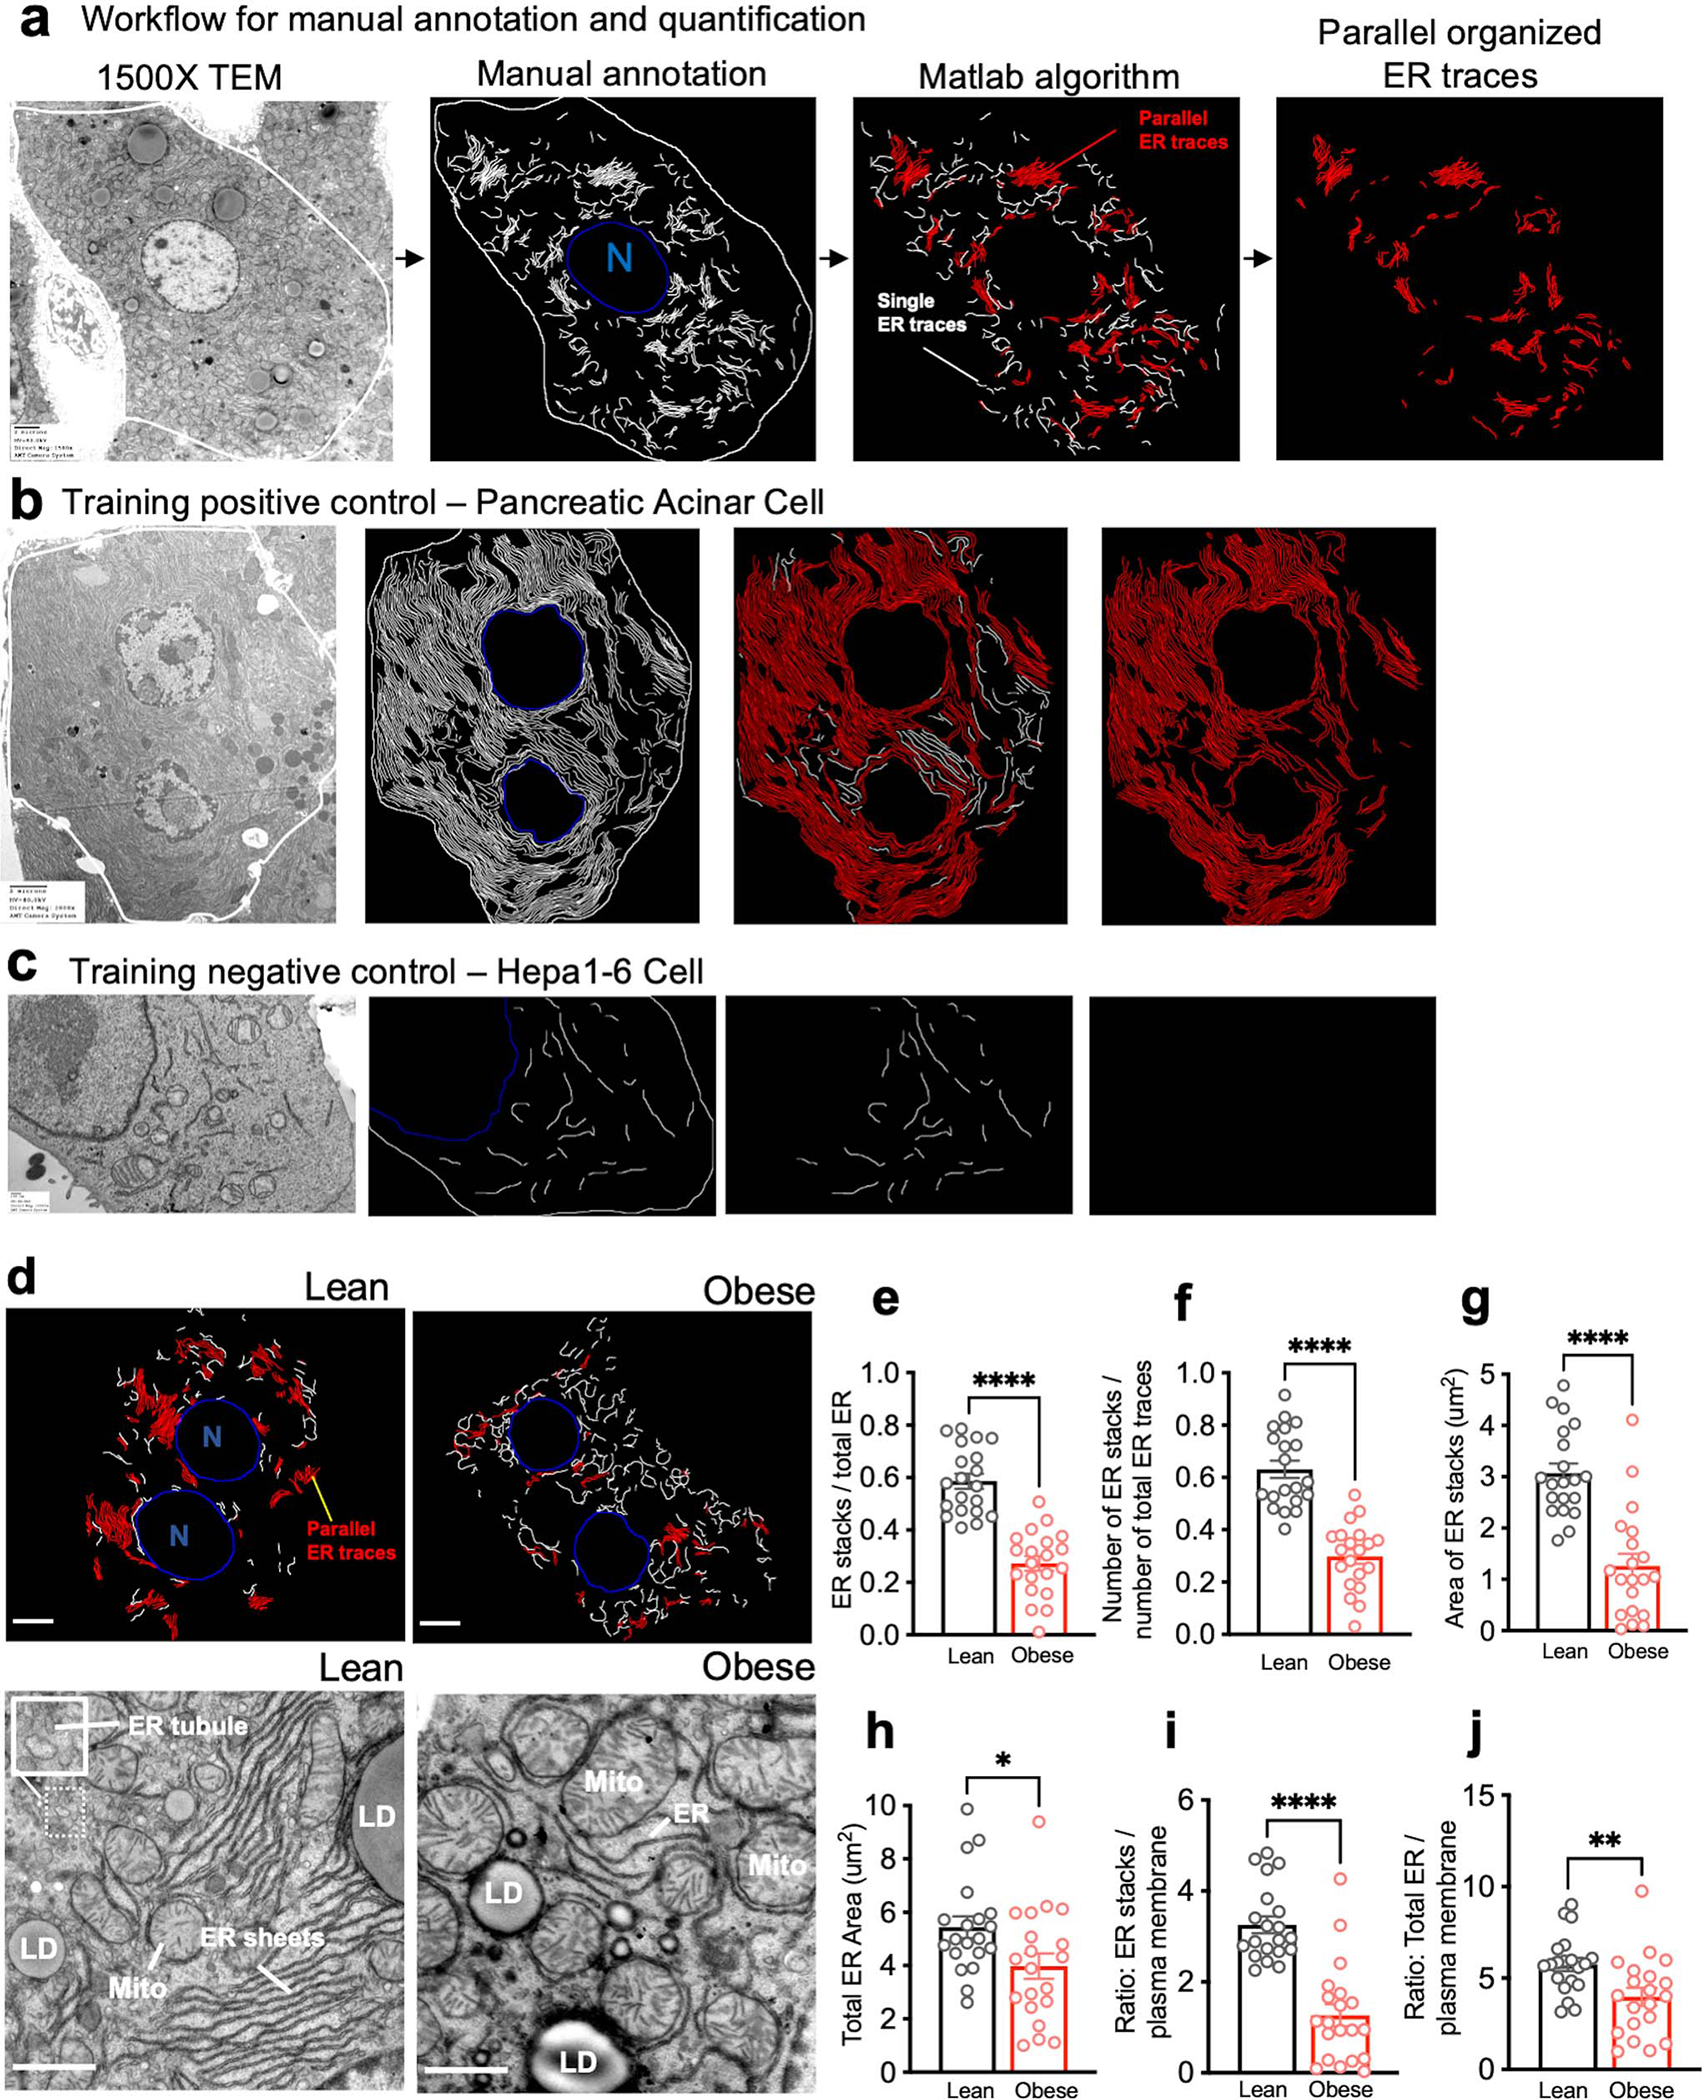
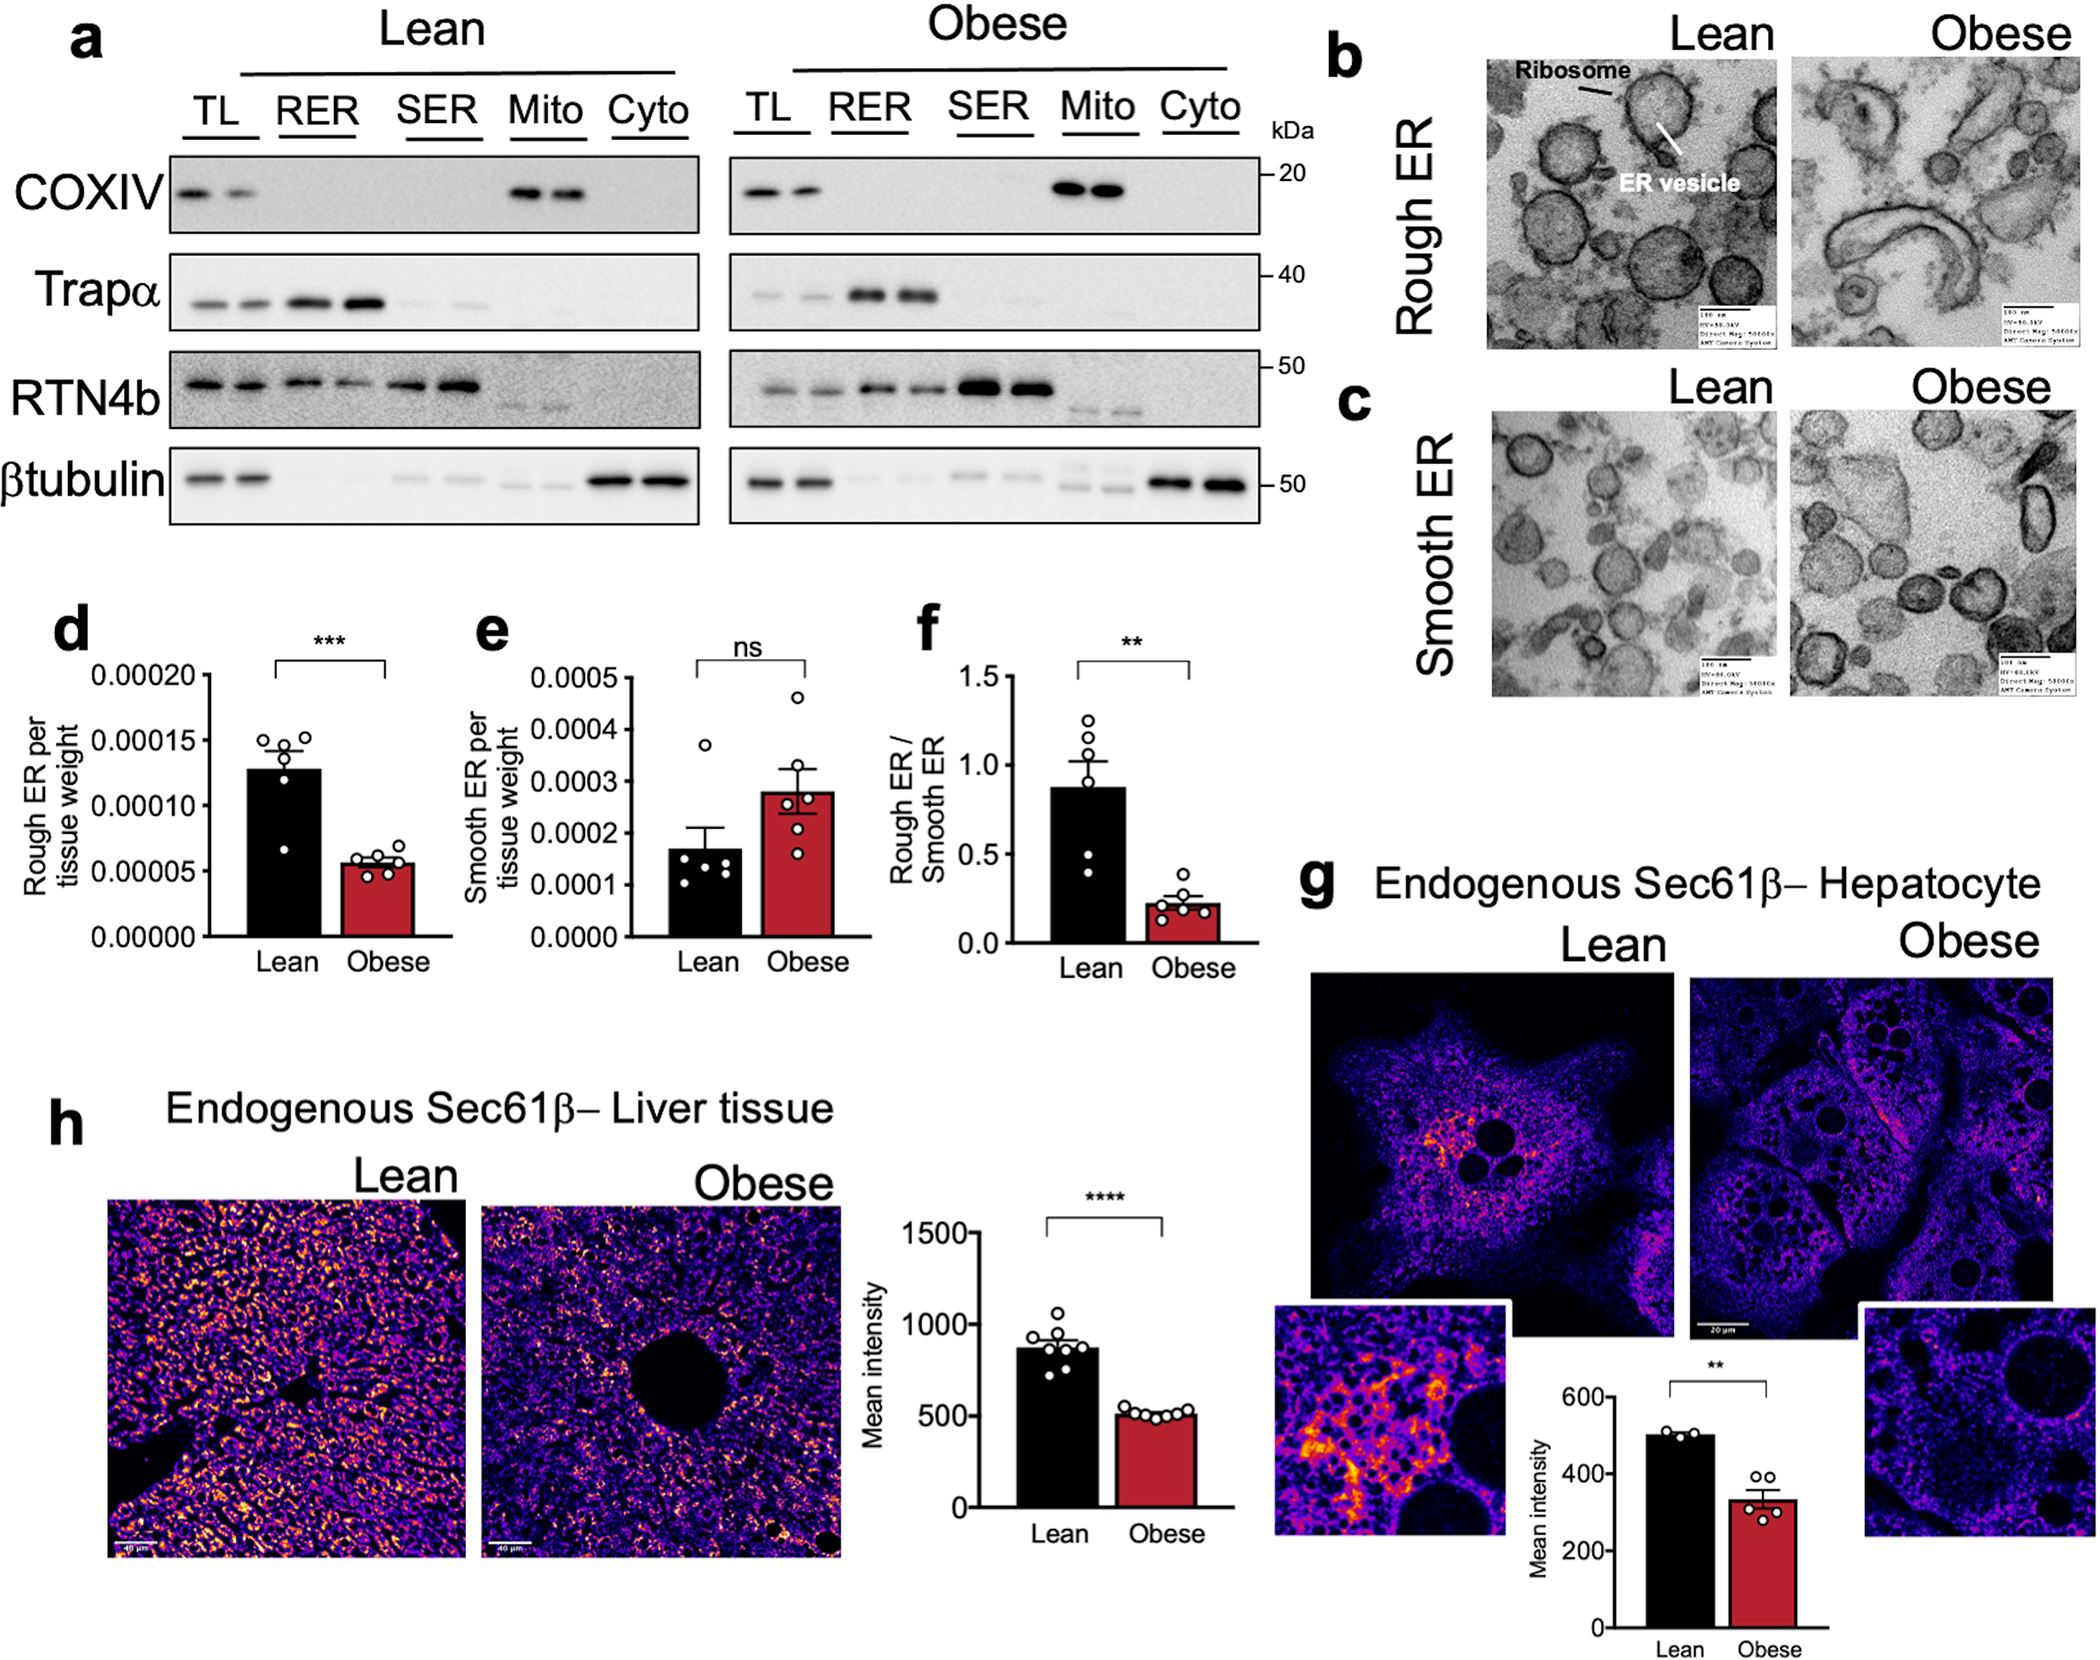
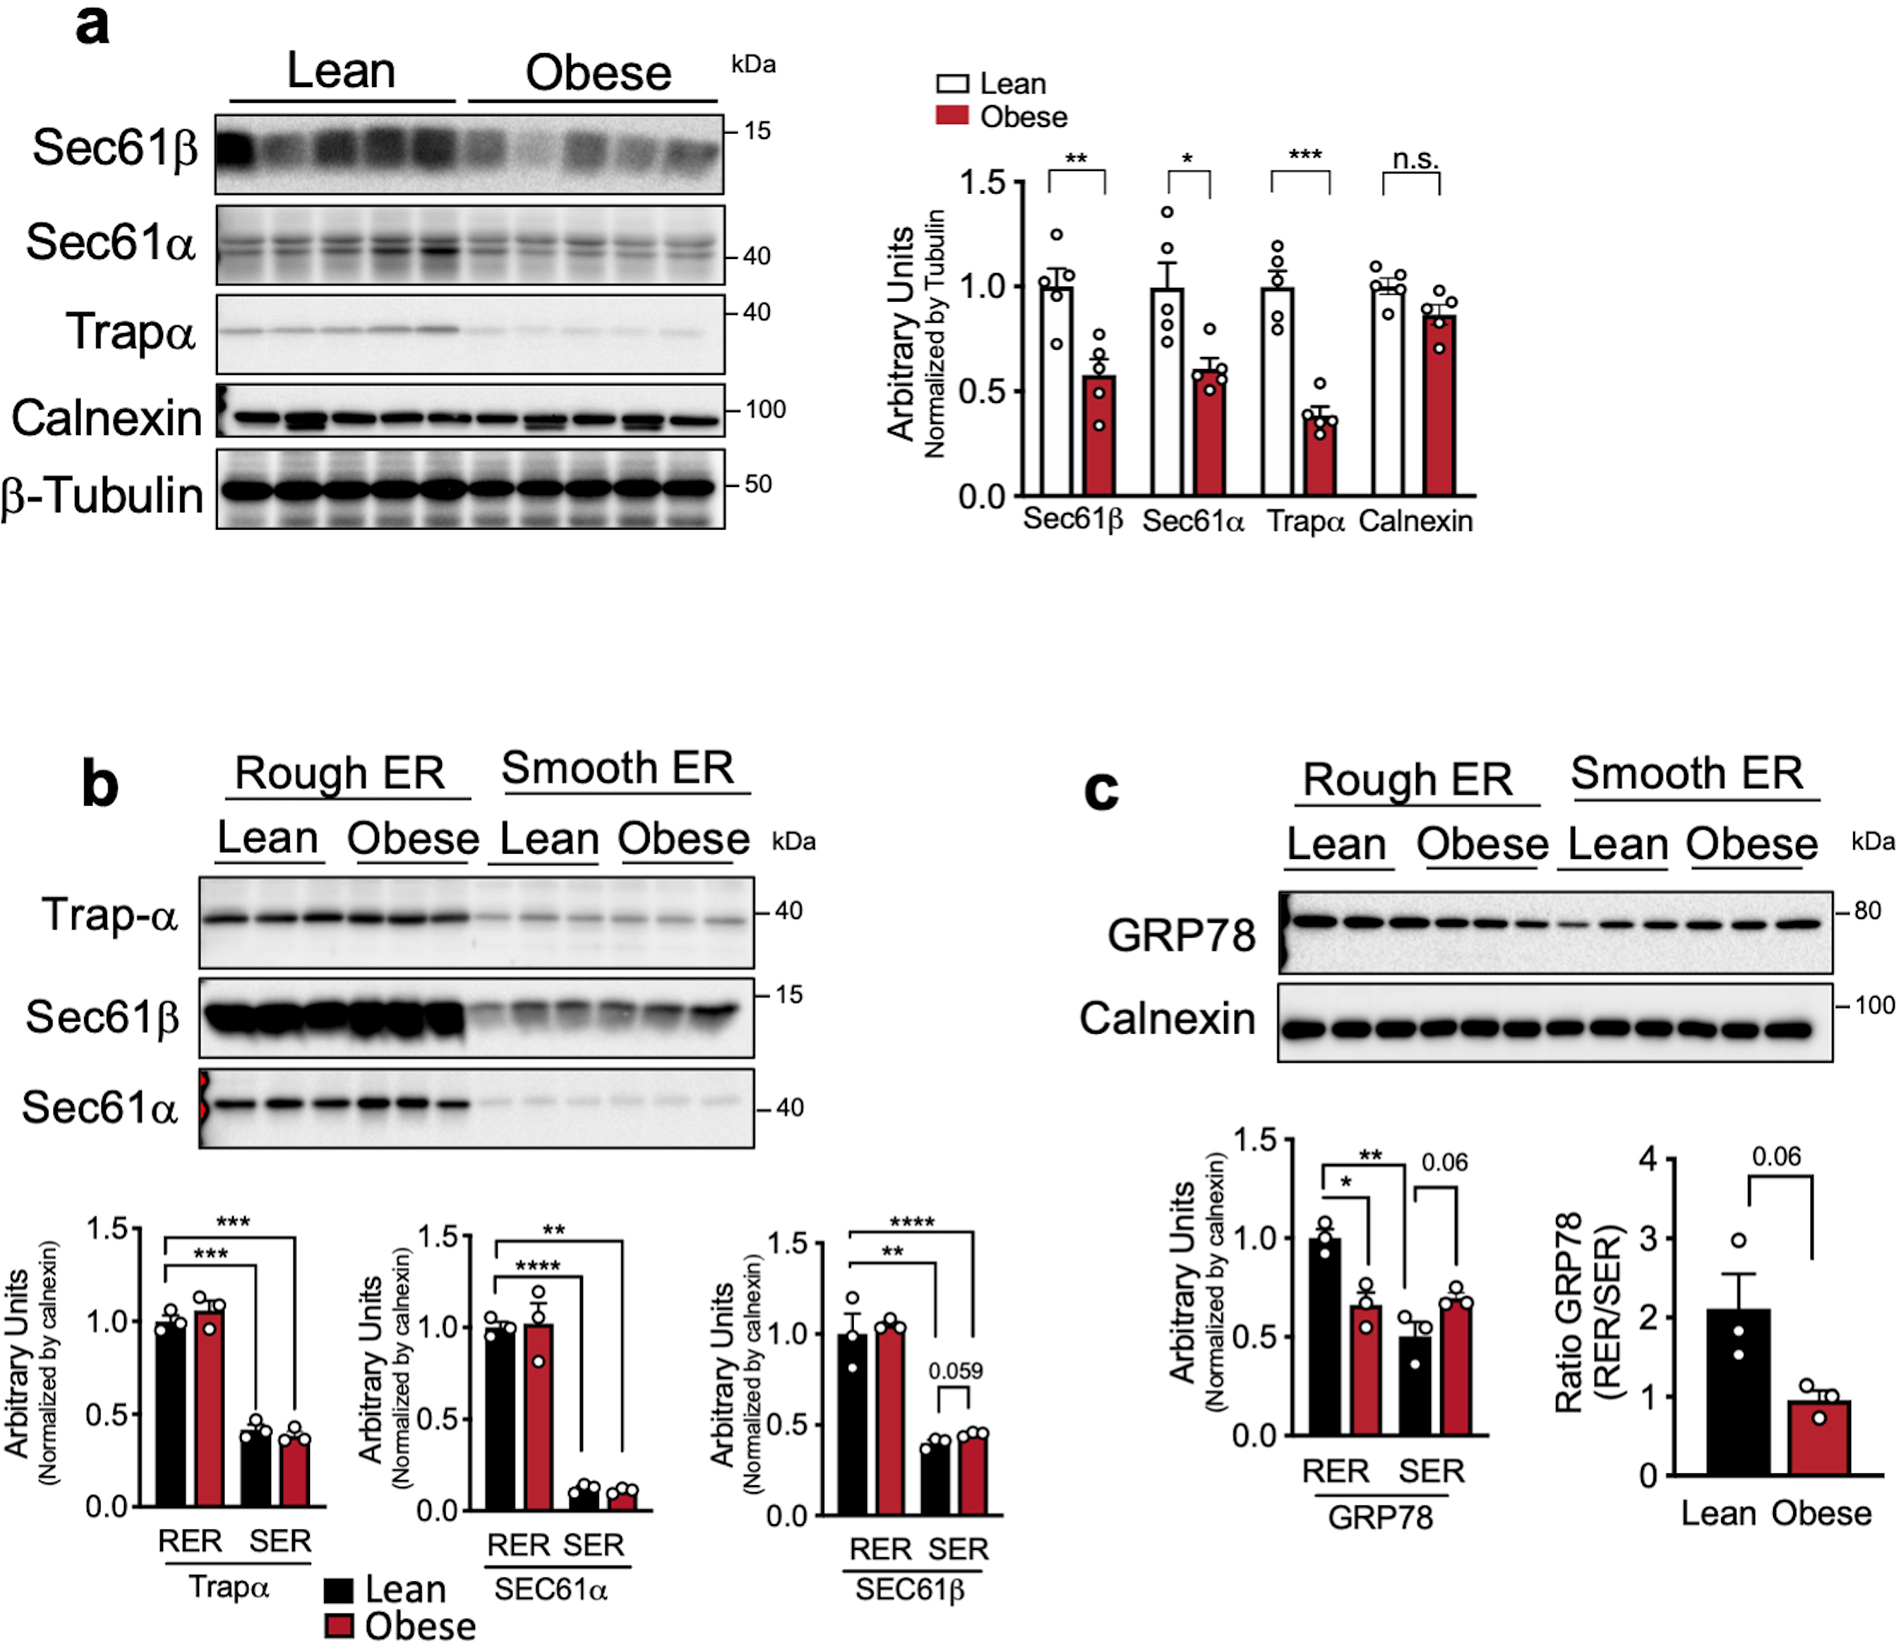
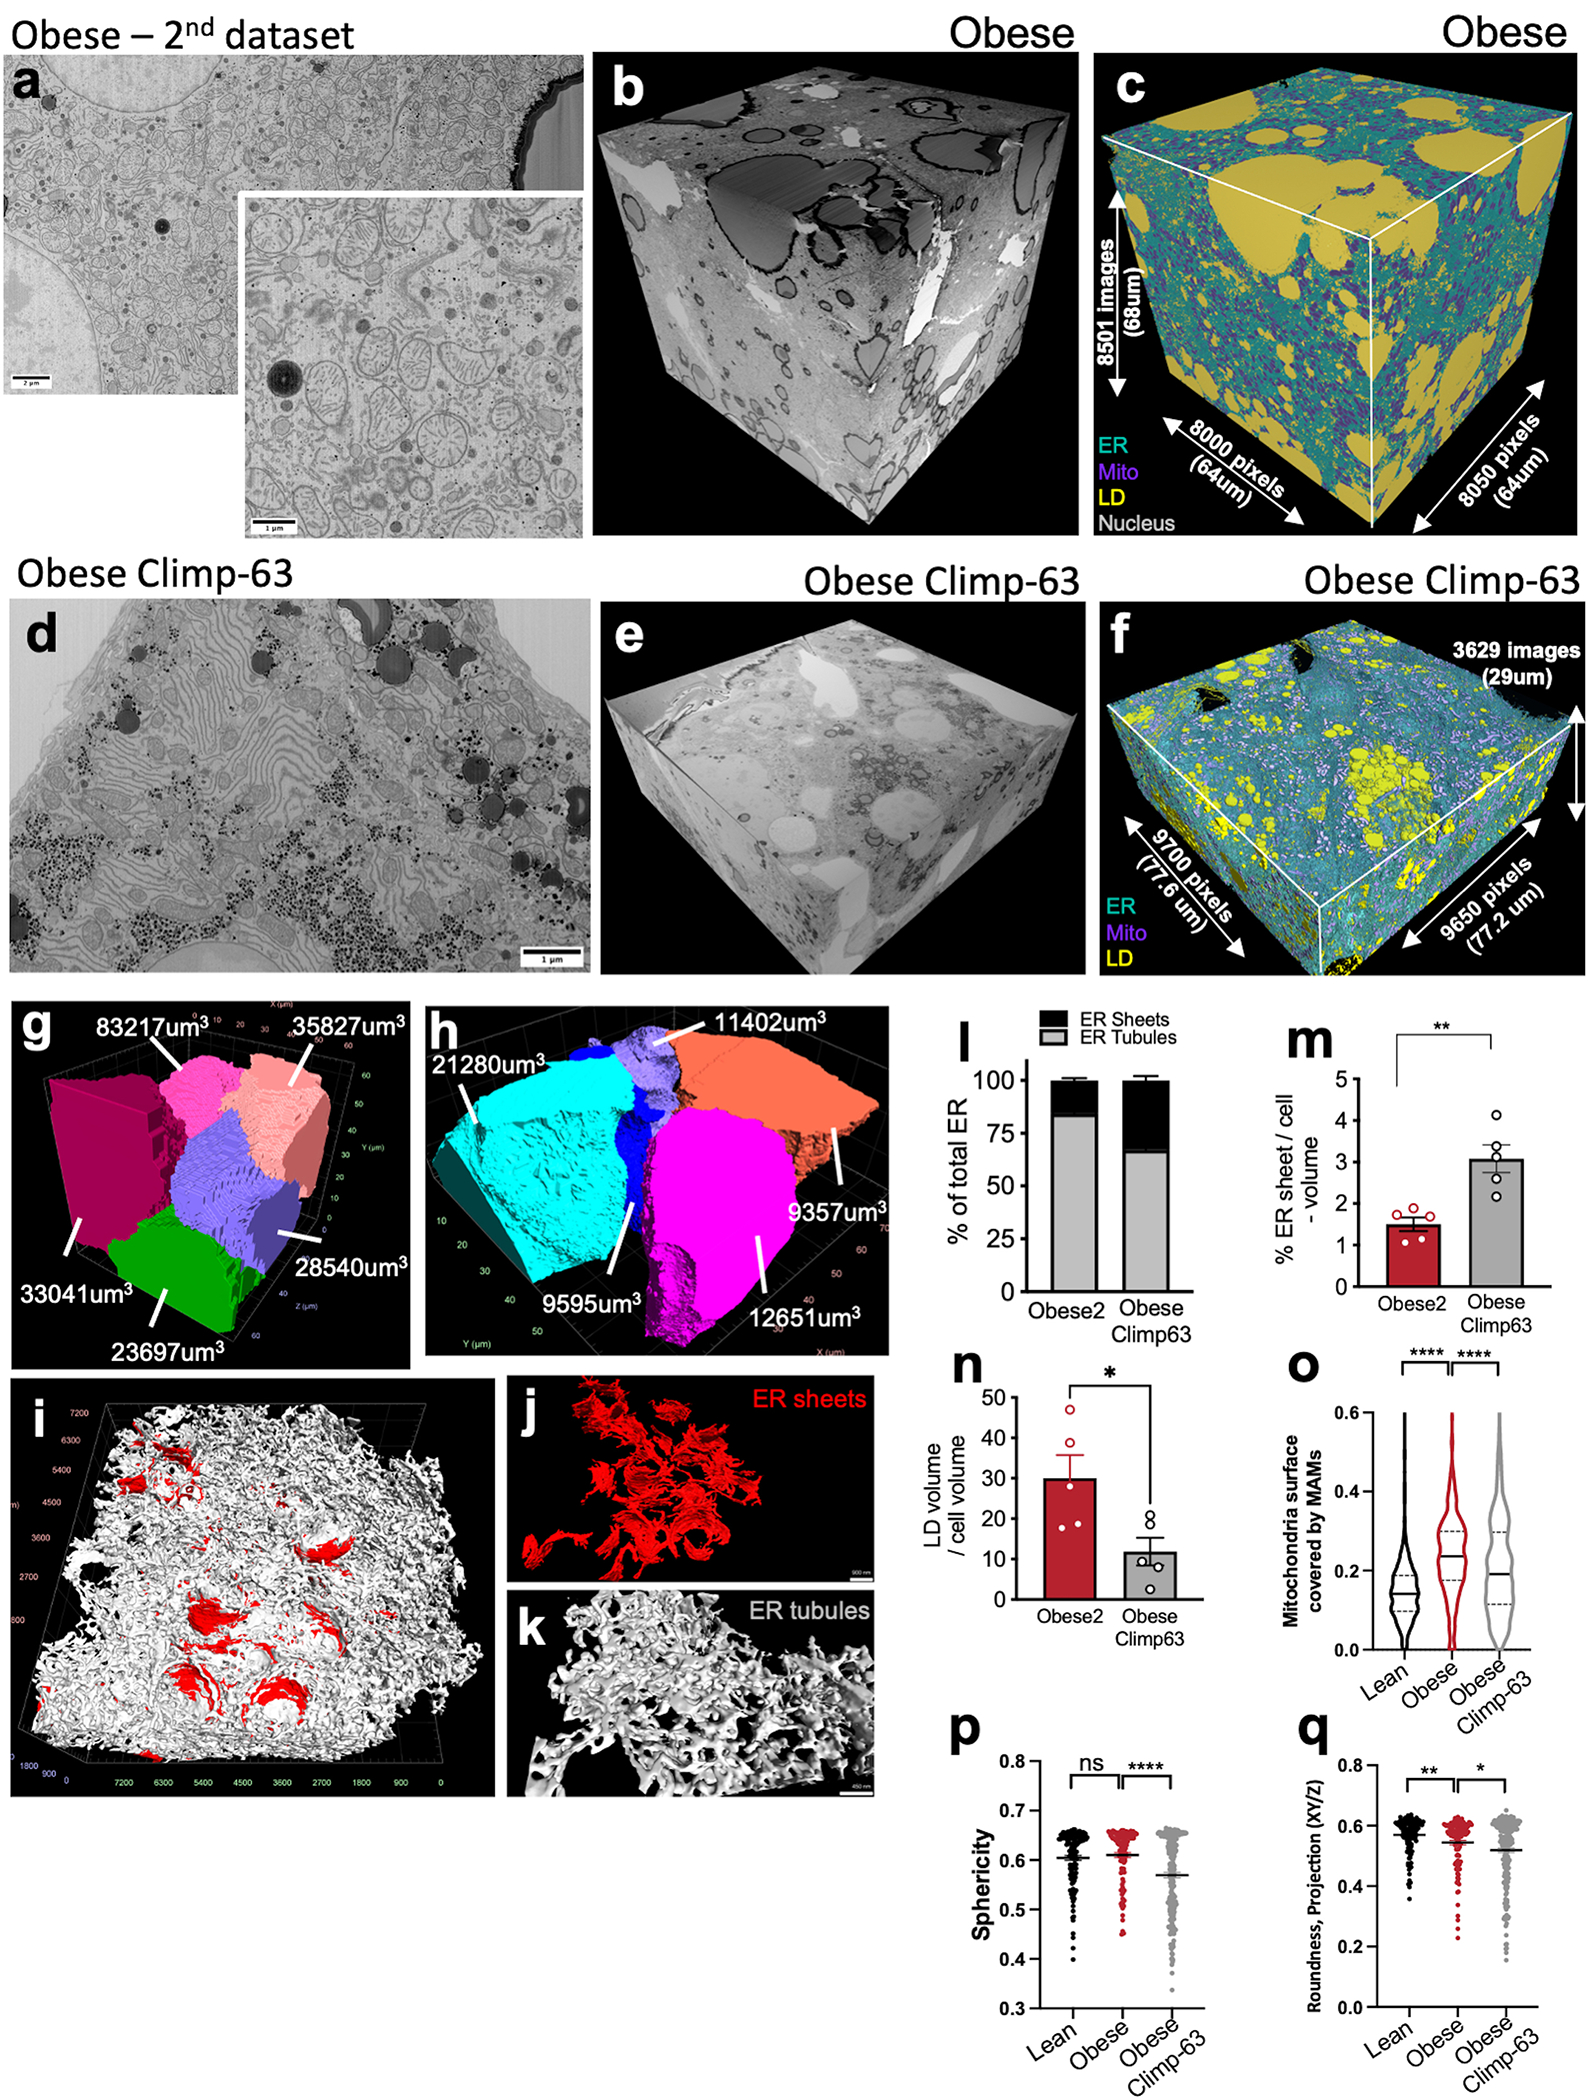
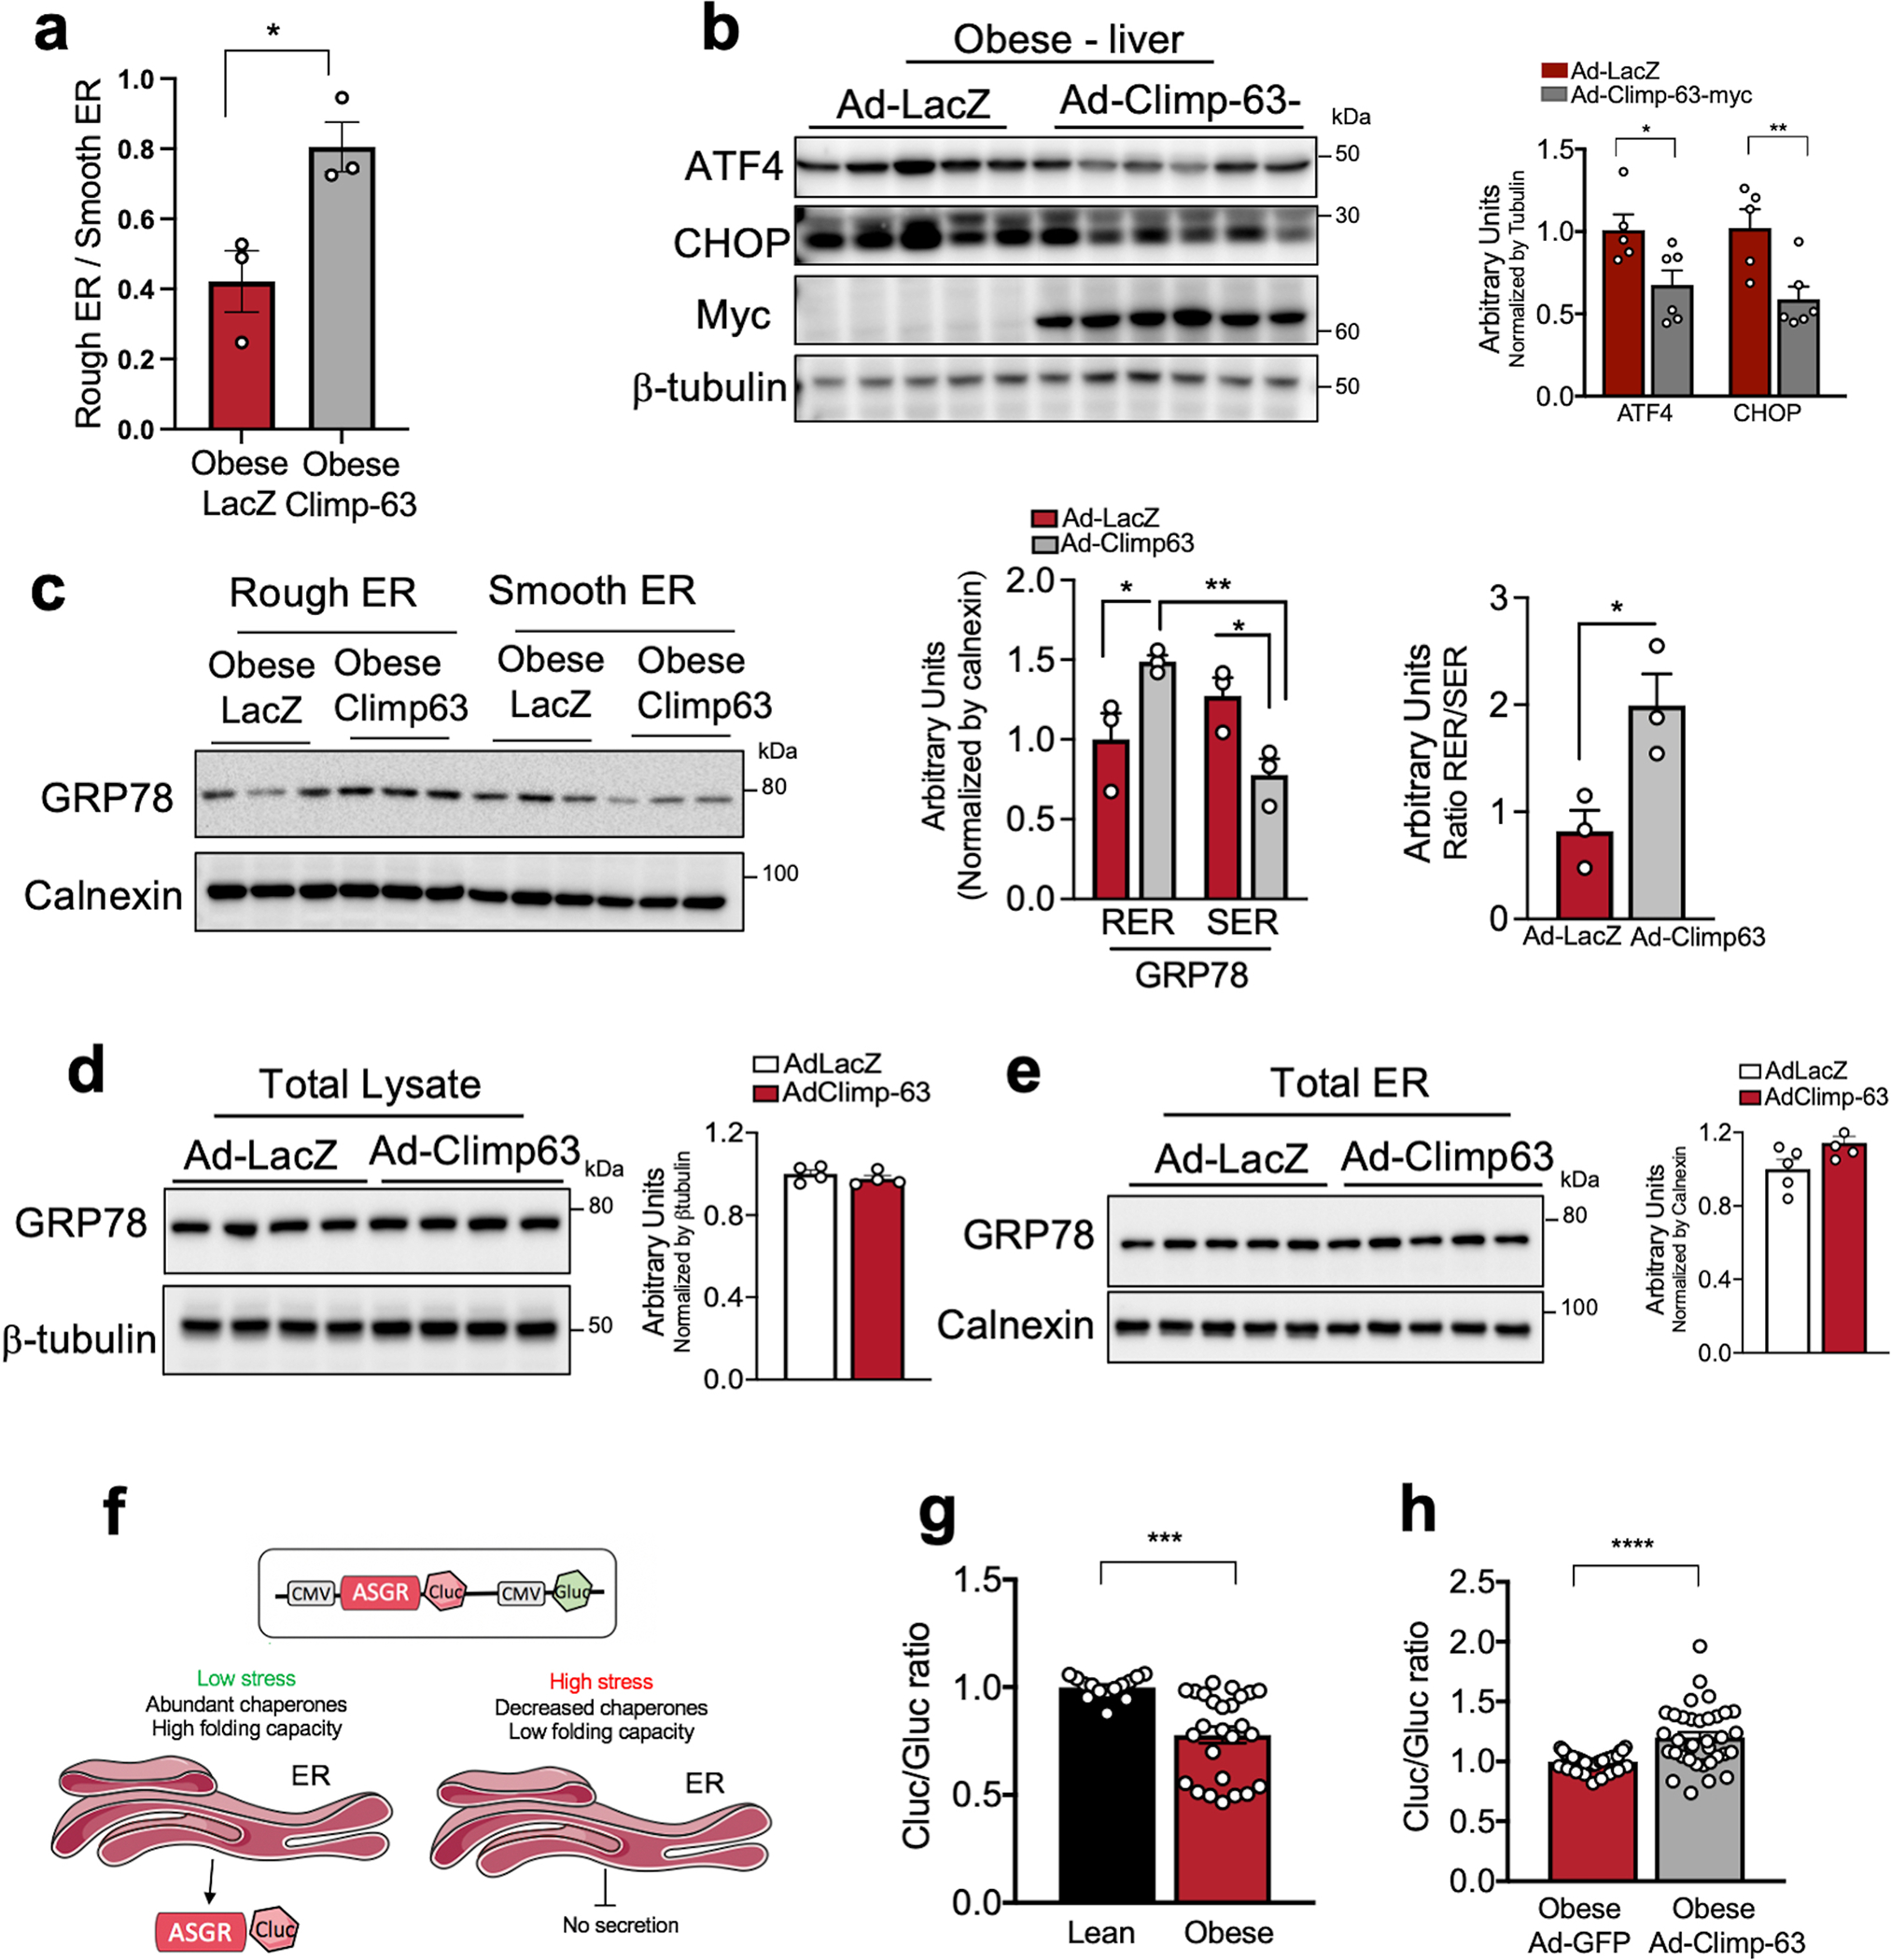
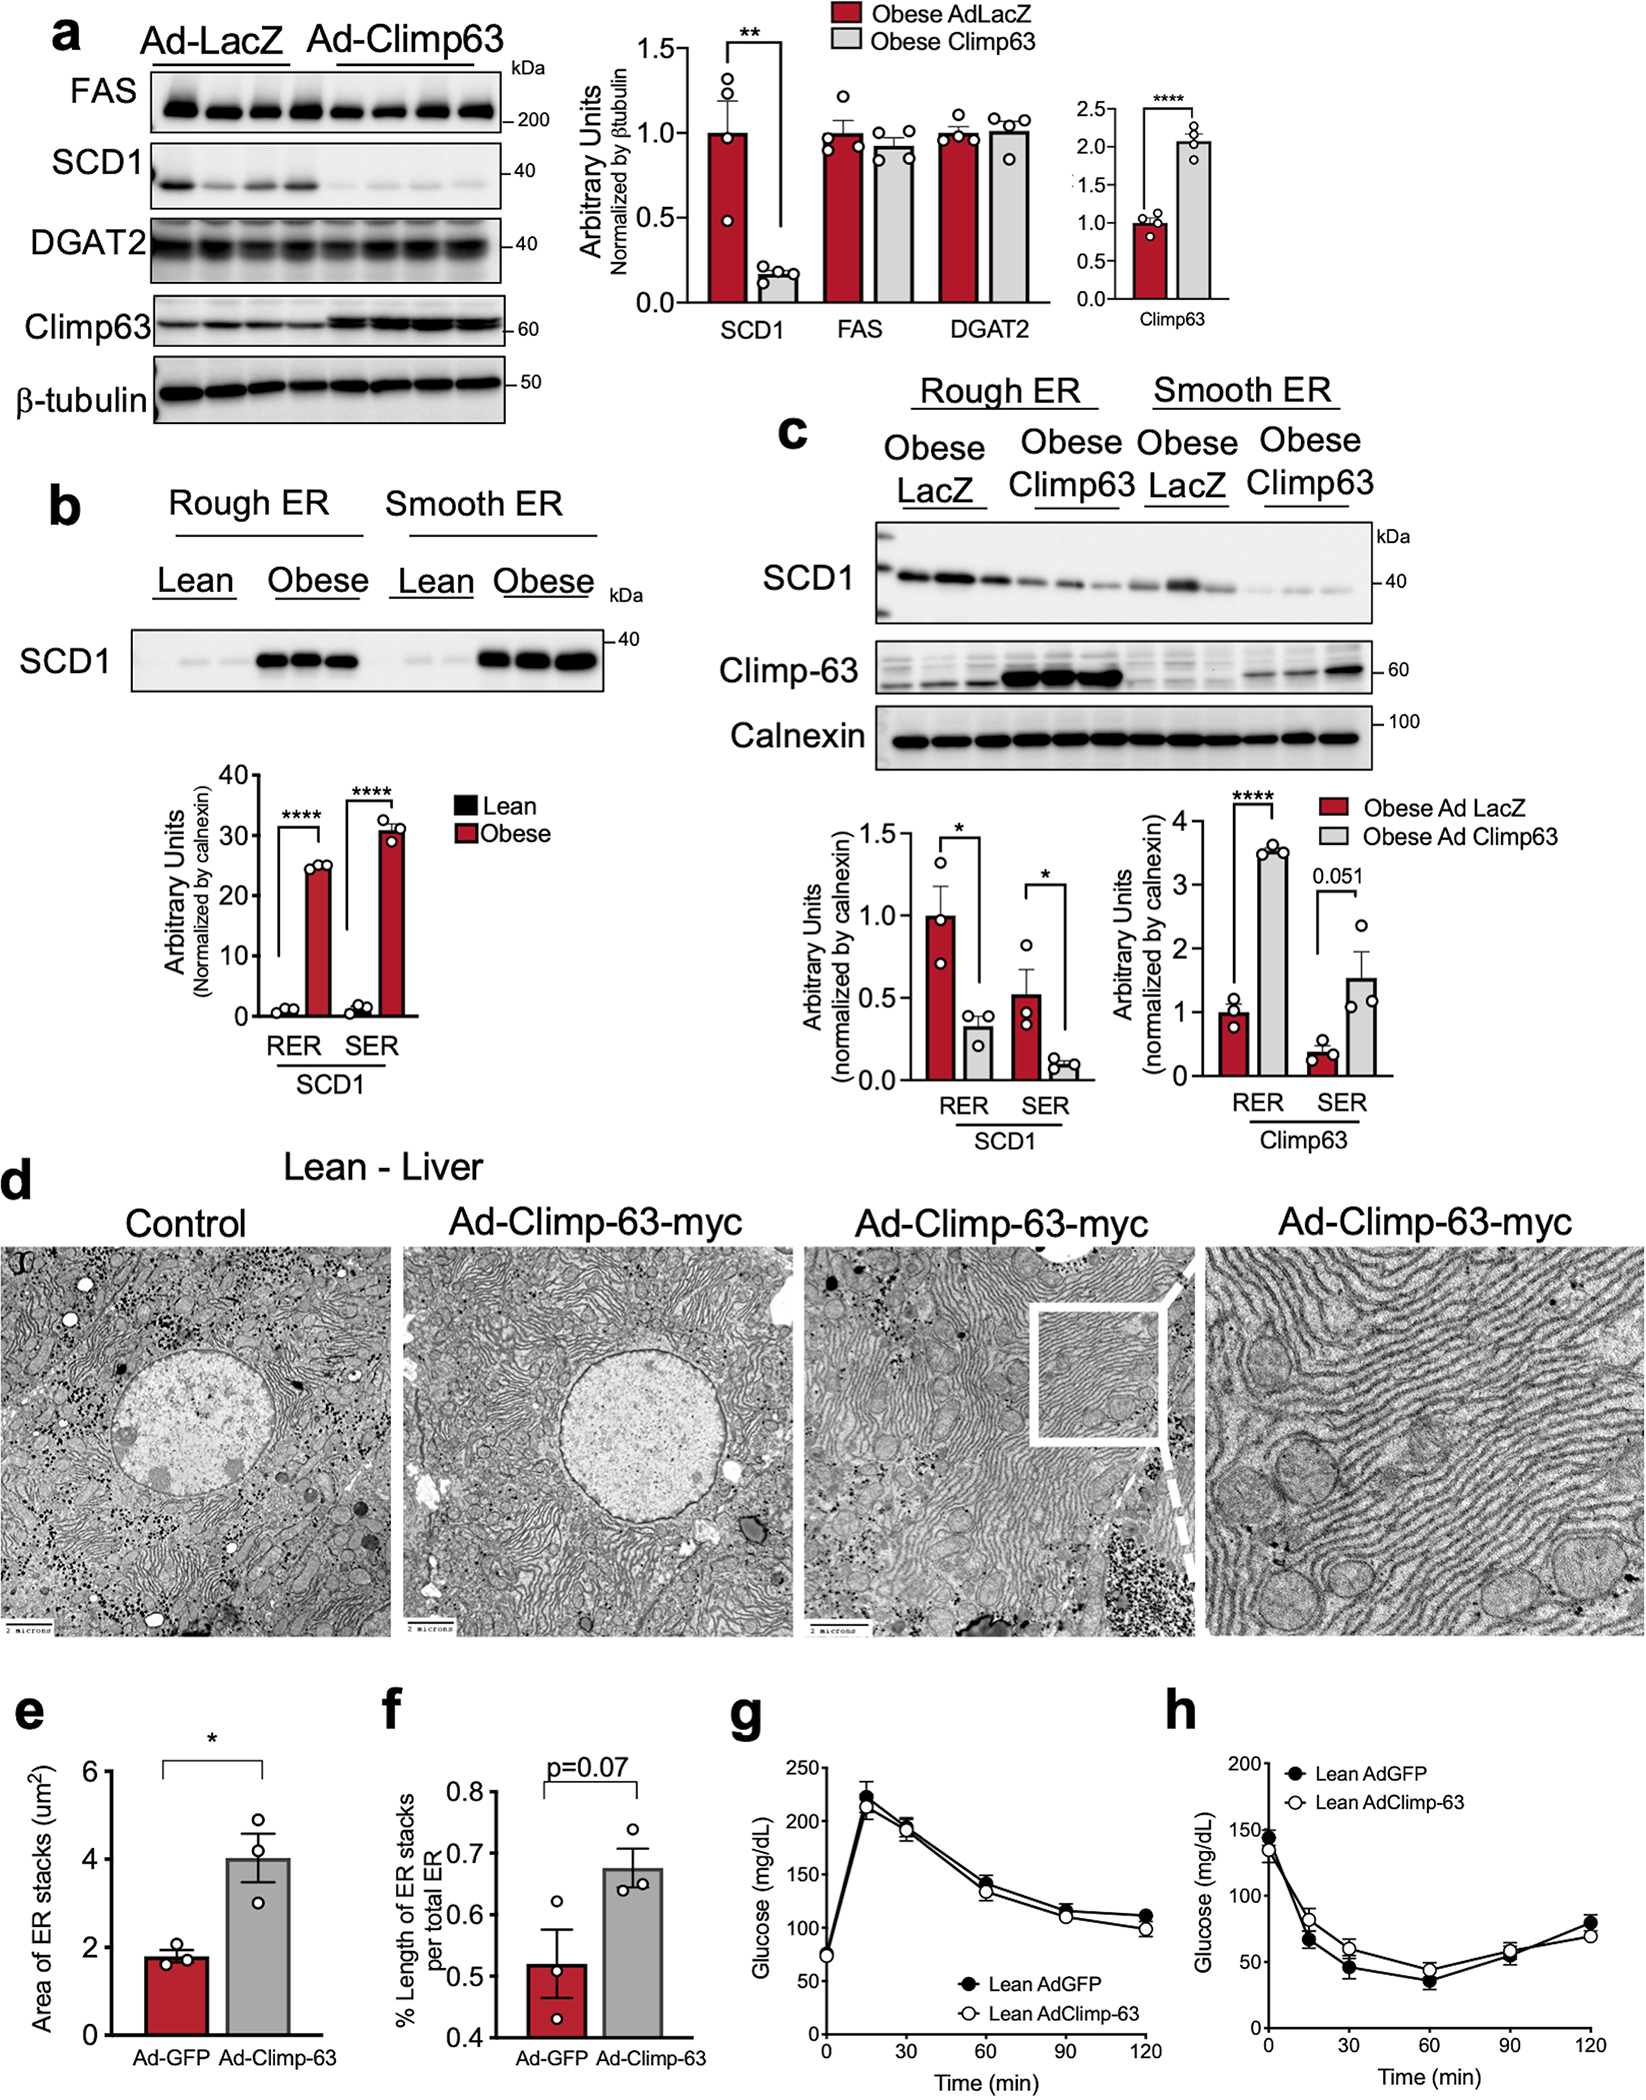
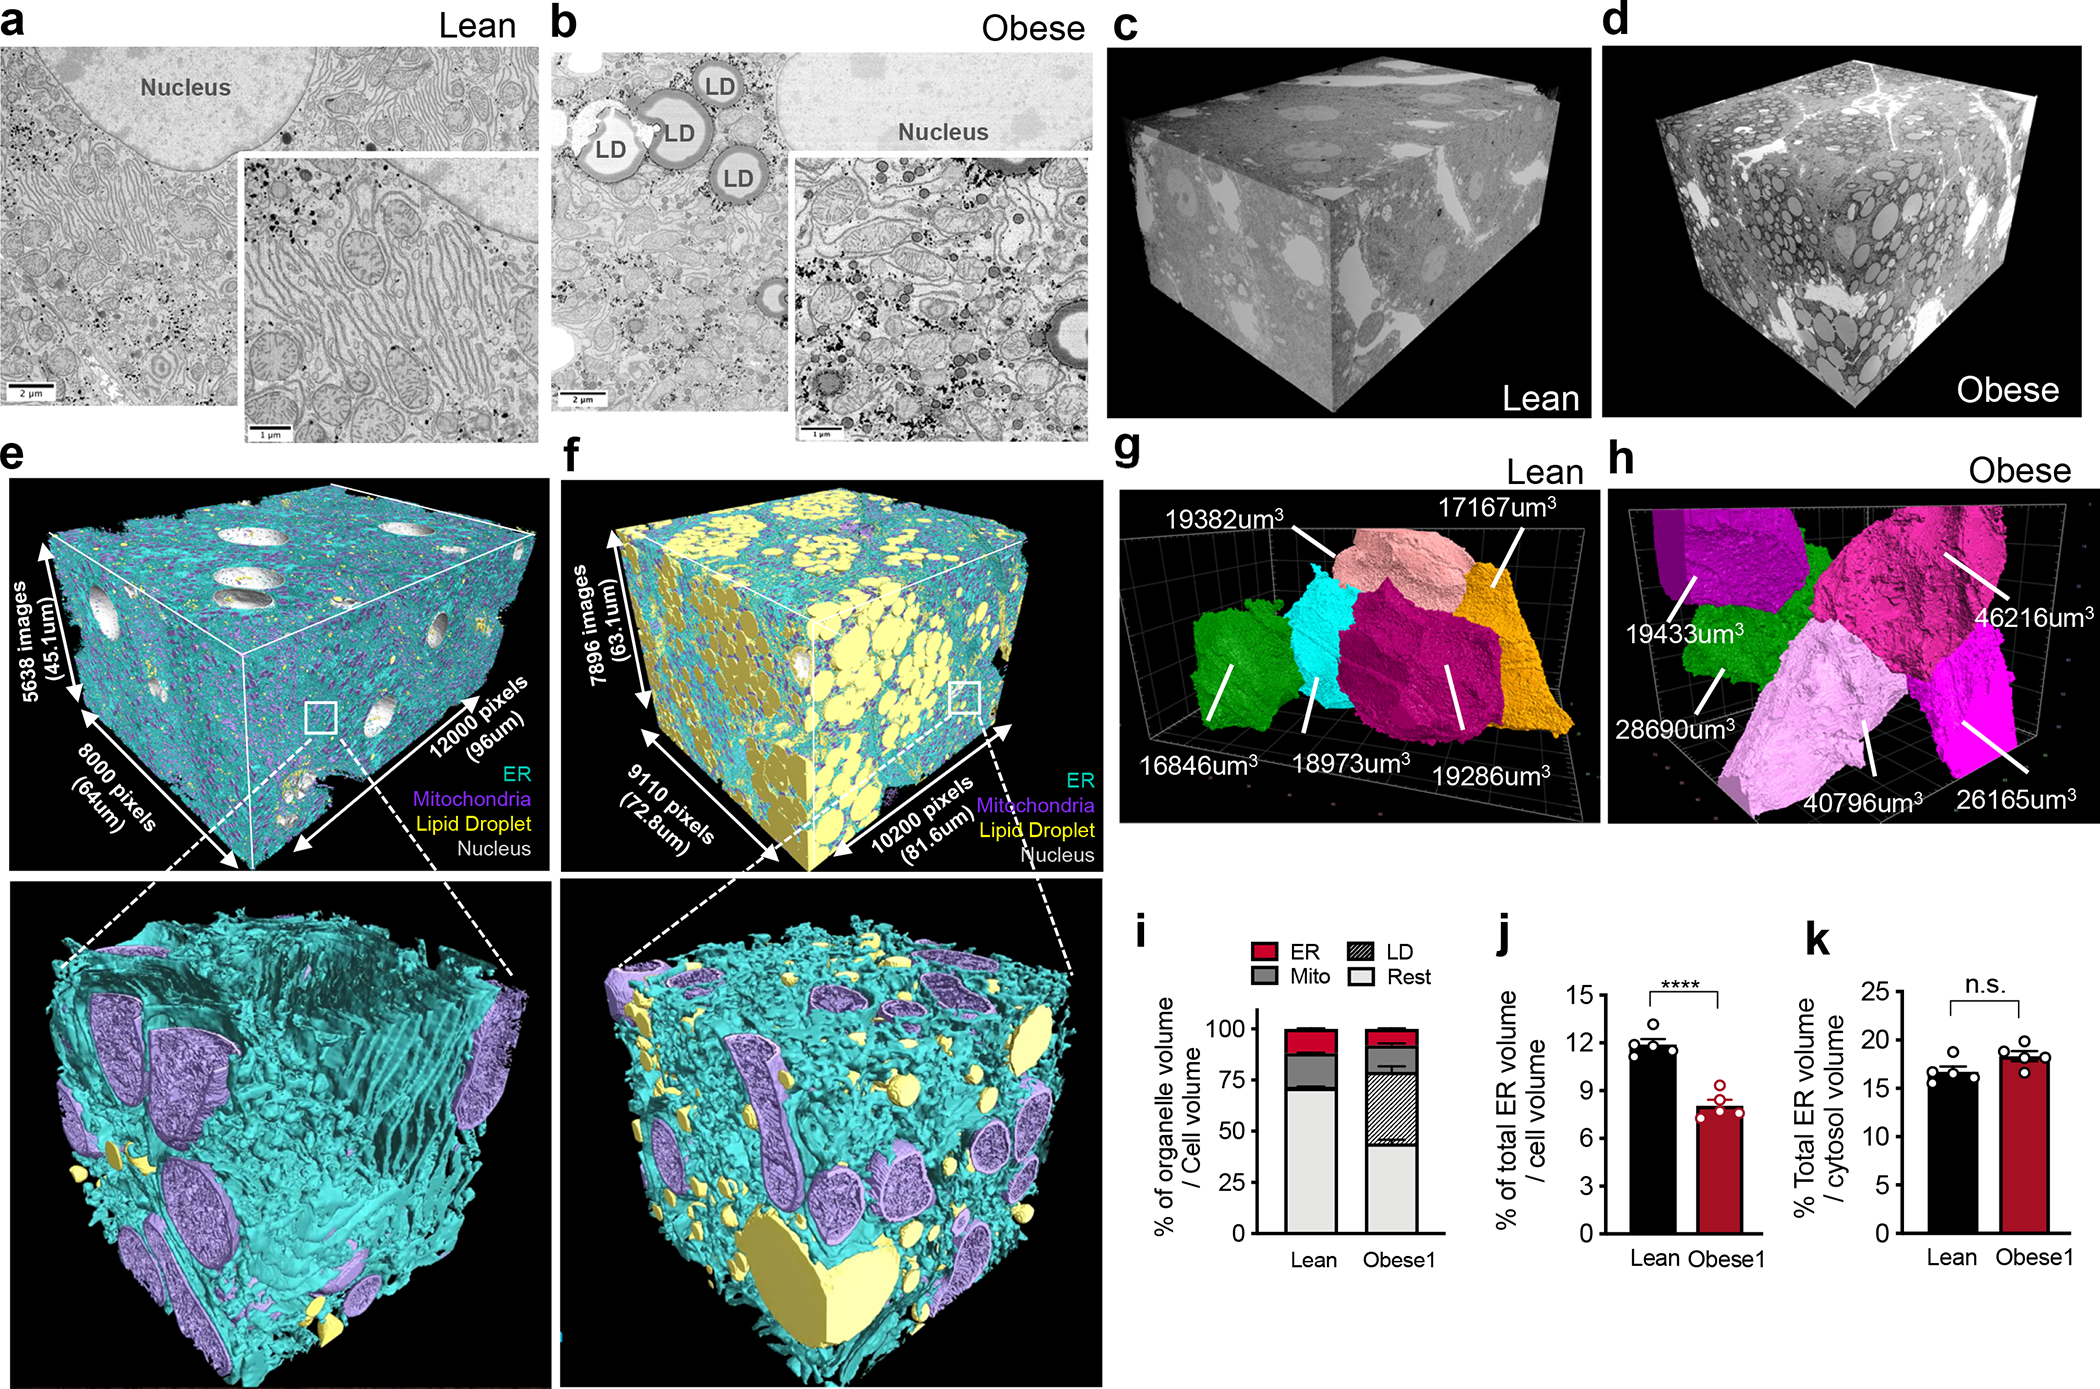
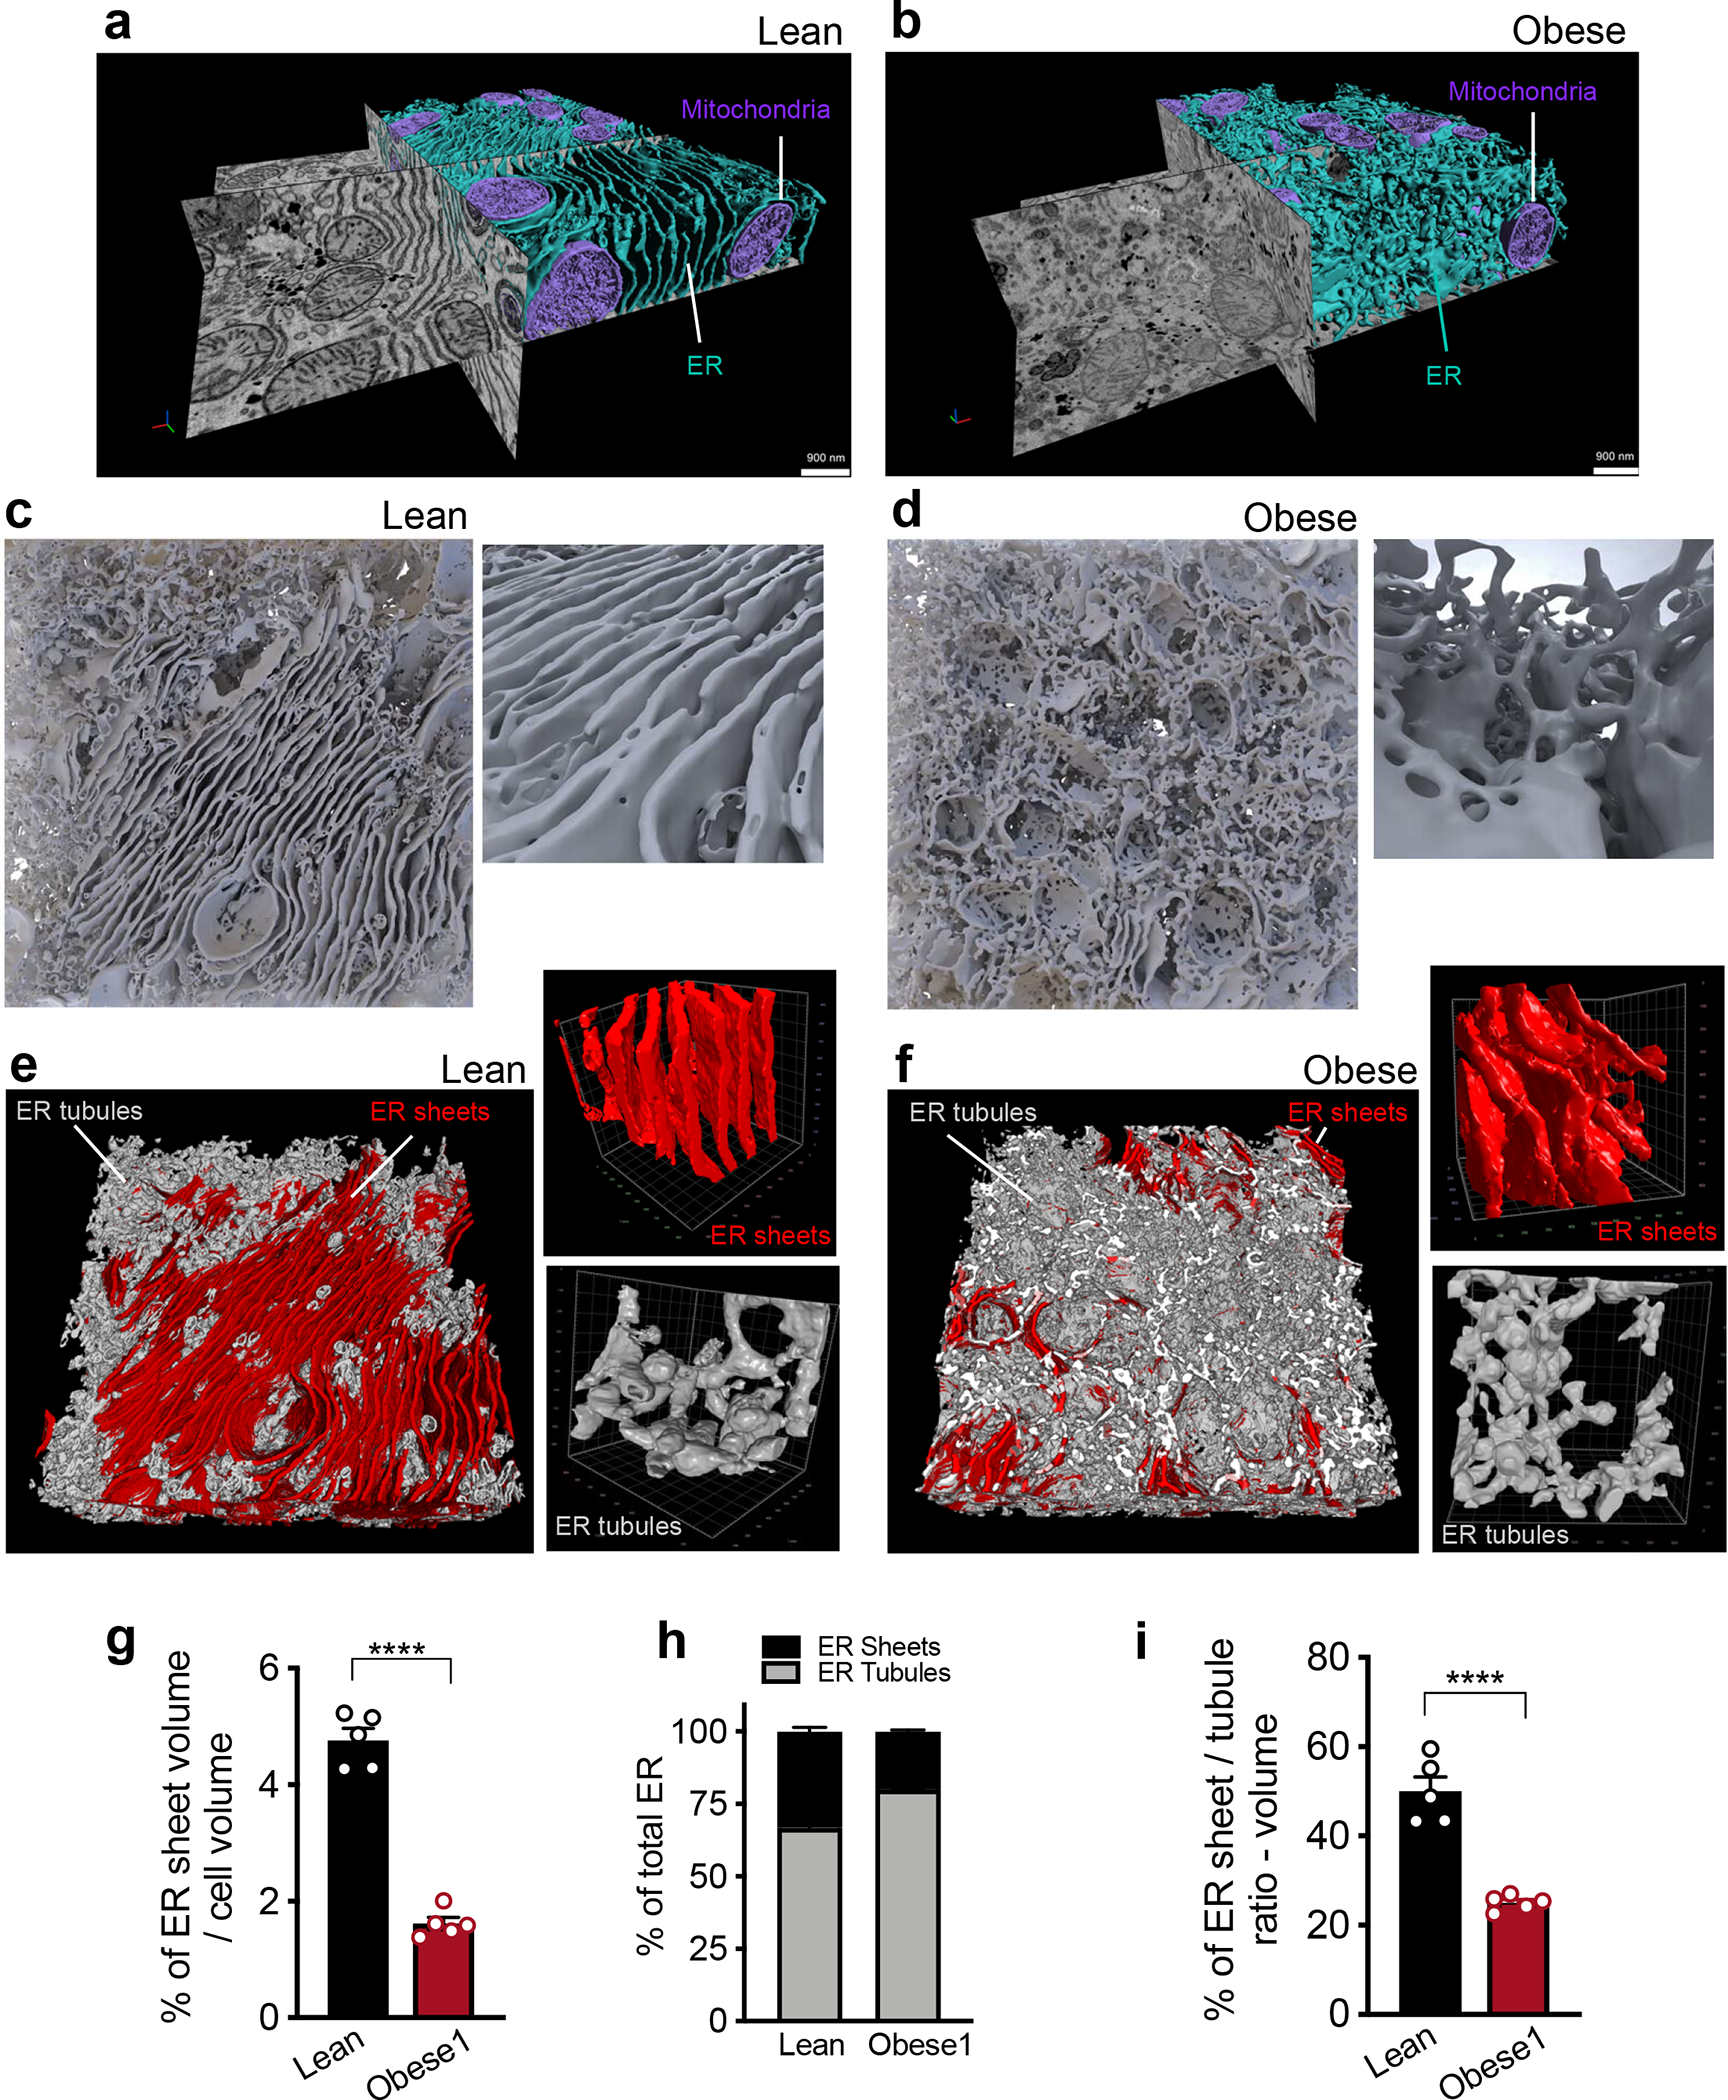
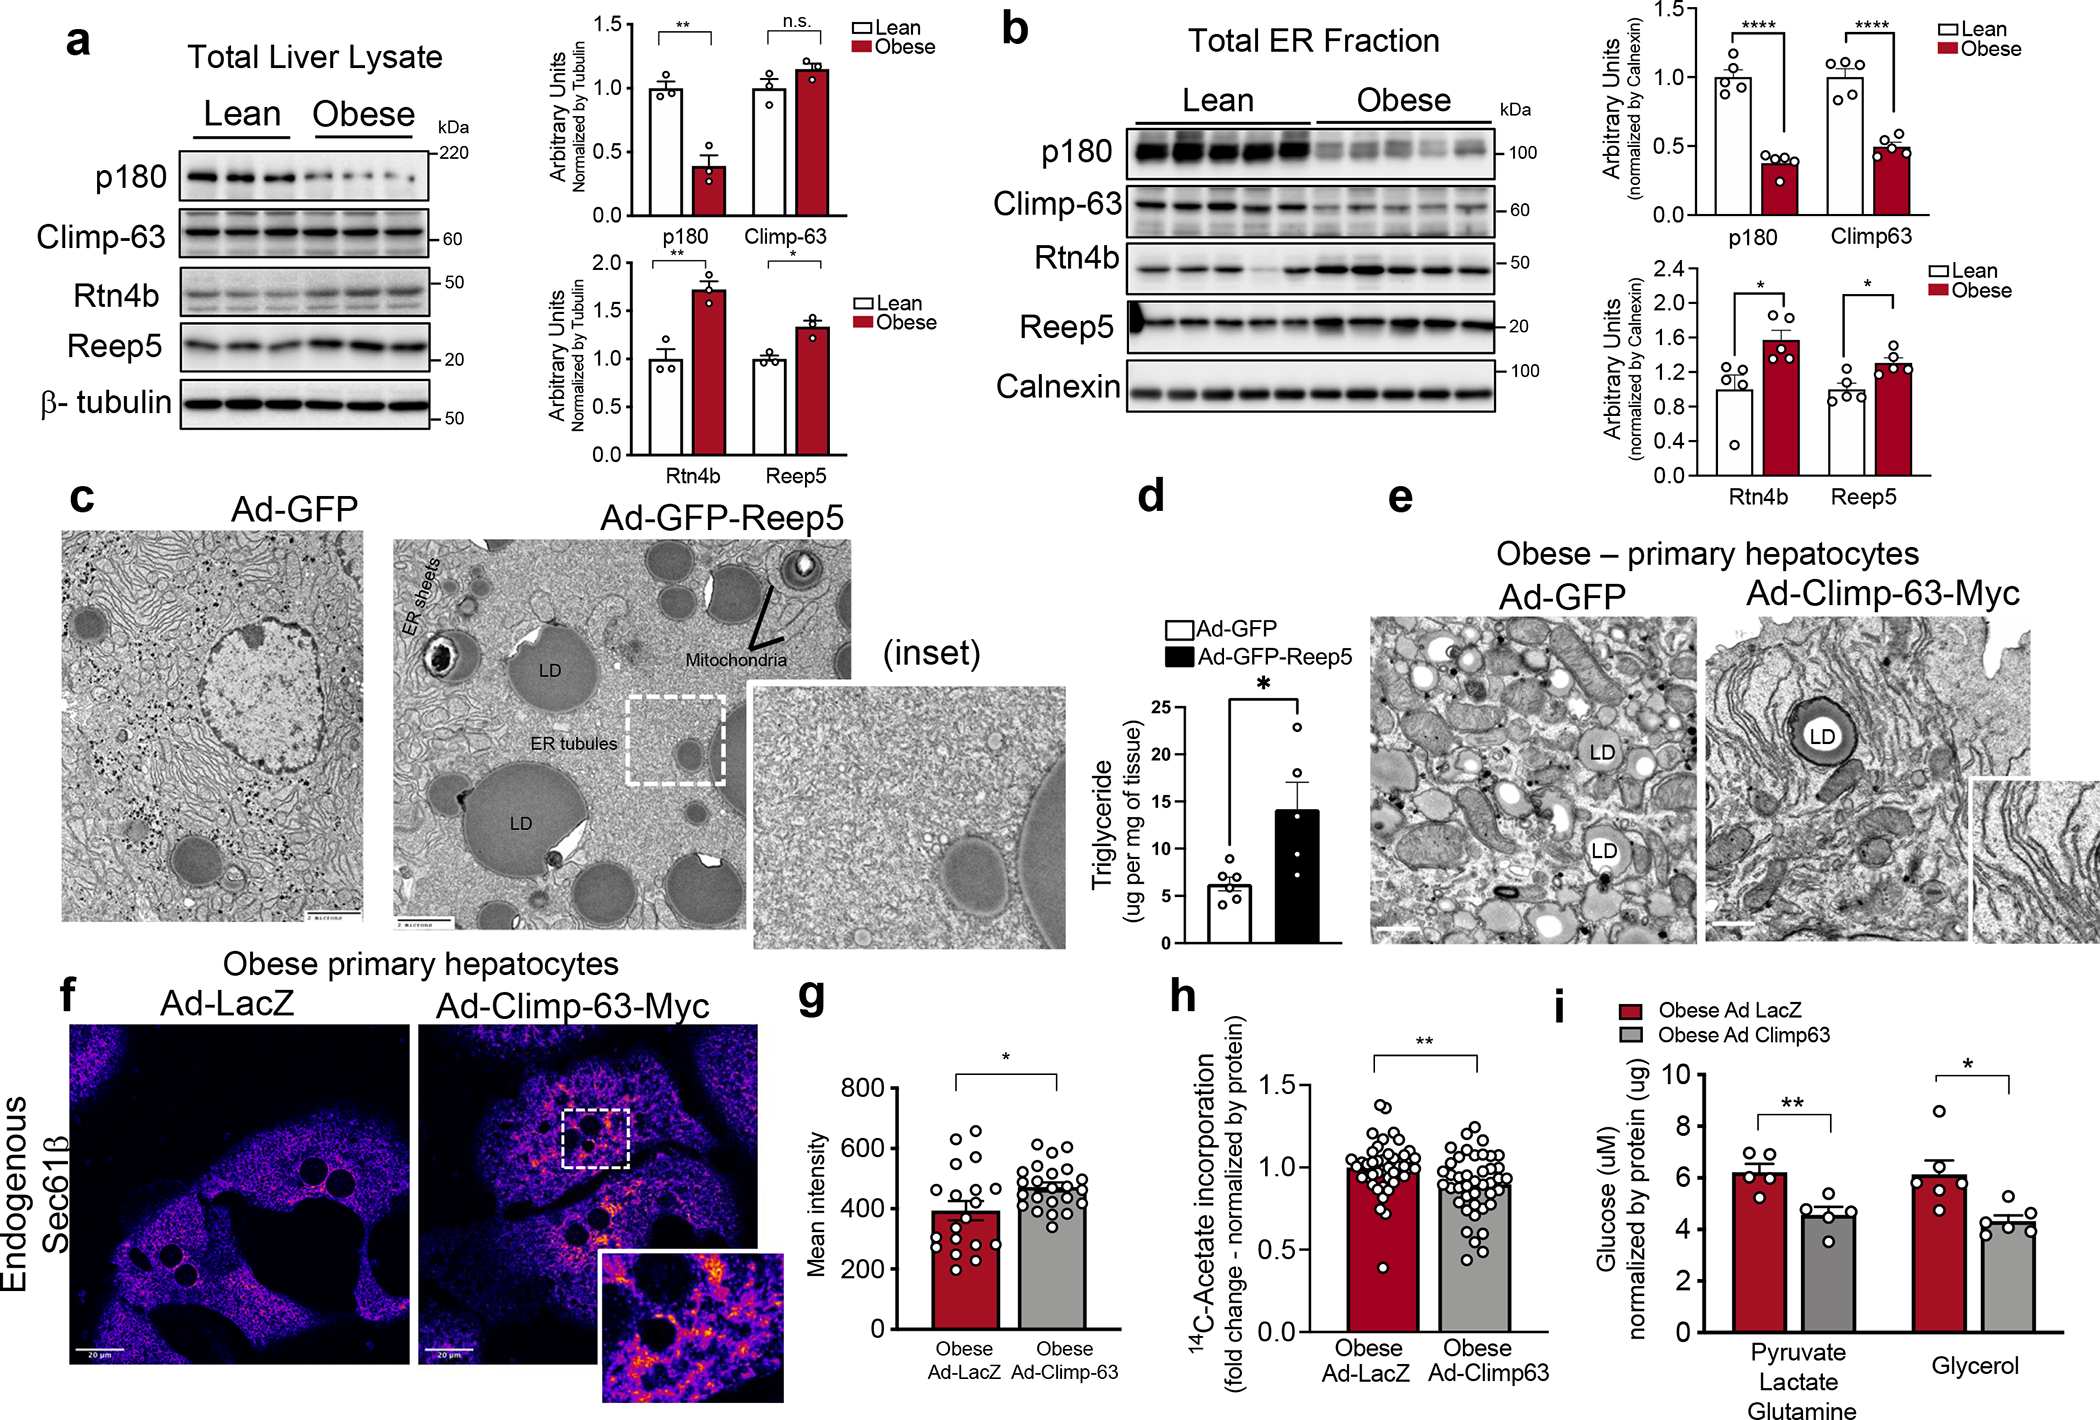
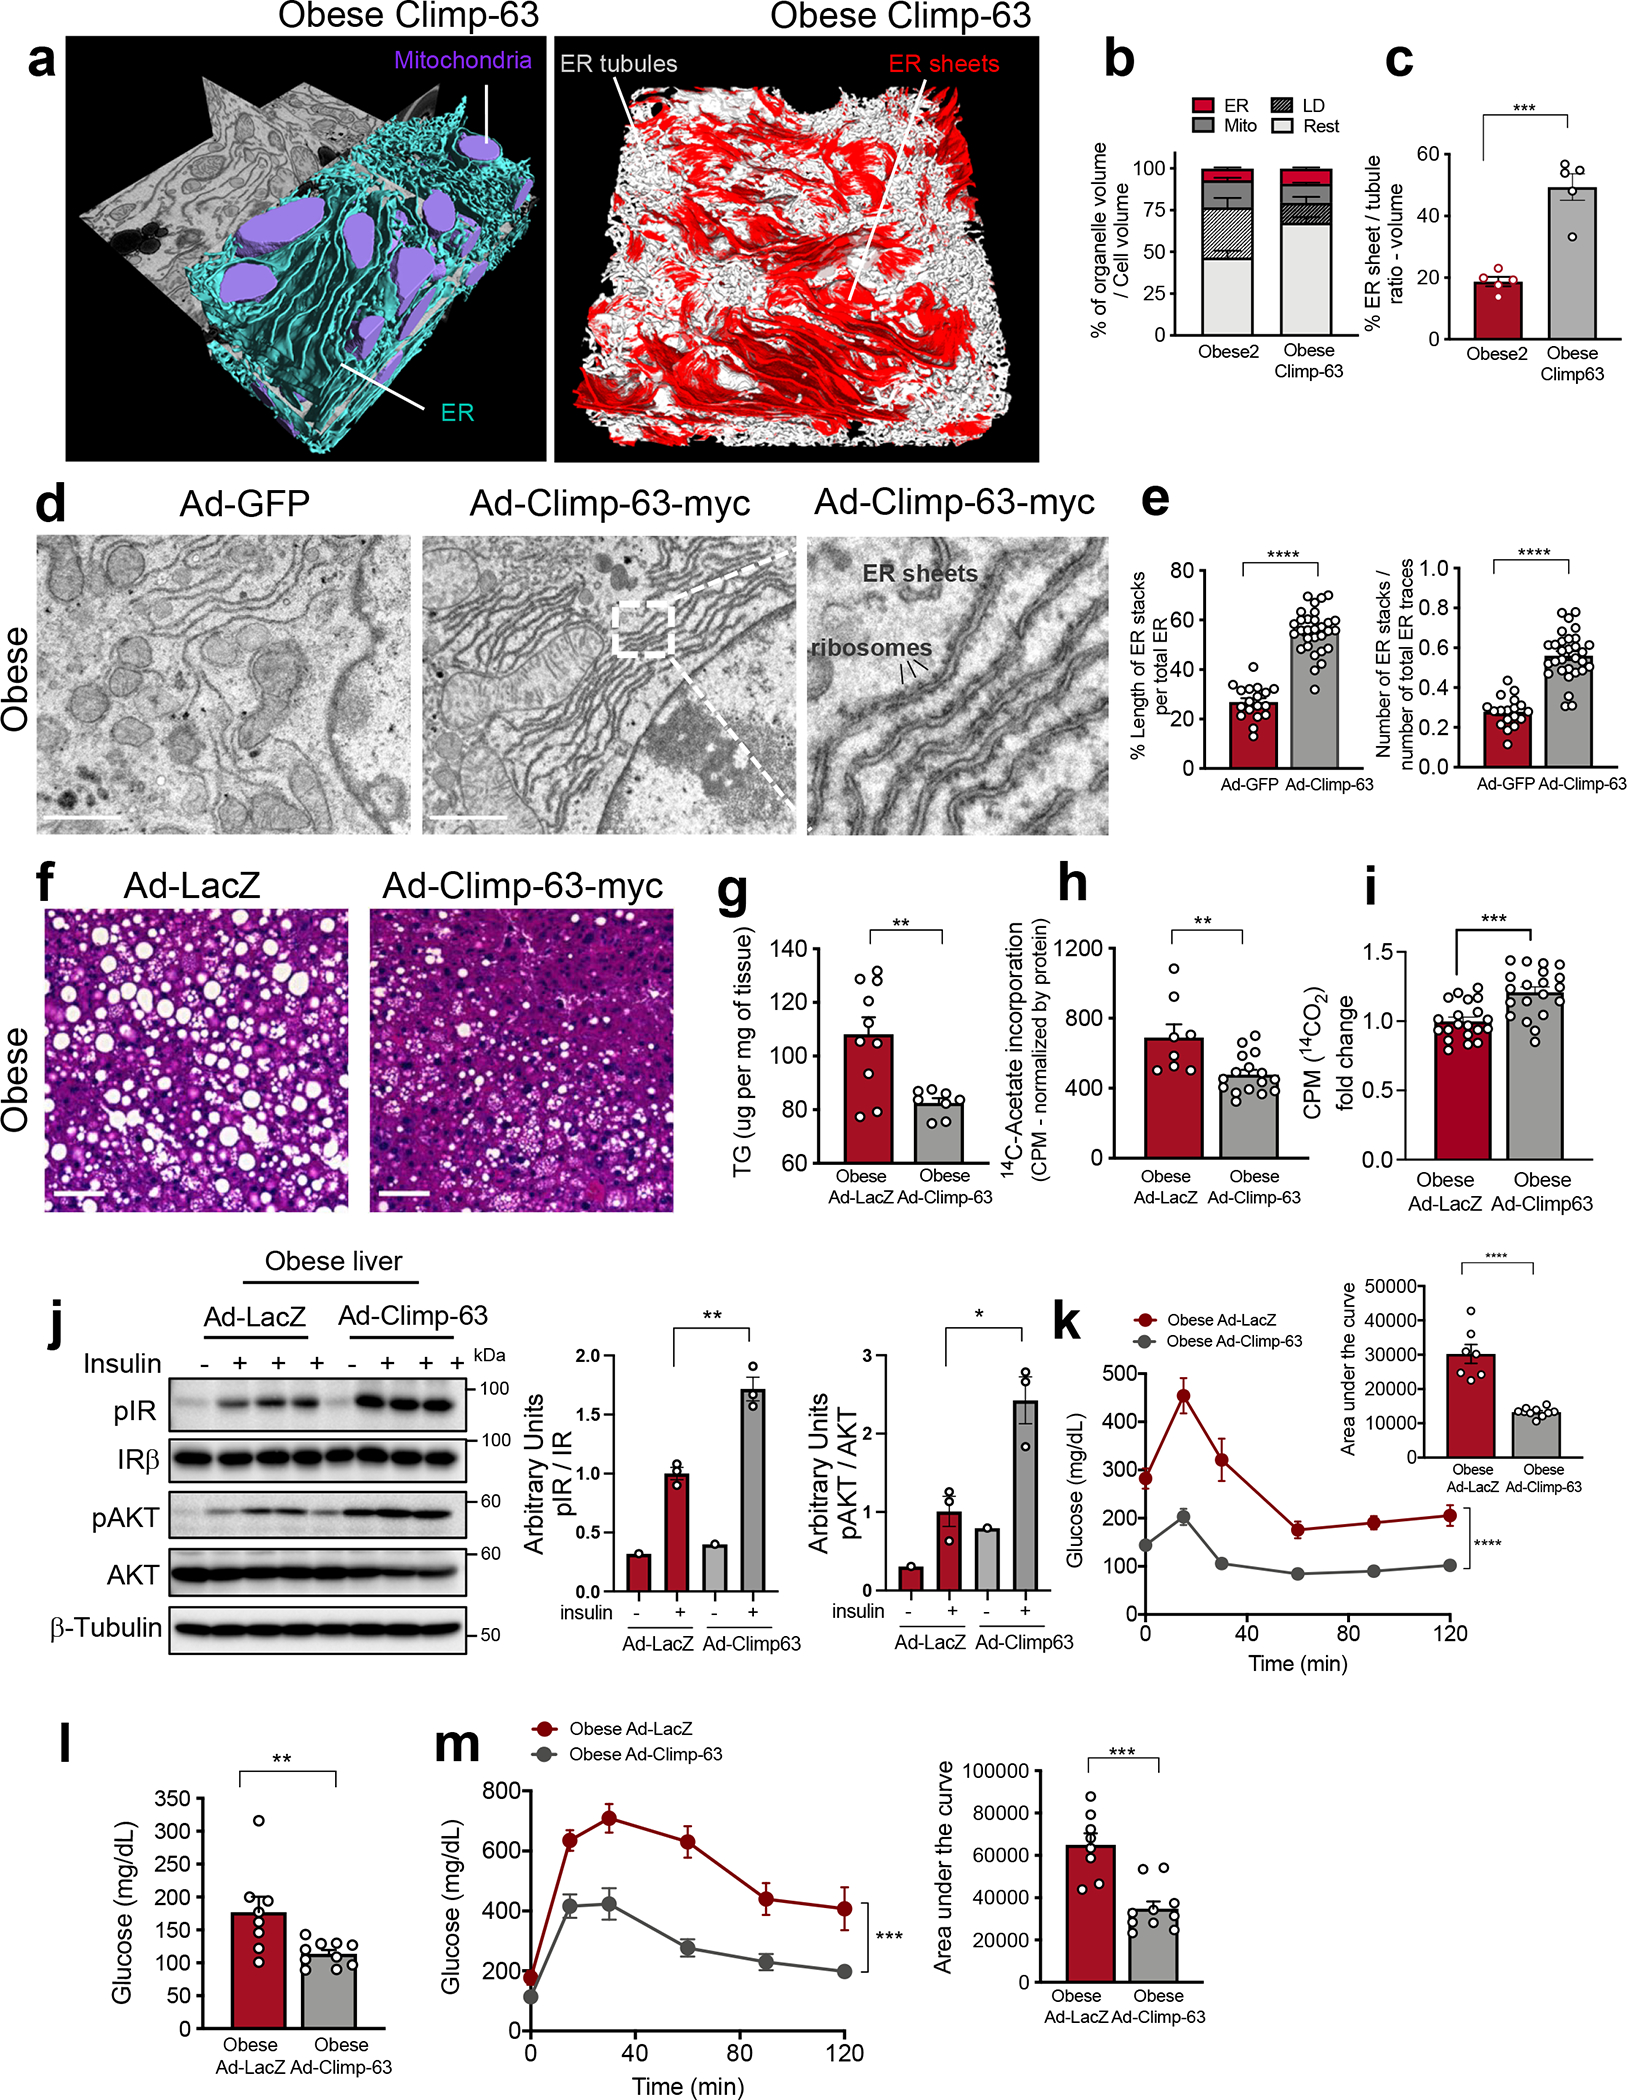
Cells display complex intracellular organization by compartmentalization of metabolic processes into organelles, yet the resolution of these structures in the native tissue context and their functional consequences are not well understood. Here we resolved the three-dimensional structural organization of organelles in large (more than 2.8 × 105 µm3) volumes of intact liver tissue (15 partial or full hepatocytes per condition) at high resolution (8 nm isotropic pixel size) using enhanced focused ion beam scanning electron microscopy1,2 imaging followed by deep-learning-based automated image segmentation and 3D reconstruction. We also performed a comparative analysis of subcellular structures in liver tissue of lean and obese mice and found substantial alterations, particularly in hepatic endoplasmic reticulum (ER), which undergoes massive structural reorganization characterized by marked disorganization of stacks of ER sheets3 and predominance of ER tubules. Finally, we demonstrated the functional importance of these structural changes by monitoring the effects of experimental recovery of the subcellular organization on cellular and systemic metabolism. We conclude that the hepatic subcellular organization of the ER architecture are highly dynamic, integrated with the metabolic state and critical for adaptive homeostasis and tissue health.


Conflict of interest statement

Competing interests

C.S.X and H.F.H are the inventors of a US patent assigned to HHMI for the enhanced FIB-SEM systems used in this work: Xu, C.S., Hayworth K.J., Hess H.F. (2020) Enhanced FIB-SEM systems for large-volume 3D imaging. US Patent 10,600,615, 24 Mar 2020. Other authors have no conflicts of interest to declare.

Figures

Extended Data Fig. 1 |
Extended Data Fig. 1 |. Workflow of automated deep-learning-based segmentation.
a, Workflow for automated segmentation of organelles using convolution neuronal network-based machine learning. b, Section of liver volume from lean (right) and obese (left) with ER (blue), mitochondria (purple), cristae (pink) and lipid droplet (yellow) annotation and reconstruction. c, Percent of ER sheet volume normalized by cytosol volume. n=5 per group (***p=0.0003). d, Percent of ER tubule volume normalized by cytosol volume, n=5 for each group, (***p=0.0006), (here cytosol was considered as the cell volume minus the volume occupied by lipid droplets, mitochondria, and ER). All data (Ext. Data Fig. 1c, d) are presented as mean values +/− SEM. Unpaired t-test was used for all the statistical analyses.
Extended Data Fig. 2 |
Extended Data Fig. 2 |. Parallel organized stacks of ER sheets are decreased in obesity.
a, Workflow for manual annotation and quantification of parallel organized ER sheets. We considered two neighboring ER sheets as “parallel” if more than 50% of the two neighboring ER traces are within in 55–225 nm distance range (5–20 pixel range) from each other. b, TEM of acinar cell section was used as a positive control for training the algorithm, since this cell type is enriched in parallel ER sheets. c, TEM of Hepa 1–6 cell used as a negative control for training the algorithm, since this cell type is devoid of parallel ER sheets. d, Binary masks of manually annotated ER from the TEM images acquired in 1500x mag. White and red represent ER traces, where parallel organized ER is segmented in red, blue: nucleus (N). Bottom images are representative TEM images of liver sections derived from lean and obese mice. ER (endoplasmic reticulum), Mito (mitochondria), LD (lipid droplet). Scale bar: 2.236um. e, Quantification of the length of parallel ER stacks normalized by total ER length (****p<0.0001). f, Number of parallel ER stacks normalized by total number of ER traces (****p<0.0001). g, Quantification of the area of total parallel ER sheet traces (****p<0.0001). h, Quantification of the total ER area (*p=0.0258). i, Ratio of the area of parallel ER stacks to plasma membrane (****p<0.0001). j, Ratio of the total area of ER traces to plasma membrane (**p=0.0059). e-j, n=20 cells from 4 mice per condition. All data (Ext. Data Fig. 2e, j) are presented as mean values +/− SEM. Unpaired t-test was used for all the statistical analyses.
Extended Data Fig. 3 |
Extended Data Fig. 3 |. Rough ER is downregulated in obesity.
a, Immunoblot analysis of the indicated proteins and validation of the rough – smooth ER fractionation. TL: total liver lysate, RER: rough endoplasmic reticulum, SER: smooth ER, Mito: mitochondria, Cyto: cytosolic fraction. b, TEM of rough and c, smooth ER vesicles isolated from livers derived from lean and obese mice. ER recovered in the denser sucrose fraction is enriched in ribosomes in both lean and obese samples (b), while the smooth ER fraction was characterized by microsomes vesicles devoid of ribosomes (c). d, milligrams of rough (***p=0.0004) and e, smooth (p=0.0917) ER vesicles recovered by subcellular fractionation normalized by milligram of liver. f, Ratio of abundance of rough to smooth ER vesicles (**p=0.0014) in lean and obese mice. n=6 per group. g, Confocal images and quantification of immunofluorescence staining for endogenous Sec61β in primary hepatocytes from lean and obese mice. n=3 fields lean and n=5 fields obese, representative of 3 independent hepatocyte isolations (**p=0.0018). h, Confocal images of immunofluorescence staining for endogenous Sec61β in liver sections from lean and obese mice. Right panel: Quantification of fluorescence intensity of immunofluorescence staining for endogenous Sec61β in liver sections from lean and obese mice. n=8 fields for lean and 7 fields for obese mice, representative of 2 mice per group (****p=0.0001). All data (Ext. Data Fig. 3d–h) are presented as mean values +/− SEM. Unpaired t-test was used for all the statistical analyses.
Extended Data Fig. 4 |
Extended Data Fig. 4 |. Analysis of translocon complex and chaperone expression.
a, Left panel: Immunoblot analysis of the indicated proteins in total liver lysates from lean and obese mice. Right panel: Quantification of the immunoblots. n=5 mice per group, representative of 3 independent cohorts (*p=0.016, **p=0.0057, ***p=0.0001). b, c, Immunoblot analysis (top) and quantification (bottom) of indicated proteins in rough and smooth ER fractions from livers of lean and obese mice (*p<0.013, **p<0.006, ***p<0.0002). n=3 mice per condition. The quantification of all the proteins in the blots were normalized to signal for Calnexin shown in Extended Data Fig. 4c. All data (Ext. Data Fig. 4a–c) are presented as mean values +/− SEM. Unpaired t-test was used for all the statistical analyses.
Extended Data Fig. 5 |
Extended Data Fig. 5 |. Validation of organelle fractionation and antibodies.
a, Immunoblot analysis of the indicated proteins and validation of the organelle fractionation. TL: total liver lysate, ER: endoplasmic reticulum, Nuc: nucleus, Mito: mitochondria, Cyto: cytosolic fraction. b, Immunoblot analysis and quantification (c) of indicated proteins in rough and smooth ER fractions from livers of lean (n=3) and obese (n=3) mice. The quantification of all the proteins in these blots were normalized to signal for Calnexin shown in Extended Data Fig. 4c (*p<0.038, **p<0.0085), as these samples were from the same experiment. d, Immunoblot analysis for Reticulon 4A (Rtn4a) and 4B (Rtn4b) in total lysates from Hepa1–6 cells expressing GFP control or Rtn4A tagged with GFP or transfected with shRNA control (scrambled, Scr) or shRNA against Reticulon4. e, Immunoblot analysis for Climp-63 in total lysates from Hepa1–6 cells expressing GFP control or Climp-63 tagged with RFP or Myc or transfected with shRNA control (scrambled, Scr) or shRNA against Climp-63. f, Immunoblot analysis for RRBP1 (p180) in total liver lysates derived from wildtype (Wt) and RRBP1 deficient mice. All data (Ext. Data Fig. 5c) are presented as mean values +/− SEM. Unpaired t-test was used for all the statistical analyses.
Extended Data Fig. 6 |
Extended Data Fig. 6 |. Exogenous expression of Reep5, Rtn4A or Rtn-HD in livers of lean mice leads to hepatic steatosis.
a, Histology sections (H&E staining) from livers of lean mice expressing Ad-GFP control or Ad-GFP-Reep5. b, Immunoblot analysis (left) and quantification (right) of indicated proteins (*p=0.014). n=5 mice per group. c, Glucose tolerance test in lean mice expressing Ad-GFP (n=7 mice) or Ad-Reep5 (n=7 mice). d-e, Representative TEM images derived from livers of lean mice exogenously expressing (d) full length Rtn4A and (e) Reticulon4 homology domain (Ad-GFP-Rtn-HD). Ad: Adenovirus. Magnified insets show smooth ER proliferation and lipid droplets, white arrows show autophagosomes. f, Histology sections (H&E staining) from livers of lean mice expressing Ad-LacZ control or Ad-RTN4A (left) or Ad-GFP-Rtn-HD (right). g, Triglyceride content of livers from lean mice expressing either Ad-LacZ control (n=10 mice) or Ad-Rtn4A construct (n=6 mice) (left side) (*p=0.019) and Ad-GFP control (n=6 mice) or Ad-GFP-Rtn-HD construct (n=6 mice) (right side) (***p=0.0005). h, Immunoblot analysis (left) and quantification (right) of indicated proteins. Ad-LacZ (n=6 mice), Ad-Rtn4A (n=6 mice) (p=0.06). Ad-GFP (n=7 mice), Ad-Rtn-HD (n=6 mice) (*p=0.025). All data (Ext. Data Fig. 6b, g, h) are presented as mean values +/− SEM. Unpaired t-test was used for all the statistical analyses.
Extended Data Fig. 7 |
Extended Data Fig. 7 |. Exogenous expression of Climp-63 in primary hepatocytes and liver in vivo promotes ER sheet formation.
a, Left panel: Confocal images from Cos-7 cells exogenously expressing Sec61β fused with GFP on its N terminal (GFP- Sec61β) as a fluorescent marker for general ER. Right panel: Overlay of images from Cos-7 cells exogenously expressing GFP-Sec61β (green) and Climp-63 fused with RFP (red) in its C terminal (Climp-63-RFP). Overlay is shown in yellow. b, Representative TEM from Cos-7 cell sections expressing control (pcDNA) or Climp-63-RFP constructs. c, Endogenous staining of KDEL sequence as an ER marker (in green) and Myc-tag (in far red) in lean primary hepatocytes expressing either Ad-LacZ or Ad-Climp-63-Myc. Ad: Adenovirus. d, Confocal images of immunofluorescence staining for Myc reflecting Ad-Climp-63-Myc expression in primary hepatocytes from obese mice, expressing Ad-LacZ or Ad-Climp-63-Myc. e, Gluconeogenesis assay in primary hepatocytes isolated from lean mouse, expressing Ad-LacZ or Ad-Climp-63. n=5 biological replicates. Cells were treated with the indicated gluconeogenic substrates in the presence of glucagon for 3 hours. All data (Ext. Data Fig. 7e) are presented as mean values +/− SEM. Unpaired t-test was used for all the statistical analyses.
Extended Data Fig. 8 |
Extended Data Fig. 8 |. FIB-SEM imaging and automated deep-learning-based segmentation of the 2nd dataset from obese liver and obese liver expressing Climp-63.
a, Single section SEM of liver from obese mouse liver at 8 nm pixel size. b, 3D-reconstruction of FIB-SEM images. c, Convolutional neural network-based automated segmentation of liver volumes. The dimensions of the volume are depicted in the figure. ER (endoplasmic reticulum, blue), Mito (mitochondria, purple), LD (lipid droplet, yellow), Nucleus (gray). d, Single section SEM of liver from obese mouse expressing Ad-Climp-63 in fed state at 8 nm pixel size. e, 3D reconstruction of FIB-SEM images derived from obese Climp-63 liver volume. f, Convolutional neural network-based automated segmentation of liver volumes. The dimensions of the volume are depicted in the figure. ER (endoplasmic reticulum, blue), Mito (mitochondria, purple), LD (lipid droplet, yellow). g, h, Reconstruction of 5 full or partial hepatocyte volumes from obese liver (g) and obese liver expressing Ad-Climp-63 (h). Volumes of the cells are depicted in the figure. i, Sub-segmentation and 3D reconstruction of ER sheets (red) and tubules (gray) from obese mouse dataset. j, Example volumes of ER sheets and k, ER tubules from this dataset. l, Percent of ER sheets (black) and tubules (gray) relative to total ER from indicated datasets. n=5 cells per group. m, Ratio of ER sheets to tubule volume (**p=0.003). n=5 cells per group. n, Lipid droplet content from the indicated datasets. n=5 cells per group. (*p=0.0256). o, Analysis of mitochondria associated membranes (MAMs) from indicated FIB-SEM datasets. Analysis was done in 3 separate volumes of 2000×2000×400 voxels in each dataset (****p<0.0001). p, q, Analysis of mitochondria sphericity and roundness from indicated FIB-SEM datasets. n=127 (lean), n=112 (obese), n=217 (obese Climp-63) mitochondria. Analysis was done in the same volumes as Ext Fig. 8o, with the mitochondria volumes that are fully present in the ROI (*p=0.003, ****p<0.0001). All data (Ext. Data Fig. 8 l–n, p, q) are presented as mean values +/− SEM. Unpaired t-test was used for all the statistical analyses.
Extended Data Fig. 9 |
Extended Data Fig. 9 |. Exogenous Climp-63 expression in livers of obese mice rescues rough/smooth ER ratio, restores GRP78 localization to ER sheets and improves ER folding capacity.
a, Ratio between abundance of rough divided by smooth ER vesicles recovered by liver subcellular fractionation of livers from obese mice expressing Ad-LacZ (n=3 mice) or Ad-Climp-63 (n=3 mice), (*p=0.027). Ad: Adenovirus. b, Immunoblot analysis (left) and quantification (right) of the indicated proteins from total liver lysates (*p=0.03, **p=0.01). n=5 mice for Ad-LacZ and n=6 mice for Ad-Climp-63. c, Immunoblot analysis (left) and quantification (right) of the indicated proteins from rough and smooth ER fractionation (n=3 mice per group) (c), total lysate (n=4 mice per group) (d) and total ER fractions (n=5 mice per group) (e) obtained from obese mice expressing either Ad-LacZ control or Ad-Climp-63 (*p<0.045). f, Scheme describing the ASGR reporter. In this reporter, Cluc indicates the folding and secretion of ASGR-Cluc fusion protein and Gluc, which is constitutively expressed in the construct is used as a normalization of expression level, transfection efficiency and cell densities. g, Quantification of the ratio between luminescence signal from Cluc normalized by luminescence signal derived from Gluc in lean and obese primary hepatocytes. n=14 for lean and n=26 for obese (***p=0.0002). Pooled data from 3 experiments. h, Quantification of the ratio between luminescence signal from Cluc normalized by luminescence signal derived from Gluc in obese primary hepatocytes exogenously expressing GFP or Climp-63. n=36 for GFP and n=35 for Climp-63 (****p<0.0001). Pooled from 6 experiments. All data (Ext. Data Fig. 9a–e, g, h) are presented as mean values +/− SEM. Unpaired t-test was used for all the statistical analyses.
Extended Data Fig. 10 |
Extended Data Fig. 10 |. Climp-63 exogenous expression decreases SCD1 expression in obesity.
a, Immunoblot analysis (left) and quantification (right) of the indicated proteins from total liver lysates obtained from obese mice expressing either Ad-LacZ control or Ad-Climp-63 (**p=0.0046). Ad: Adenovirus. b, c, Immunoblot analysis (top) and quantification (bottom) of the indicated proteins from rough and smooth ER fractions derived from (b) lean and obese mice and (c) obese mice expressing either Ad-LacZ or Ad-Climp-63 (*p<0.049, ****p<0.0001). The quantification of SCD1 in 10b was normalized to signal for Calnexin shown in Extended Data Fig. 4c, as these samples were from the same experiment. d, Representative TEM from liver sections derived from lean control mice or lean mice overexpressing Climp-63-Myc in vivo. e, f, Quantification of stacks of ER sheets in Fig. 10d (*p=0.017). n=3 TEM images per group. g, Glucose tolerance test in lean mice exogenously expressing Ad-GFP (control) or Ad-Climp-63-myc (n=6 mice per group). h, Insulin tolerance test in lean mice expressing Ad-GFP (control) or Ad-Climp-63-myc (n=6 mice per group). All data (Ext. Data Fig. 10a–c, e, f) are presented as mean values +/− SEM. Unpaired t-test was used for all the statistical analyses.
Fig. 1 |
Fig. 1 |. FIB-SEM imaging and automated deep-learning-based segmentation of organelles from intact liver tissue derived from lean and obese mice.
a, b, Single section SEM of liver from lean and obese mice liver in fed state at 8 nm pixel size. c, d, 3D reconstruction of FIB-SEM images derived from liver volumes from (c) lean and (d) obese mice (Supplementary Videos 1, 2). e, f, Convolutional neural network based automated segmentation of liver volumes derived from lean (e) and obese (f) mice. The dimensions of the volumes are depicted in the figure. ER (endoplasmic reticulum, blue), Mito (mitochondria, purple) LD (lipid droplet, yellow), Nucleus (gray). Inset images show 500×500×500 voxel magnified volume from the whole datasets (Supplementary Videos 3, 4). g, h, Reconstruction of 5 full or partial hepatocyte volumes present in the liver volume imaged by FIB-SEM. The volumes of the cells are depicted in the figure. All the reconstructions were performed in Arivis Vision 4D software. i, Percent of organelle volume normalized by total cell volume; n=5 cells for lean and obese mice. j, Percent of total ER volume normalized by cell volume in 5 different cells derived from lean and obese mice (***p<0.0001). k, Percent of total ER volume area normalized by cytosol volume (here cytosol was considered as the cell volume minus the volume occupied by lipid droplets, mitochondria, and ER). n=5 for each group. All data (Fig. 1i–k) are presented as mean values +/− SEM. Unpaired t-test was used for all the statistical analyses.
Fig. 2 |
Fig. 2 |. Large tissue FIB-SEM imaging reveals hepatic ER sheet / tubule ratio is decreased in obesity.
a, b, Partial reconstruction of segmented ER and mitochondria from raw FIB-SEM data derived from hepatocytes of (a) lean and (b) obese mice (Supplementary Videos 5, 6). c, d, 3D reconstruction of segmented ER morphology from lean (c) and obese (d) liver (1000×1000×400 voxels – 8×8×3.2μm3). 3D reconstruction images were generated using Houdini (SideFX) software. Inset shows the ER sheets and tubules in higher magnification (Supplementary Videos 7–9). e, f, Sub-segmentation and 3D reconstruction of ER sheets (red) and tubules (gray) from lean (e) and obese (f) mice. Magnifications show 100×100×100 voxel representation of ER sheets and tubules separately. g, Percent ER sheet volume normalized by cell volume. n=5 cells for the 2 datasets (****p<0.0001). h, Percent of ER sheets (black) and tubules (gray) relative to total ER from lean and obese cells. n=5 cells in each group. i, Ratio of ER sheets to tubule volume (****p<0.0001). n=5 cells in each group. All data (Fig. 2g–i) are presented as mean values +/− SEM. Unpaired t-test was used for all the statistical analyses.
Fig. 3 |
Fig. 3 |. ER shaping proteins are regulated with obesity and exogenous expression of ER shaping proteins regulates metabolic function of hepatocytes.
a, Left panel: Immunoblot analysis of indicated proteins in total liver lysates. Right panel: Quantification of the immunoblots. n=3 for lean and obese (*p<0.03, **p<0.005). b, Left panel: Immunoblot analysis of indicated proteins from ER fraction isolated from livers of lean and obese mice. Right panel: Quantification of the immunoblots. n=5 for lean and obese (*p<0.021, ****p<0.0001). c, Representative TEM images from liver sections of lean mice expressing either Ad-GFP control or Ad-Reep5. Ad: Adenovirus. Inset shows the ER organization in more detail. d, Triglyceride content of livers from lean mice expressing either Ad-GFP control (n=6 mice) or Ad-GFP-Reep5 construct (n=5 mice) (*p=0.016). e, Representative TEM from primary hepatocytes derived from obese mice exogenously expressing GFP (left) and Climp-63-Myc (right). f, Confocal images of immunofluorescence staining for endogenous Sec61β in primary hepatocytes from obese mice expressing Ad-LacZ (left) and Ad-Climp-63-Myc (right). g, Quantification of fluorescence signal. n=19 fields for Ad-LacZ and n=23 fields for Ad-Climp-63 (*p=0.0241), representative of 3 experiments. h, De novo lipogenesis assay in primary hepatocytes isolated from obese mice, expressing Ad-LacZ (control) or Ad-Climp-63. 14C-labeled acetate incorporation into the newly synthesized lipids was measured and normalized by total protein (**p=0.0089). n=42 measurements (from 5 mice per group), combined from 5 independent experiments. i, Gluconeogenesis assay in primary hepatocytes isolated from obese mice, expressing Ad-LacZ or Ad-Climp-63 (*p=0.0109, **p=0.0058). Cells were treated with the indicated gluconeogenic substrates in the presence of 100nM glucagon for 3 hours. n=5 biological replicates for pyruvate, lactate and glutamine and n=6 biological replicates for glycerol condition. All data (Fig. 3a–c, g–i) are presented as mean values +/− SEM. Unpaired t-test was used for all the statistical analyses.
Fig. 4 |
Fig. 4 |. Expression of Climp-63 in livers of obese mice improves systemic metabolism.
a, Segmentation of FIB-SEM from liver of obese mouse expressing Climp-63. b, Percent of organelle volume per cell; n=5 cells/group. c, Ratio of ER sheets to tubule volume in 5 cells/group (***p=0.0001). d, TEM from livers of obese mice expressing Ad-GFP (left) and Ad-Climp-63-Myc (right) Ad: Adenovirus. Scale: 1.118um. Inset: High-magnification image of ribosomes associated with ER sheets. e, Quantification of parallel stacks of ER in liver sections presented in Fig. 4d. n=18 for GFP and n=30 for Climp-63-myc TEM images of 3 mice per group (****p<0.0001). f, H&E staining of liver sections of obese mice expressing Ad-GFP (left) or Ad-Climp-63 (right). Scale bar: 65.4um. g, Liver triglyceride from Ad-LacZ (n=10) and Ad-Climp-63 (n=8) expressing obese mice (**p=0.0028). h, De novo lipogenesis assay; radioactivity normalized by mg of liver. n=8 liver lobes from 2 obese mice expressing Ad-LacZ and n=16 liver lobes from 4 obese mice expressing Ad-Climp-63 (**p=0.0037). i, 14C-palmitic acid-driven fatty acid oxidation in hepatocytes (obese) expressing Ad-LacZ (n=20) or Ad-Climp-63 (n=20). Pooled from 4 independent experiments (***p=0.0001). j, Left: Immunoblot of proteins in total liver lysates. Right: Quantification of immunoblots. n=3 for Ad-LacZ insulin+ and Ad-Climp-63 insulin+ (*p<0.017, **p=0.003). k, Insulin tolerance test in obese mice. n=7 for LacZ and n=10 for Climp-63-myc. Representative of 3 independent experiments (****p<0.0001). l, Blood glucose levels after overnight fasting. n=8 for Ad-LacZ and n=10 for Ad-Climp-63-myc (**p=0.0098). m, Left: Glucose tolerance test in obese mice expressing Ad-LacZ or Ad-Climp-63-myc. Right: area under the curve. n=8 Ad-LacZ and n=10 Ad-Climp-63-myc animals, representative of 3 independent experiments (***p=0.0002). All data (Fig. 4b,c,e,g–m) are presented as mean values +/− SEM. Unpaired t-test was used for all the statistical analyses, except for 4k-m. Two-way ANOVA was used in Fig. 4k,m.

References

    1. Xu CS et al. Enhanced FIB-SEM systems for large-volume 3D imaging. eLife 6, (2017). - PMC - PubMed
    1. Xu CS, Pang S, Hayworth KJ & Hess HF Transforming FIB-SEM systems for large-volume connectomics and cell biology. in Neuromethods vol. 155 221–243 (Humana Press Inc., 2020).
    1. Terasaki M et al. Stacked endoplasmic reticulum sheets are connected by helicoidal membrane motifs. Cell 154, 285–296 (2013). - PMC - PubMed
    1. Ben-Moshe S & Itzkovitz S Spatial heterogeneity in the mammalian liver. Nature Reviews Gastroenterology & Hepatology 16, 395–410 (2019). - PubMed
    1. Lee AH, Chu GC, Iwakoshi NN & Glimcher LH XBP-1 is required for biogenesis of cellular secretory machinery of exocrine glands. EMBO Journal 24, 4368–4380 (2005). - PMC - PubMed

Method References

    1. Fu S et al. Aberrant lipid metabolism disrupts calcium homeostasis causing liver endoplasmic reticulum stress in obesity. Nature 473, 528–531 (2011). - PMC - PubMed
    1. Arruda AP et al. Defective STIM-mediated store operated Ca2+ entry in hepatocytes leads to metabolic dysfunction in obesity. eLife 6, (2017). - PMC - PubMed
    1. Shibata Y et al. The reticulon and DP1/Yop1p proteins form immobile oligomers in the tubular endoplasmic reticulum. The Journal of biological chemistry 283, 18892–18904 (2008). - PMC - PubMed
    1. Akie TE & Cooper MP Determination of fatty acid oxidation and lipogenesis in mouse primary hepatocytes. JoVE (Journal of Visualized Experiments) 2015, e52982 (2015). - PMC - PubMed
    1. Margolis RN, Cardell RR & Curnow RT Association of glycogen synthase phosphatase and phosphorylase phosphatase activities with membranes of hepatic smooth endoplasmic reticulum. The Journal of cell biology 83, 348–356 (1979). - PMC - PubMed