. 2022 Mar;603(7902):721-727.
doi: 10.1038/s41586-022-04499-2. Epub 2022 Mar 9.

Tryptophan depletion results in tryptophan-to-phenylalanine substitutants

Affiliations

Tryptophan depletion results in tryptophan-to-phenylalanine substitutants

Abhijeet Pataskar et al. Nature. 2022 Mar.

Erratum in

  • Author Correction: Tryptophan depletion results in tryptophan-to-phenylalanine substitutants.
    Pataskar A, Champagne J, Nagel R, Kenski J, Laos M, Michaux J, Pak HS, Bleijerveld OB, Mordente K, Navarro JM, Blommaert N, Nielsen MM, Lovecchio D, Stone E, Georgiou G, de Gooijer MC, van Tellingen O, Altelaar M, Joosten RP, Perrakis A, Olweus J, Bassani-Sternberg M, Peeper DS, Agami R. Pataskar A, et al. Nature. 2022 Aug;608(7922):E20. doi: 10.1038/s41586-022-05097-y. Nature. 2022. PMID: 35840685 Free PMC article. No abstract available.

Abstract

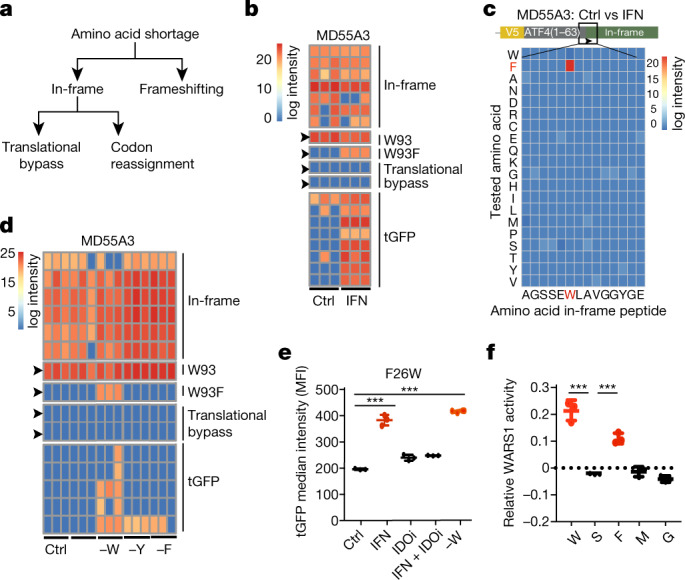
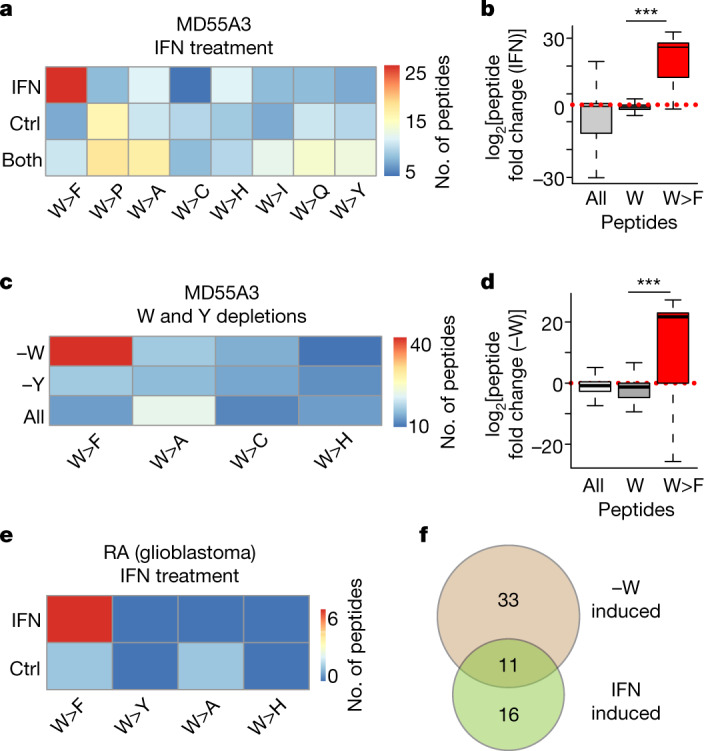
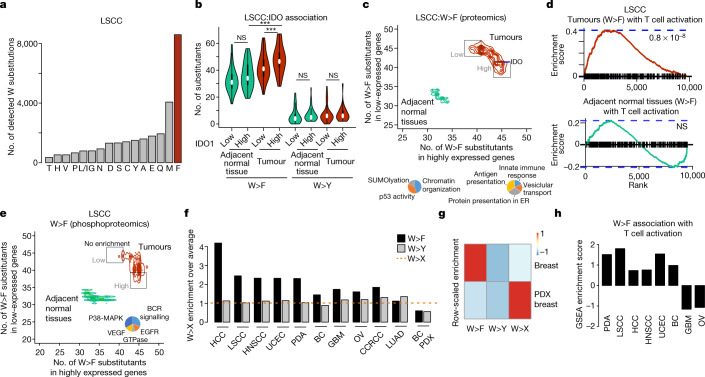
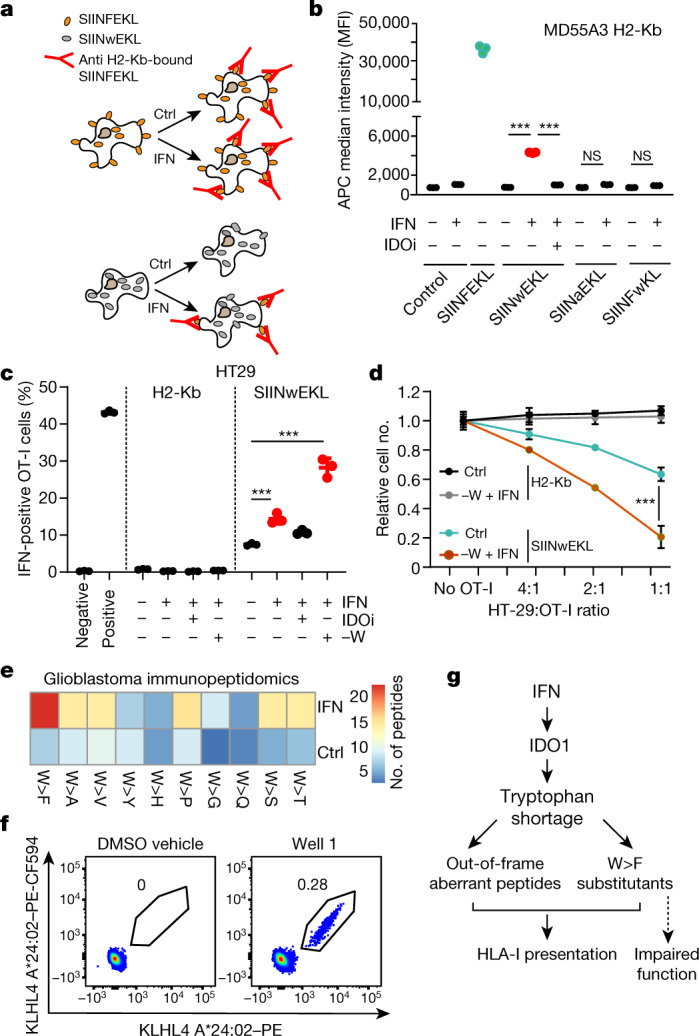
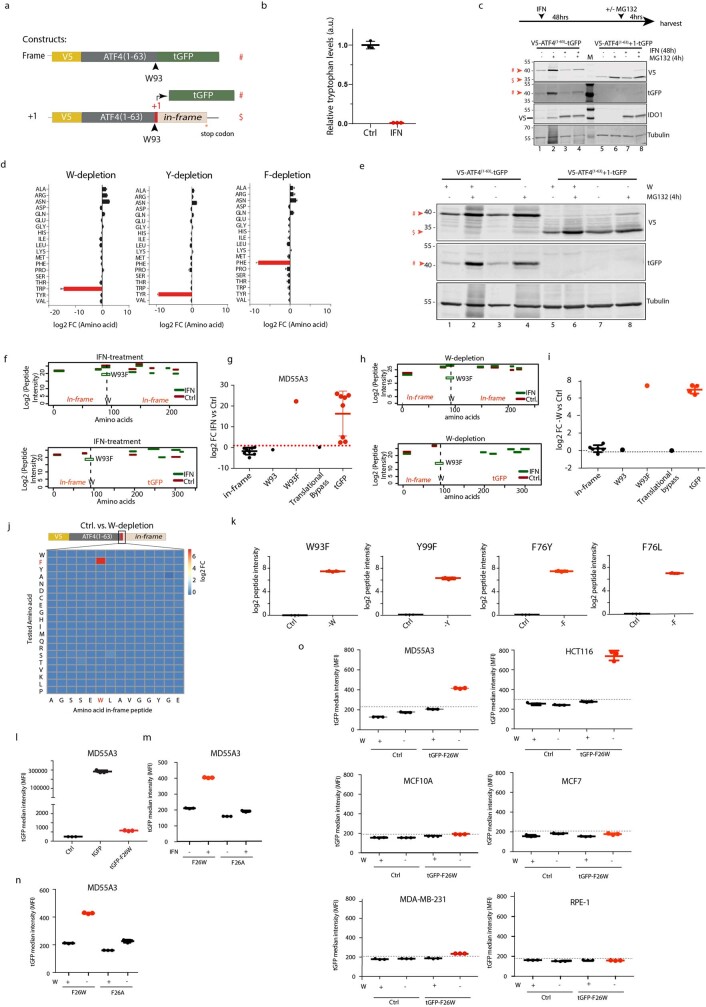
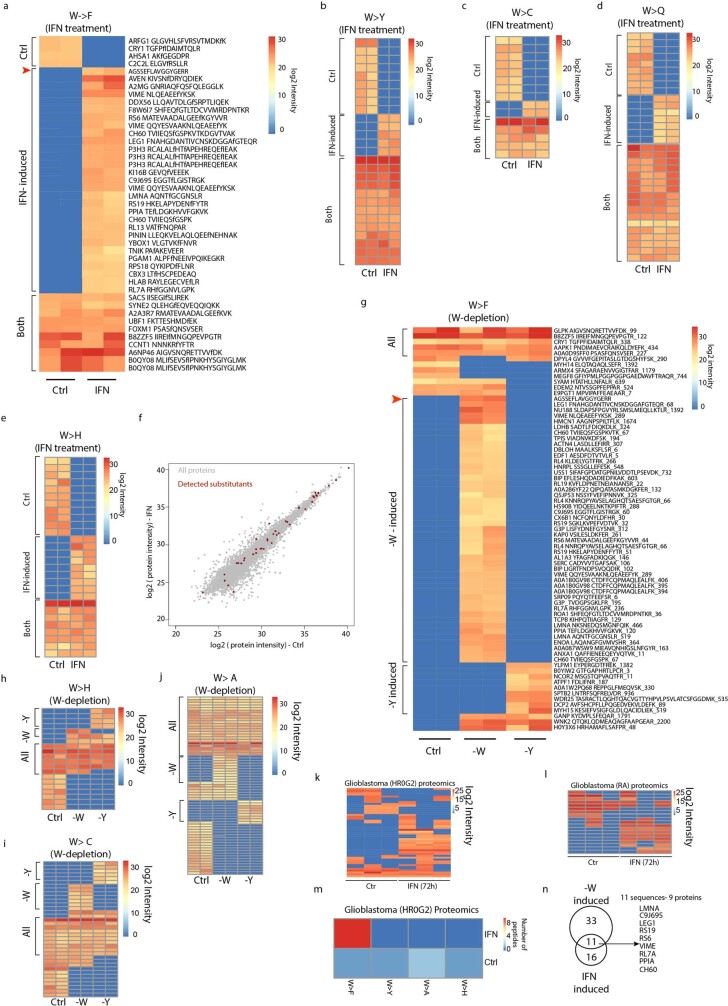
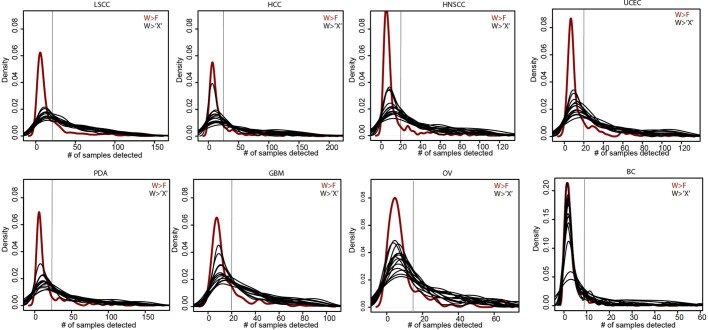
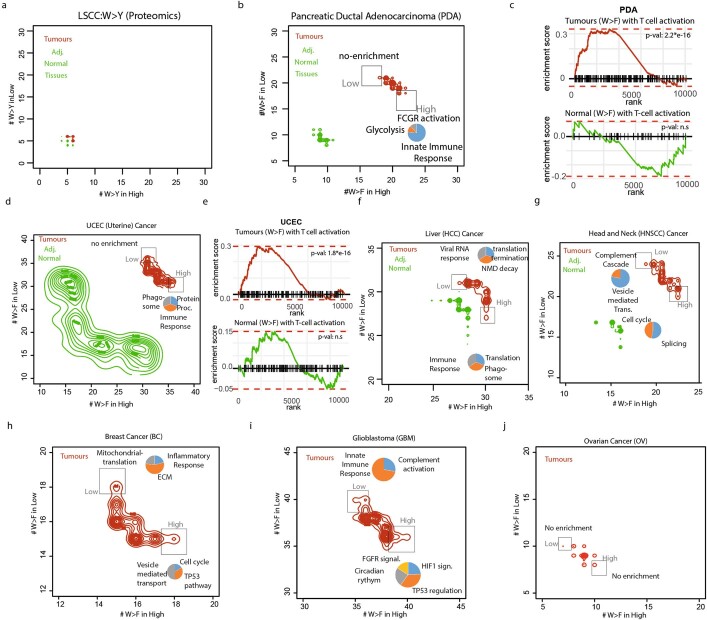
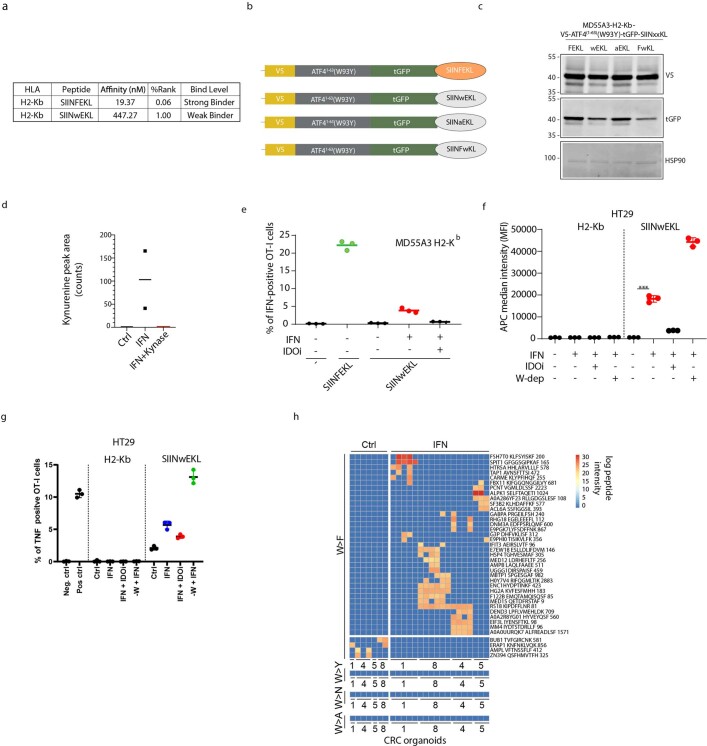
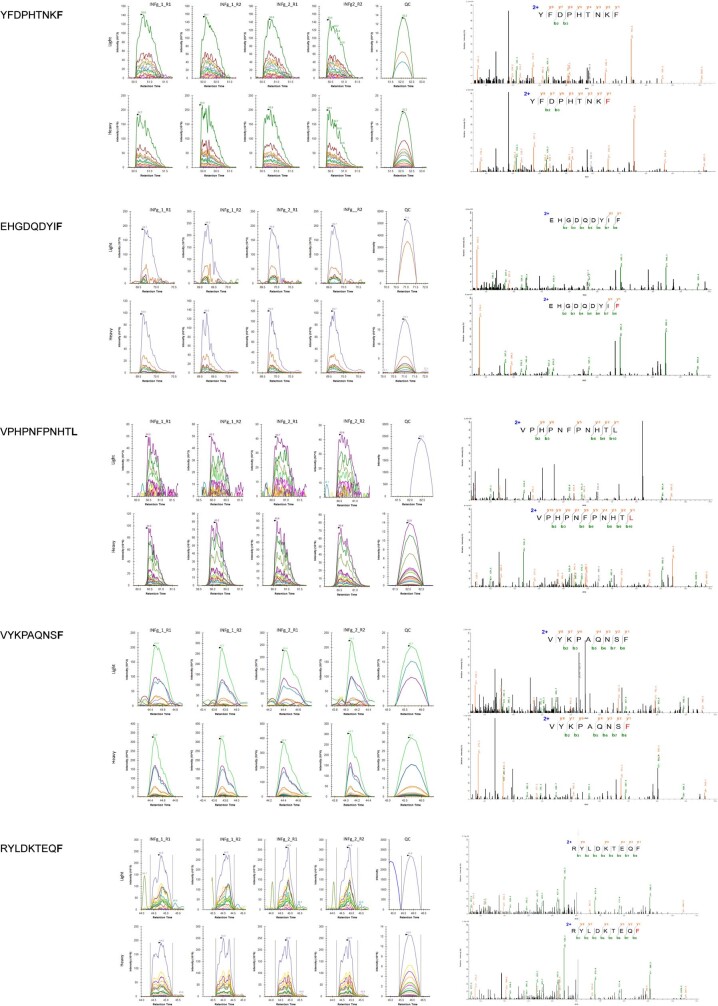
Activated T cells secrete interferon-γ, which triggers intracellular tryptophan shortage by upregulating the indoleamine 2,3-dioxygenase 1 (IDO1) enzyme1-4. Here we show that despite tryptophan depletion, in-frame protein synthesis continues across tryptophan codons. We identified tryptophan-to-phenylalanine codon reassignment (W>F) as the major event facilitating this process, and pinpointed tryptophanyl-tRNA synthetase (WARS1) as its source. We call these W>F peptides 'substitutants' to distinguish them from genetically encoded mutants. Using large-scale proteomics analyses, we demonstrate W>F substitutants to be highly abundant in multiple cancer types. W>F substitutants were enriched in tumours relative to matching adjacent normal tissues, and were associated with increased IDO1 expression, oncogenic signalling and the tumour-immune microenvironment. Functionally, W>F substitutants can impair protein activity, but also expand the landscape of antigens presented at the cell surface to activate T cell responses. Thus, substitutants are generated by an alternative decoding mechanism with potential effects on gene function and tumour immunoreactivity.


Conflict of interest statement

The authors declare no competing interests.

Figures

Fig. 1
Fig. 1. Reporter assays identify IFNγ-induced W>F codon reassignment.
a, A model depicting possible mechanisms that could allow mRNA translation to proceed in case of amino acid shortages. In addition to ribosomal frameshifting, in-frame translation in the absence of tryptophan could be facilitated by codon reassignment or translational bypass. b, MD55A3 melanoma cells expressing V5–ATF41–63–tGFP+1 were treated with or without IFNγ (48 h) (IFN) and then immunoprecipitated with anti-V5 and analysed by mass spectrometry. The heat map depicts log2 intensities of tryptic in-frame and tGFP peptides, as well as the peptides spanning the W93 codon. Each column represents an independent biological replicate. c, Heat map depicting log2 differences in intensities between mock- and IFNγ-treated conditions for codon reassignment events for each of the amino acids in the tryptic peptide spanning the W93 codon. This heat map is based on two biological replicates. d, Same as b, except cells were either mock-treated (Ctrl), or deprived of either tryptophan (−W), tyrosine (−Y) or phenylalanine (−F). e, tGFP median intensity of MD55A3 melanoma cells transduced with a vector expressing tGFP(F26W) and subjected to 48 h IFNγ, IDOi and tryptophan depletion (−W) as indicated. Each dot represents an independent biological replicate, the line shows the average and error bars represent ±s.d. ***P < 0.001 by ordinary one-way ANOVA using Bonferroni’s multiple comparison test. f, Activity assay of recombinant WARS1 incubated with various amino acids. The dots represent all independent biological replicates, the line depicts the average of the triplicate and bars show s.d. ***P < 0.001 by ordinary one-way ANOVA using Bonferroni’s multiple comparison test.
Fig. 2
Fig. 2. Detection of endogenous W>F substitutants.
a, Heat map depicting the number of tryptophan (W) codon reassignments detected specifically in mock-treated (Ctrl) MD55A3 V5–ATF41–63–tGFP+1-expressing cells, in IFNγ-treated (IFN) cells, or in both. Only the peptides detected in two biological replicates (n = 2) of every condition were selected. b, Box plot depicting log2 fold change in peptide intensities between control and IFNγ-treated condition for all peptides in the proteome (whiskers show range without outliers, boxes encompass first and third quartiles and the centre line indicates the median). The groups are either all peptides detected in the proteome (all), or peptides that span tryptophan codons and contain a tryptophan (W) or W>F, respectively. ***P < 0.001, Wilcoxon test (unpaired two-sample t-test). c, Same as a, but for mock-treated, tryptophan-depleted (−W) or tyrosine-depleted (−Y) MD55A3 V5–ATF41–63–tGFP+1-expressing cells (n = 2 biological replicates). d, Same as b, but for log2 fold change in peptide intensities between control and tryptophan-depleted conditions. e, Heat map depicting the number of the indicated codon reassignment events at tryptophan codons, specifically detected in the proteomes of IFNγ-treated or control glioblastoma RA cells (n = 2 biological replicates). f, Venn diagram depicting the overlap between the W>F peptides detected in IFNγ-treated (IFN induced) or tryptophan-depleted (−W induced) MD55A3 cells.
Fig. 3
Fig. 3. Detection of W>F substitutants in cancer proteomes.
a, Bar plot depicting cumulative number of tryptophan substitutants detected in the proteomes of LSCC tumour and adjacent normal tissue samples. b, Violin plots depicting the number of W>F and W>Y events detected in IDO1 low (intensity < 0) and high (intensity > 0) in LSCC and adjacent normal tissue. Wilcoxon unpaired two-sample t-test; ***P = 0.008892 for within-tumour comparison, P < 2.2 × 10−16 for normal–tumour comparison. c, Top, scatter contour plot depicting the number of W>F substitutants per gene when the gene is expressed at a higher (intensity > 0, x-axis) or lower (intensity < 0, y-axis) level than in surrounding normal tissue. W>F substitutants in tumours (in red) and normal adjacent normal tissues (in green). Bottom left, pie chart depicting gene ontologies enriched for genes that are expressed at higher level when the number of W>F substitutants is lower in tumour samples. Bottom right, pie chart depicting gene ontologies enriched for genes that are expressed at higher level when the number of W>F substitutants is higher in tumour samples. ER, endoplasmic reticulum. d, GSEA plot depicting the enrichment of T cell activation signature stratified against the difference in the number of substitutants in the W>F high class versus the W>F low class. P-values by GSEA statistical comparison of ranked distribution against random distribution. e, Same as c, but for intensities of phosphorylation levels in phosphoproteomics datasets of LSCC and adjacent normal tissues. f, Bar plots depicting enrichment of W>F (black) and W>Y (grey) substitutants over the average of all tryptophan substitutants (W>X) in multiple human tumour types. g, Row-scaled enrichment heat map for W>F, W>Y and W>X (average) substitutants for primary breast cancer samples xenografts in mouse. h, Bar plots depicting GSEA enrichment scores for T cell activation signature stratified against difference in the number of substitutants in W>F high class versus the W>F low class.
Fig. 4
Fig. 4. Substitutants are presented at the cell surface and activate T cells.
a, A model predicting the effect of IFNγ on the presentation and recognition of SIINFEKL and SIINwEKL by anti-H2-Kb-bound SIINFEKL antibodies. b, Dot plot depicting the APC median fluorescence intensity (MFI) of H2-Kb-bound SIINFEKL peptides in MD55A3 cells expressing H2-Kb (MD55A3 H2-Kb) in combination with the V5–ATF41–63–tGFP–SIINxxKL reporters. Each dot represents an independent biological replicate (n = 3). ***P < 0.001, ordinary one-way ANOVA using Sidak’s multiple comparison test. c, HT29 H2-Kb control and SIINwEKL-expressing cells were pre-treated with IFNγ, IDOi and tryptophan depletion as indicated and used in co-cultures with OT-I-derived T cells for 4 h. T cell activation was assessed by flow cytometry analysis of intracellular IFNγ positivity. Dots represent values obtained from independent experiments. Lines represent mean ± s.d. of three independent experiments. ***P < 0.001, ordinary one-way ANOVA using Sidak’s multiple comparison test. d, Tumour-killing efficacy of OT-I T cells in co-cultures with control HT29 H2-Kb or HT29-H2-Kb-SIINwEKL cells. Dots represent the mean relative cell number of the indicated co-cultures plus s.d. of three independent experiments. ***P < 0.001 by ordinary one-way ANOVA using Sidak’s multiple comparison test. e, Immunopeptidomics analysis of mock and IFNγ-treated RA glioblastoma cells. Heat map depicting the number of various substitutions detected in immunopeptidomics analysis of mock (Ctrl) or IFNγ-treated RA glioblastoma cells. Only the peptides identified in two biological replicates were counted. f, Flow cytometric analysis of CD8+ T cells following co-culture of naive CD8+ T cells and autologous monocyte-derived dendritic cells pulsed with peptide or DMSO vehicle. Plots show T cells reactive to streptavidin–PE and streptavidin–PE-CF594-labelled pMHC multimers complexed with the KLHL4 substitutant peptide YFDPHTNKF (well 1). g, A model depicting the induction of W>F substitutants following tryptophan depletion associated to IFNγ treatment and T cell activation.
Extended Data Fig. 1
Extended Data Fig. 1. Reporter assays identify IFNγ-induced W>F codon reassignment.
(a) A scheme of the reporter V5-ATF4(1-63)-tGFP constructs used in this study. The tGFP gene was placed either in-frame or +1 nucleotide (nt) out-of-frame after the tryptophan codon at position 93 (W93). # and $ mark tGFP-containing and truncated protein products, respectively. (b) Dot plot depicting relative tryptophan levels of MD55A3-V5-ATF4(1-63)-tGFP+1 cells treated with IFNγ (250U/mL) for 48 h. (c) MD55A3 melanoma cells expressing V5-ATF4(1-63)-tGFP and V5-ATF4(1-63)-tGFP+1 were subjected to IFNγ treatment. Whole cell extracts were subjected to immunoblotting analyses using anti-V5, anti-tGFP, anti-Tubulin and anti-IDO1 antibodies. M: marker lane. Red arrows mark in-frame (#) and out-of-frame ($) products, as depicted in panel a. (n = 2 independent experiments). (d) Amino acid levels for tryptophan (W), tyrosine (Y), and phenylalanine (F) of the MD55A3-V5-ATF4(1-63)-tGFP+1 cells depleted of the indicated amino acids, as in Fig. 1d. Each bar represents the average of 3 independent experiments +/- stdev. (e) MD55A3 cells expressing V5-ATF4(1-63)-tGFP and V5-ATF4(1-63)-tGFP+1 were depleted for tryptophan for 48 h and then treated or not with the proteasome inhibitor MG132 (10μM) as indicated in the scheme in panel b. Whole cell extracts were subjected to immunoblotting analyses using anti-V5, anti-tGFP, and anti-Tubulin antibodies. Red arrows mark in-frame (#) and out-of-frame ($) products. (n = 2 independent experiments). (f) Line plots depicting the peptides detected following V5-IP/MS of lysates of MD55A3-V5-ATF4(1-63)-tGFP+1 cells from mock or IFNγ-treated conditions. The dashed line represents the site of the tryptophan 93 codon (W93) and the x-axis represents the in-frame part of the reporter protein before and after the tryptophan codon. (g) Dot-plot depicting log2 fold changes between mock and IFNγ-treated MD55A3-V5-ATF4(1-63)-tGFP+1 cells for the tryptic peptide intensities presented. Each dot represents the intensity of a unique peptide. Lines represent the average intensities of all peptides +/-stdev. (h) The same analysis as performed in panel f, but for mock and tryptophan-depleted MD55A3-V5-ATF4(1-63)-tGFP+1 cells. (i) The same analysis as performed in panel g, but for mock and tryptophan-depleted MD55A3-V5-ATF4(1-63)-tGFP+1 cells. (j) Heatmap depicting a log2 fold change between mock and tryptophan-depleted MD55A3-V5-ATF4(1-63)-tGFP+1 cells for amino acid substitution events for each of the amino acids in the tryptic peptide spanning the W93 codon. (k) Dot-plots depicting peptide intensity values in either mock (Ctrl) or amino acid depleted MD55A3-V5-ATF4(1-63)-tGFP+1 cells for the specific codon reassignments detected in the various depleted conditions, as indicated. Each dot represents an independent biological replicate and the line represents the average of the 3 replicates +/- standard deviation (stdev). (l-o) tGFP median intensity of reporter vectors encoding for tGFP, tGFPF26W, or tGFPF26A stably introduced into the indicated cell lines and conditions. Marked in dotted line is the highest value of the highest point in the background. Each dot represents a biological replicate and the line represents the average of the triplicates +/- stdev.
Extended Data Fig. 2
Extended Data Fig. 2. Detection of endogenous W>F substitutants.
(a) A heatmap depicting log2 peptide intensities for W>F substitution events in the proteome, selected to be reproducible across two biological replicates (1 column represents 1 replicate) in control (Ctrl) or IFNγ-treated (IFN) MD55A3-V5-ATF4(1-63)-tGFP+1 cells. Marked with an arrow is the peptide spanning the tryptophan at position 93 (W93) from the V5-ATF4(1-63)-tGFP+1 reporter. W>F substitutants are marked with a lower case “f”. (b-e) Heatmaps depicting substitutant peptide intensities detected specifically in mock (Ctrl) and IFNγ-treated (IFN) conditions; W>Y (b), W>C (c), W>Q (d) and W>H (e). (f) Scatter plot depicting protein expression calculated as log2 protein intensity from MS analysis in mock-treated (x-axis) and IFNγ-treated (y-axis) MD55A3-V5-ATF4(1-63)-tGFP+1 cells for all (grey) or substitutant (red) peptides. (g) Same analysis as in panel a, but for tryptophan (-W) and tyrosine (-Y) depletion. (h-j) Same analysis as presented in panels b-e, but for mock (Ctrl), tryptophan depletion (-W), and tyrosine depletion (-Y) conditions, for W>H (h), W>C (i) or W>A (j) comparisons. (k-l) Heatmaps depicting log 2 peptide intensities for W>F substitution events in the proteomes of glioblastoma cell lines HR0G2(k) and RA (l). (m) Heatmap depicting the number of substitutions peptides, as indicated, specifically detected in the proteomes of IFNγ−treated or control glioblastoma HROG02 cells. (n) A Venn diagram (same as Fig. 2f) depicting the overlap between the substitutant peptides specifically detected in IFNγ-treated or tryptophan-depleted MD55A3-V5-ATF4(1-63)-tGFP+1 cells with the names of the overlapping proteins indicated.
Extended Data Fig. 3
Extended Data Fig. 3. Detection of W>F substitutants in multiple tumour types.
Density plots depicting number of samples where the expression of W>F (red) and all other W>’X’ (black) substitutant peptides were detected in multiple tumour types. Vertical lines depict the specificity thresholds used for the selection of substitutants.
Extended Data Fig. 4
Extended Data Fig. 4. Detection of W>F substitutants in cancer proteomes.
(a) Analysis of LSCC tumour proteomes: A scatter contour plot depicting for every gene the number of W>Y peptides when the gene is higher expressed (intensity > 0) on X-axis (High Class) and when the gene is lower expressed (intensity < 0) on Y-axis (Low Class). Contours depict the density of the distribution. W>Y peptides in tumours and normal adjacent normal tissues are depicted in red and green, respectively. Inset: (HIGH) Pie chart depicting representative gene ontologies for genes that are higher expressed when the number of W>Y peptides is high in tumour samples. (LOW) Same as HIGH, but enriched for genes that are higher expressed with W>Y peptides is low. (b) Same as in panel a but for PDA tumour proteomes and for W>F peptides. (c) Gene Set Enrichment Analysis (GSEA) plot depicting the enrichment of T cell activation signature stratified against the difference in the number of substitutants in W>F High Class versus the W>F Low Class for PDA tumour and tumour-adjacent normal tissue dataset. P-values are calculated by GSEA statistical comparison of ranked distribution against random distribution. (d) Same as panel b but for UCEC tumour proteomes. (e) Same as panel c but for UCEC tumour proteomes. (f) Same as panel b but for Liver (HCC) Cancer. (g) Same as panel b but for Head and Neck (HNSCC) Cancer. (h) Same as panel a but for Breast Cancer (BC) tumours only. (i) Same as panel a but for Glioblastoma (GBM) tumours only. (j) Same as panel a but for Ovarian (OV) cancer.
Extended Data Fig. 5
Extended Data Fig. 5. Presentation of substitutants at the cell surface.
(a) The binding affinity of SIINFEKL and SIINwKEL peptides to H2-Kb receptor was assessed by NetMHC 4.0. (b) A scheme of the reporter vectors used to assess the production, presentation and T cell activation by SIINFEKL and SIINwEKL. (c) Immunoblot analyses using anti-V5, anti-tGFP and anti-HSP90 antibodies demonstrate similar expression of the various tGFP-SIINxxKL reporters used in this study. Results are representative of 2 independent experiments. (d) MD55A3-V5-ATF4(1-63)-tGFP+1 cells were either treated with mock (Ctrl), IFNγ (IFN), or IFNγ with recombinant kynureninase (IFN+Kynase) for 48 h. Kynurenine levels in the medium were analysed by MS. Dots represent measurements relative to control from independent experiments, with the line indicating the mean of all samples. (e) MD55A3-H2-Kb control, SIINFEKL or SIINwEKL expressing cells, were pre-treated for 48 h with IFNγ (250U/mL) and IDOi (300 μM) as indicated, and used in co-cultures with OT-I-derived T cells for 12 h. T cell activation was assessed by flow cytometry analysis of intracellular IFNγ positivity. Dots represent values obtained from independent experiments. The lines represent the average of three independent experiments +/- stdev. *** P<0.001 by ordinary one-way ANOVA using Sidak’s multiple comparison test. (f) A dot plot depicting the APC median fluorescence intensity (MFI) of H2-Kb-bound SIINFEKL peptides in HT29 cells expressing H2-Kb (HT29-H2-Kb) or in combination with the V5-ATF4(1-63)-tGFP-SIINwEKL reporter. Each dot represents an independent biological replicate (n = 3). *** P<0.001 by ordinary one-way ANOVA using Sidak’s multiple comparison test. (g) Dot plot representing the percentage of TNFα positive OT-I T cells after 4 h of co-culture with HT29-H2-Kb or H2-Kb-SIINwEKL expressing cells pre-treated 48 h IFNγ (IFN, 250U/mL), with or without IDOi (300 μM) and W-depletion, as determined by flow cytometry. Dots represent values obtained from independent experiments. The lines represent the average of three independent experiments +/- stdev. (h) A heatmap depicting log2 peptide intensities in either control or IFN-treated patient-derived colorectal cancer organoid models for W>F, W>Y, W>N and W>A substitutant peptides.
Extended Data Fig. 6
Extended Data Fig. 6. Validation of five substitutants epitopes identified in RA cells.
The identification of five substitutant peptides was validated with targeted mass spectrometry. The co-elution profiles of the transitions of spiked-in synthetic heavy-labelled peptides and endogenous eluted HLA bound peptides are shown in two biological replicates of RA cells treated with IFNγ (each in two technical replicates R1 and R2). The quality control (QC) analysis of the pool of synthetic peptides is provide for comparison. The MS/MS fragmentation pattern further confirms the presence of the endogenous peptide (Δm = 10 Da for F and Δm = 7 Da for L). Labelled amino acids are shown in bold.
Extended Data Fig. 7
Extended Data Fig. 7. T cell reactivity against two substitutant peptides.
Flow cytometric analysis of CD8+ T cells following co-culture of naive CD8+ T cells and autologous monocyte-derived dendritic cells pulsed with peptide or DMSO vehicle. Plots show T cells reactive to SA-phycoerythrin (PE) and SA-phycoerythrin-CF594 (PE-CF594)-labelled pMHC multimers complexed with the KLH4L substitutant peptide YFDPHTNKF (Wells #1 and 3), or reactive to SA-PE and SA-allophycocyanin (SA-APC)-labelled pMHC multimers complexed with the BI1 (TMBIM6) substitutant peptide EHGDQDYIF (Well #2).

Comment in

References

    1. Ayers M, et al. IFN-γ-related mRNA profile predicts clinical response to PD-1 blockade. J. Clin. Invest. 2017;127:2930–2940. - PMC - PubMed
    1. Zhai L, et al. Molecular pathways: targeting IDO1 and other tryptophan dioxygenases for cancer immunotherapy. Clin. Cancer Res. 2015;21:5427–5433. - PMC - PubMed
    1. Amobi A, Qian F, Lugade AA, Odunsi K. Tryptophan catabolism and cancer immunotherapy targeting IDO mediated immune suppression. Adv. Exp. Med. Biol. 2017;1036:129–144. - PubMed
    1. Labadie BW, Bao R, Luke JJ. Reimagining IDO pathway inhibition in cancer immunotherapy via downstream focus on the tryptophan–kynurenine–aryl hydrocarbon axis. Clin. Cancer. Res. 2019;25:1462–1471. - PMC - PubMed
    1. Gocher AM, Workman CJ, Vignali DAA. Interferon-γ: teammate or opponent in the tumour microenvironment? Nat. Rev. Immunol. 2021 doi: 10.1038/s41577-021-00566-3. - DOI - PMC - PubMed

MeSH terms

LinkOut - more resources