. 2022 Jan 31;12(5):1971-1987.
doi: 10.7150/thno.68864. eCollection 2022.

Macitentan improves antitumor immune responses by inhibiting the secretion of tumor-derived extracellular vesicle PD-L1

Affiliations

Macitentan improves antitumor immune responses by inhibiting the secretion of tumor-derived extracellular vesicle PD-L1

Chan-Hyeong Lee et al. Theranostics. .

Abstract

Extracellular vesicles (EVs) carrying tumor cell-derived programmed death-ligand 1 (PD-L1) interact with programmed death 1 (PD-1)-producing T cells, thus significantly lowering a patient's response to immune checkpoint blockade drugs. No drug that reinvigorates CD8+ T cells by suppressing EV PD-L1 has been approved for clinical usage. Here we have identified macitentan (MAC), an FDA-approved oral drug, as a robust booster of antitumor responses in CD8+ T cells by suppressing tumor cell-derived EV PD-L1. Methods: EV was analyzed by the data from nanoparticle tracking, immunoblotting analyses, and nano-flow cytometry. Antitumor immunity was evaluated by luciferase assay and immune phenotyping using flow cytometry. Clinical relevance was analyzed using the cancer genome atlas database. Results: MAC inhibited secretion of tumor-derived EV PD-L1 by targeting the endothelin receptor A (ETA) in breast cancer cells and xenograft models. MAC enhanced CD8+ T cell-mediated tumor killing by decreasing the binding of PD-1 to the EV PD-L1 and thus synergizing the effects of the anti-PD-L1 antibody. MAC also showed an anticancer effect in triple-negative breast cancer (TNBC)-bearing immunocompetent mice but not in nude mice. The combination therapy of MAC and anti-PD-L1 antibody significantly improved antitumor efficacy by increasing CD8+ T cell number and activity with decreasing Treg number in the tumors and draining lymph nodes in TNBC, colon, and lung syngeneic tumor models. The antitumor effect of MAC was reversed by injecting exogenous EV PD-L1. Notably, ETA level was strongly associated with the innate anti-PD-1 resistance gene signature and the low response to the PD-1/PD-L1 blockade. Conclusion: These findings strongly demonstrate that MAC, already approved for clinical applications, can be used to improve and/or overcome the inadequate response to PD-1/PD-L1 blockade therapy.

Keywords: Cancer; Exosome; Extracellular vesicle; PD-L1; immunotherapy.


Conflict of interest statement

Competing Interests: The authors have declared that no competing interest exists.

Figures

Figure 1
Figure 1
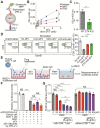
MAC suppresses EV PD-L1 by targeting ETA in vitro and in vivo. (A) The immunoblots of PD-L1 and ETA in the indicated cancer cell lines. (B) A transmission electron microscopy (TEM) image of MDA-MB231-derived EVs immunogold-labeled with anti-PD-L1 antibodies. Arrowheads indicate 5 nm gold particles. Scale bar, 50 nm. (C) The number of EVs derived from MDA-MB231 cells and (D) 4T1 cells with or without MAC treatment by nanoparticle tracking analysis (NTA). (E) The amounts of protein in the EVs derived from MDA-MB231 and 4T1 cells in the absence or presence of MAC. (F) The immunoblot of various proteins in EV and whole-cell lysates from MDA-MB231 and 4T1 cells with or without MAC (n = 3). EV proteins from 1 × 10⁷ cells were loaded per lane. (G) The immunoblot of PD-L1 and CD63 in the EVs from MDA-MB231 and 4T1 cells treated with or without MAC at the indicated concentration (top). The densitometric analysis of the relative intensity of the protein bands (bottom) (n = 3). (H) The number of and (I) amount of protein in the EVs derived from the wild-type (WT) and ETA K/D MDA-MB231 cells. (J) The immunoblot of various proteins in EV and whole-cell lysates from the WT or ETA K/D MDA-MB231 (n = 3). Beta-actin was used as the loading control. EV proteins from 1 × 10⁷ cells were loaded per lane. (K) The immunoblot of PD-L1 and CD63 in the EVs from WT or ETA K/D MDA-MB231 cells (top) (n = 3). The densitometric analysis of the relative intensity of the protein bands (bottom). An equal amount of protein (5 µg) of the EVs was loaded per lane. (L) The experimental designs using the MDA-MB231 xenograft models. (M) Densitometric analysis of the immunoblot of PD-L1 in circulating EVs and tumor lysates from MDA-MB231 xenograft mice treated with or without MAC (left, n = 5 and 7, respectively) and (N) in WT or ETA K/D MDA-MB231 xenograft mice (left, n = 5 and 6, respectively), related to figure S2A and B. (O) The level (%) of surface PD-L1 of the EV derived from the plasma of the MDA-MB231 xenograft model with or without MAC (n = 7) and (P) in WT or ETA K/D MDA-MB231 xenograft mice (n = 6). The data are presented as means ± SD. *p < 0.05, ** p < 0.01, ***p < 0.001, and **** p < 0.0001, respectively; NS, not significant.
Figure 2
Figure 2
MAC boosts T cell-mediated cytotoxic activity by suppressing EV PD-L1. (A) The scheme of the PD-1 binding assay. (B) The measurement of PD-1 binding with EV PD-L1 derived from MDA-MB231 cells treated with (50 µM) MAC or (50 ng/ml) IFN-γ. (C) The measurement of PD-1 binding with EV PD-L1 derived from WT or ETA K/D MDA-MB231 cells. (D) The human CD8+ T cells with the indicated treatments were examined for the GzmB level by flow cytometry (left), showing the proportions of the GzmB-positive cells (right). (E) The experimental designs of the coculture system to test the CD8+ T cell activity. (F) The human CD8+ T cell-mediated cytotoxicity in the MDA-MB231-luciferase cells after the indicated treatments. (G) Luciferase activity of the MDA-MB231-luciferase cells with or without human CD8+ T cells after the indicated treatments. The data are presented as means ± SD (n = 3). *p < 0.05, **p < 0.01, ***p < 0.001, and ****p < 0.0001, respectively; NS, not significant.
Figure 3
Figure 3
MAC augments the efficacy of the anti-PD-L1 antibody therapy in multiple syngeneic cancer models. (A) The experimental designs of the syngeneic cancer models. (B-E) The growth curves of (B) 4T1 and (C) EMT6 breast cancer, (D) CT26 colon cancer, and (E) LL/2 lung cancer tumors in immunocompetent mice (left, n = 7-10) and nude mice (top right, n = 8-10) and the survival rate (bottom right) of the mice treated with the vehicle or MAC and isotype IgG or anti-PD-L1 antibody. The vertical dotted lines indicate the beginning of MAC administration (at tumor volume = 50-100 mm3). The blue arrows represent the timing of anti-PD-L1 antibody administrations. (F) The growth curves of WT and 4T1 ETA K/D or (G) CT26 ETA K/D tumors in immunocompetent mice (left, n = 7-9) and nude mice (top right, n = 9) and the survival rate of each group (bottom right). The dotted line indicates the beginning of the anti-PD-L1 antibody treatment (at tumor volume = 50-100 mm3). The survival rates were analyzed using the Mantel-Cox test. The data are presented as means ± SEM. *p < 0.05, **p < 0.01, ***p < 0.001, and ****p < 0.0001, respectively; NS, not significant; Mann-Whitney U test.
Figure 4
Figure 4
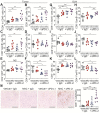
The combination therapy of MAC and anti-PD-L1 antibody increases immune response in EMT6 tumor model. (A-M) Flow cytometry analysis of the T lymphocyte in tumors and DLN (n = 6). The proportions of CD8+ cells in the (A) CD45+ cells, (B) ki67+ cells, and (C) GzmB+ cells in the tumor. The proportions of CD4+ cells in the (D) CD45+ cells, (E) ki67+ cells, and (F) FoxP3+ cells in the tumor. The proportions of CD8+ cells in the (G) CD45+ cells, (H) GzmB+ cells, (I) PD-1+ cells, and (J) Tim3+ cells in the DLN. The proportions of CD4+ cells in the (K) CD45+ cells and (L) FoxP3+ cells in the DLN. (M) IHC Images of anti-CD8+ T cells in tumors (left, n = 7) and the percentages of CD8+ T cells (right). Scale bar, 100 µm. The data are presented as means ± SEM. *p < 0.05, **p < 0.01, and ***p < 0.001, respectively; NS, not significant; Mann-Whitney U test.
Figure 5
Figure 5
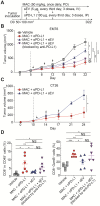
Exogenous addition of EV PD-L1 reverses antitumor immunity induced by MAC and an anti-PD-L1 antibody. (A) The design of the tumor regrowth experiment with EV PD-L1 injections in syngeneic cancer models. The growth curves of EMT6 (B) and CT26 (C) tumors in immunocompetent mice subjected to the indicated treatments. The vertical dotted lines indicate the beginning of MAC administration (at tumor volume = 50-100 mm3). (D) Flow cytometry analysis of the T lymphocytes from the EMT6 tumor-bearing mice with the indicated treatments, showing the proportion of CD8+ cells in CD45+ cells (left) and in the GzmB+ cells (right) in the tumor. The data are presented as means ± SEM (n = 6). *p < 0.05, **p < 0.01, ***p < 0.001, and ****p < 0.0001, respectively; NS, not significant; Mann-Whitney U test.
Figure 6
Figure 6
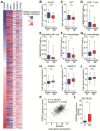
EDNRA expression is associated with immune response and EV secretion in breast cancer patients. (A) Heatmap of immune and EV-related gene expression according to EDNRA gene expression in the 1082 breast cancer patients from the TCGA database. The gene expression levels of (B) GzmB and (C) PRF1 according to EDNRA gene expression are shown. The correlation between the infiltration of (D) CD8+ T cells, (E) activated natural killer (NK) cells, (F) M1 macrophages, and (G) M2 macrophages was analyzed using CIBERSORT. The gene expression of (H) RAB5A, (I) RAB27A, and (J) VPS4B related to the EDNRA gene expression. (K) The correlation analysis between EDNRA expression and the IPRES gene signature. (L) The difference in EDNRA expression between the responders (n = 15) and non-responders (n = 13) to anti-PD-1 therapy from the Gene Expression Omnibus (GEO) database (GSE78220) of melanoma patient set. *p < 0.05, **p < 0.01, and ****p < 0.0001, respectively; Mann-Whitney U test.
Figure 7
Figure 7
Proposed model for MAC-mediated-enhanced cancer immunotherapy. MAC increases the efficacy of the anti-PD-L1 antibody therapy and activates T cells by inhibiting EV PD-L1. ❶ First, MAC suppresses the release of EV PD-L1 from tumor cells by targeting ETA. ❷ The MAC-mediated suppression of EVs leads to reduced interaction of the remaining EVs with the PD-1 on CD8+ T cells or ❷′ with anti-PD-L1 antibodies. ❸′ Consequently, anti-PD-L1 antibodies, spared from binding to EV PD-L1, can bind to PD-L1 on the tumor cells, ❸ resulting in activation of CD8+ T cells. ❹ Ultimately, the MAC-mediated reinvigoration of exhausted CD8+T cells can cause tumor cell death and improve the overall anti-PD-L1 related ICB. MVE stands for multivesicular endosomes.

References

    1. Yin Z, Yu M, Ma T, Zhang C, Huang S, Karimzadeh MR, Mechanisms underlying low-clinical responses to PD-1/PD-L1 blocking antibodies in immunotherapy of cancer: a key role of exosomal PD-L1. J Immunother Cancer. 2021. 9. - PMC - PubMed
    1. Mandal R, Samstein RM, Lee KW, Havel JJ, Wang H, Krishna C. et al. Genetic diversity of tumors with mismatch repair deficiency influences anti-PD-1 immunotherapy response. Science. 2019;364:485–91. - PMC - PubMed
    1. Ren D, Hua Y, Yu B, Ye X, He Z, Li C. et al. Predictive biomarkers and mechanisms underlying resistance to PD1/PD-L1 blockade cancer immunotherapy. Mol Cancer. 2020;19:19. - PMC - PubMed
    1. Chen G, Huang AC, Zhang W, Zhang G, Wu M, Xu W. et al. Exosomal PD-L1 contributes to immunosuppression and is associated with anti-PD-1 response. Nature. 2018;560:382–6. - PMC - PubMed
    1. Xu Z, Zeng S, Gong Z, Yan Y. Exosome-based immunotherapy: a promising approach for cancer treatment. Mol Cancer. 2020;19:160. - PMC - PubMed

Publication types