. 2022 Feb 14;12(5):2205-2231.
doi: 10.7150/thno.70756. eCollection 2022.

Non-invasive photobiomodulation treatment in an Alzheimer Disease-like transgenic rat model

Affiliations

Non-invasive photobiomodulation treatment in an Alzheimer Disease-like transgenic rat model

Luodan Yang et al. Theranostics. .

Abstract

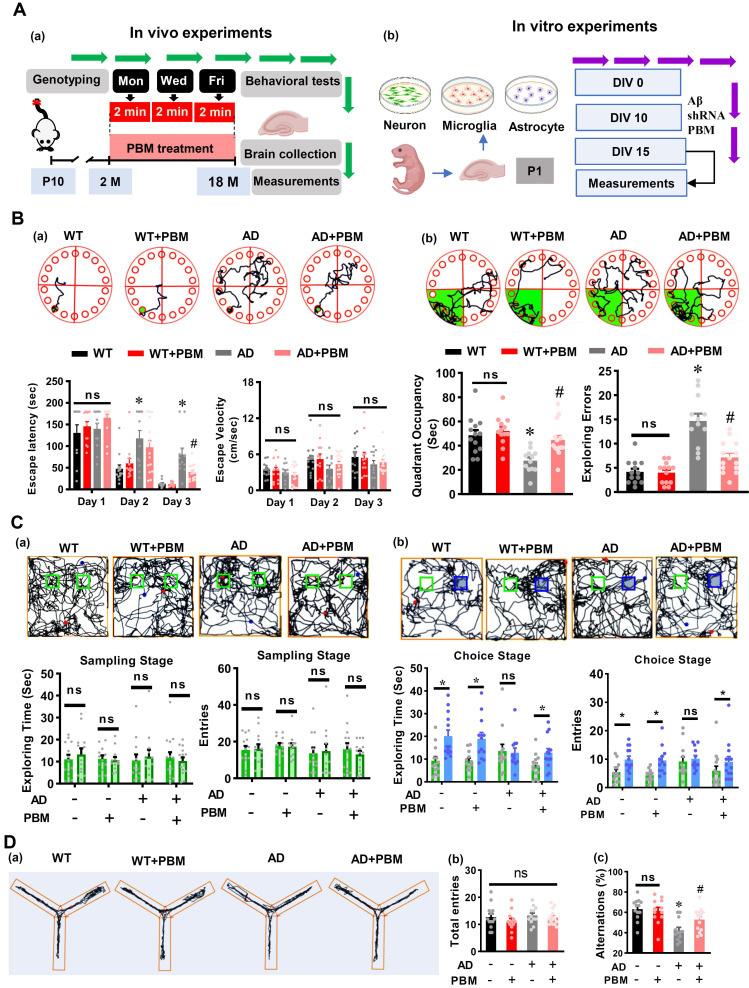
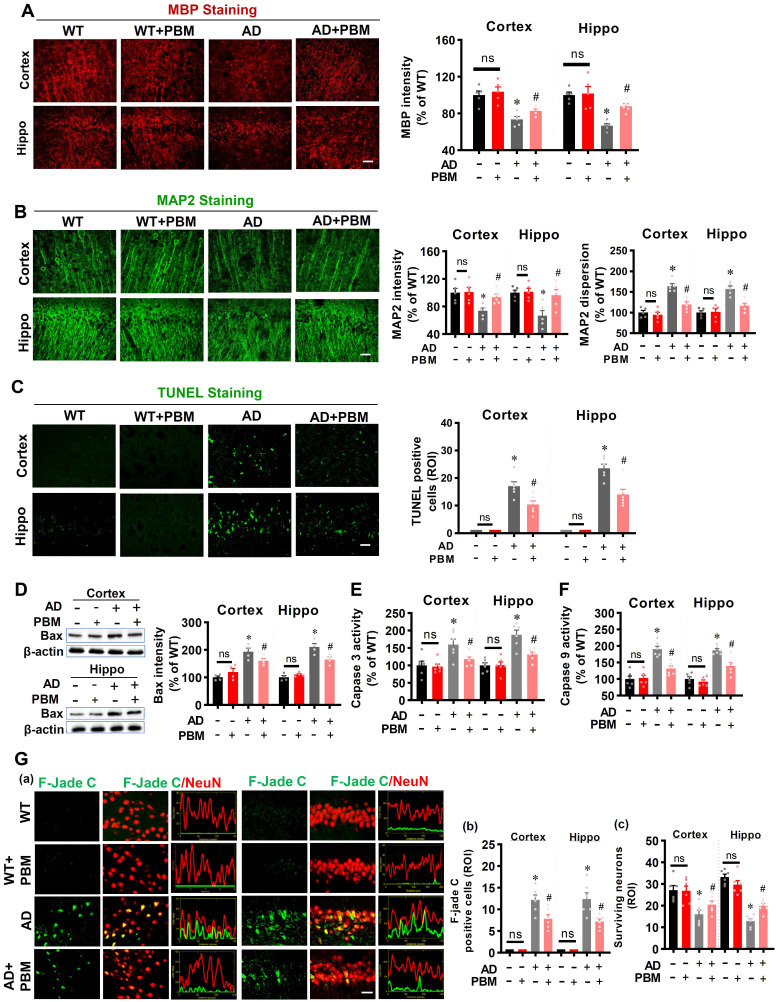
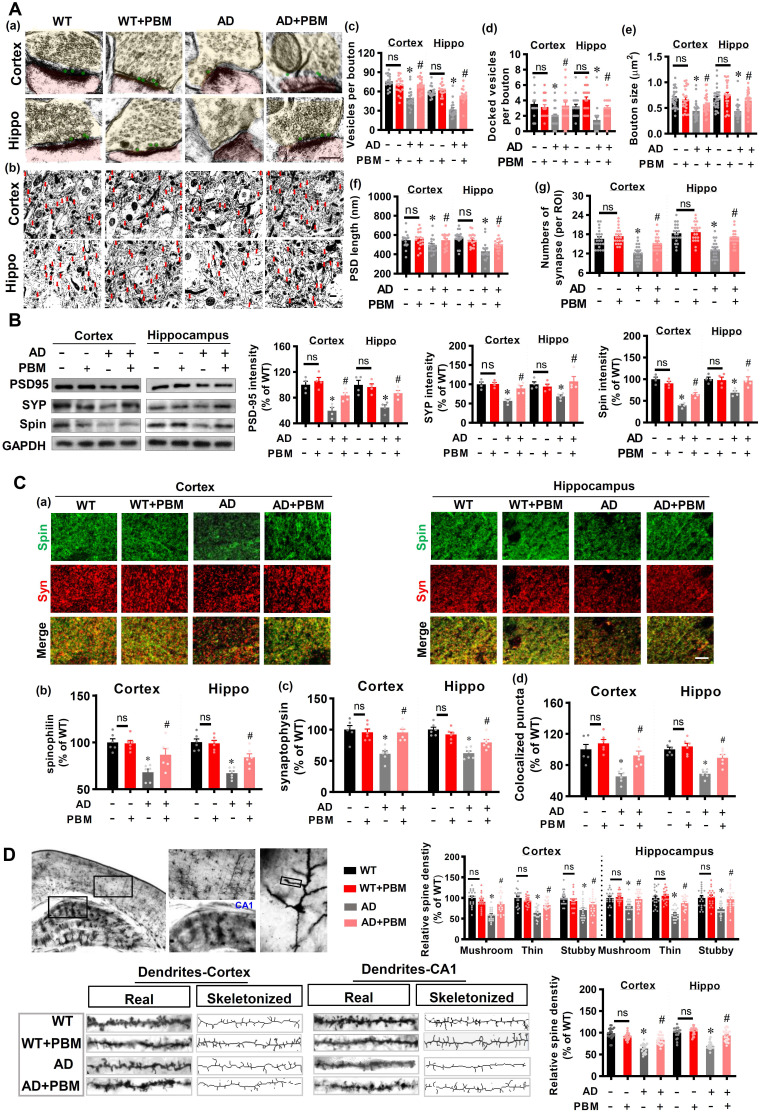
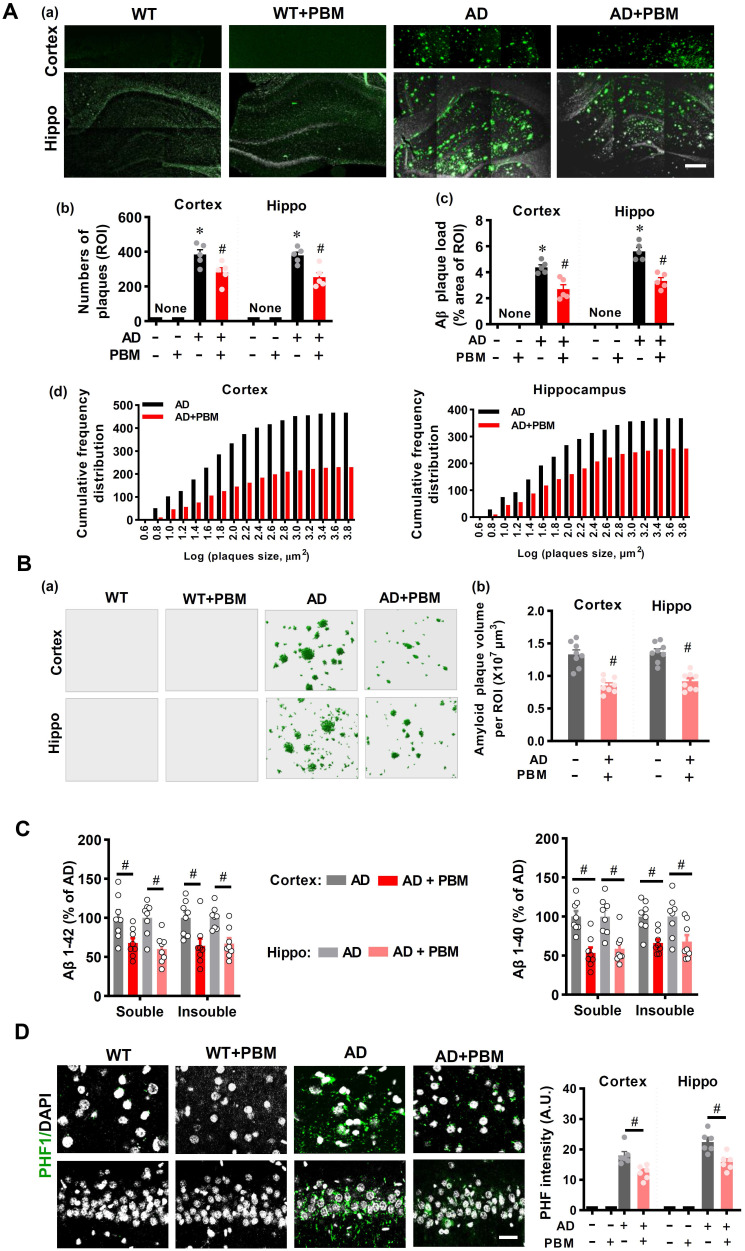
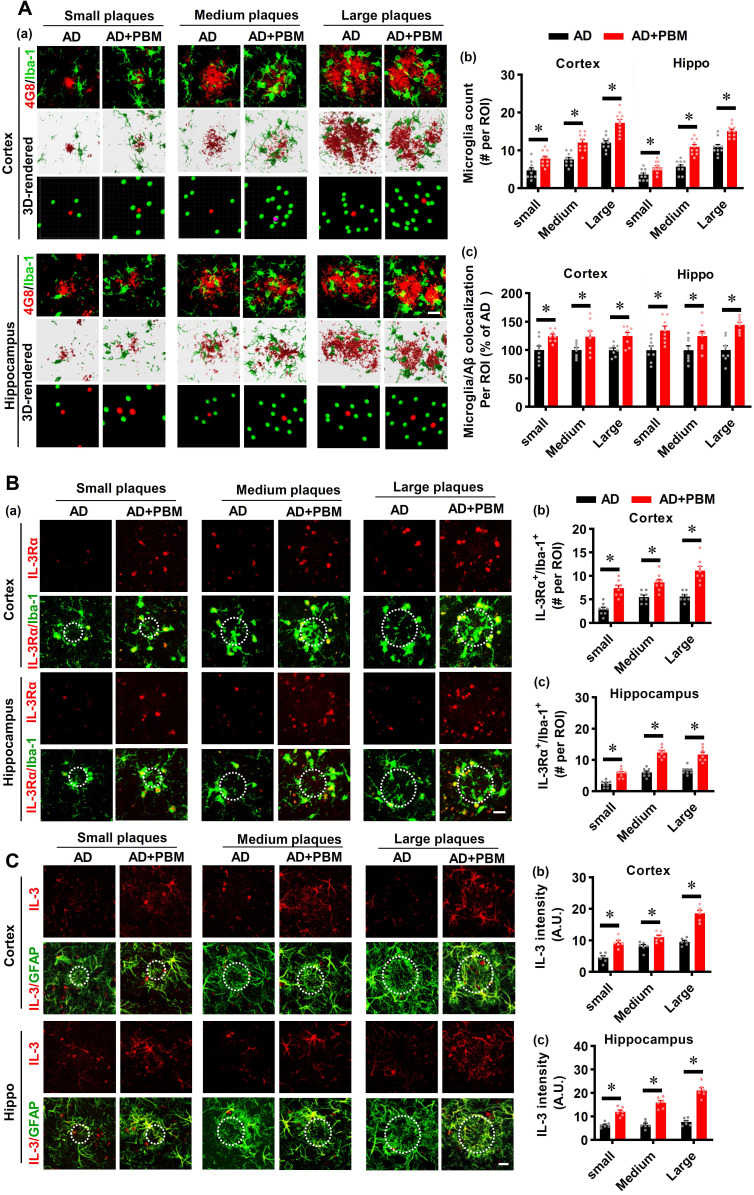
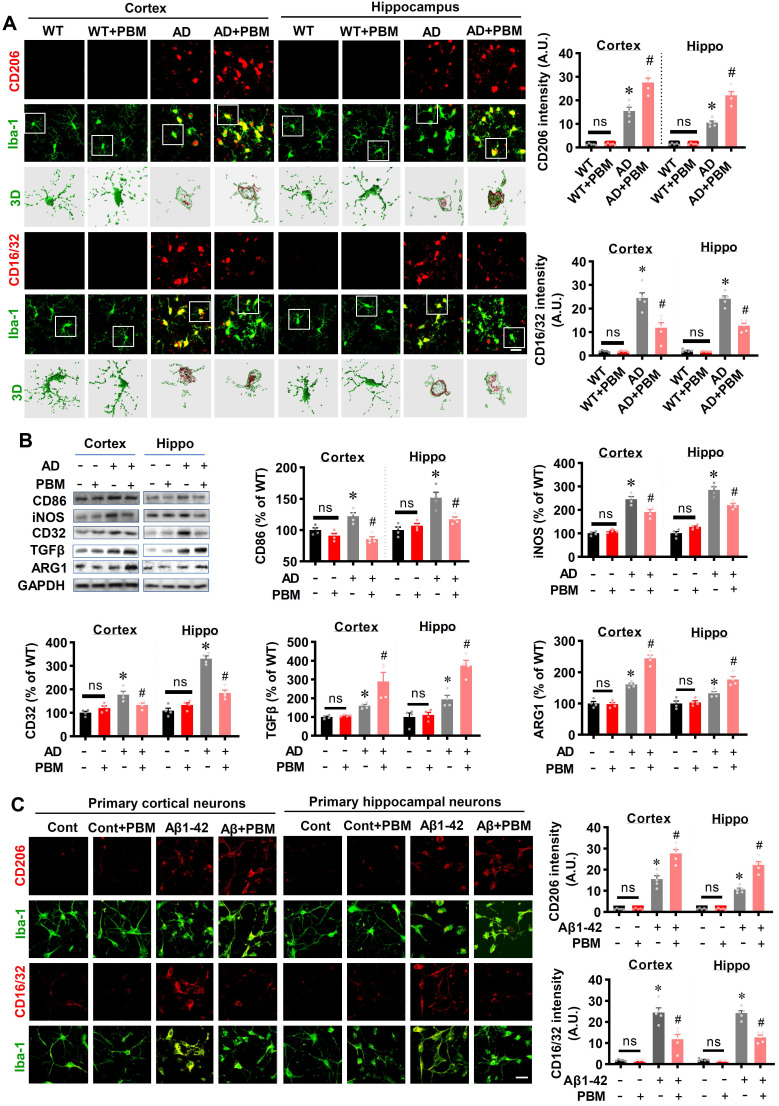
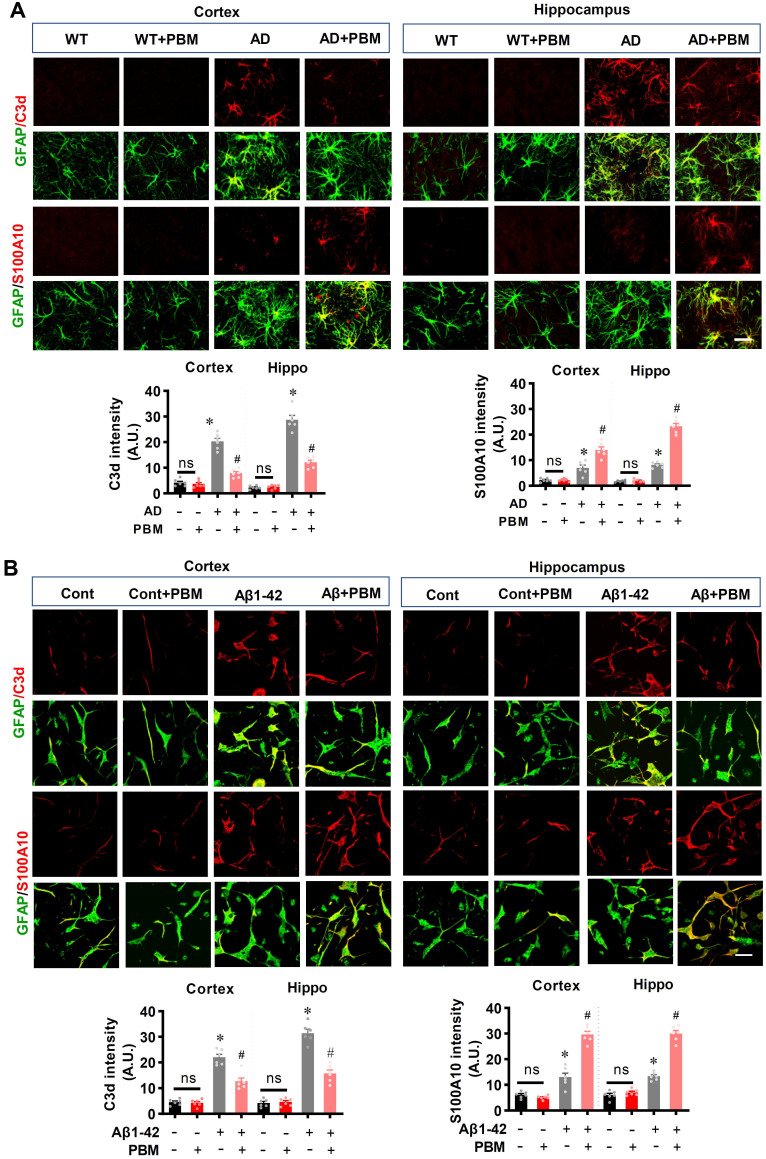
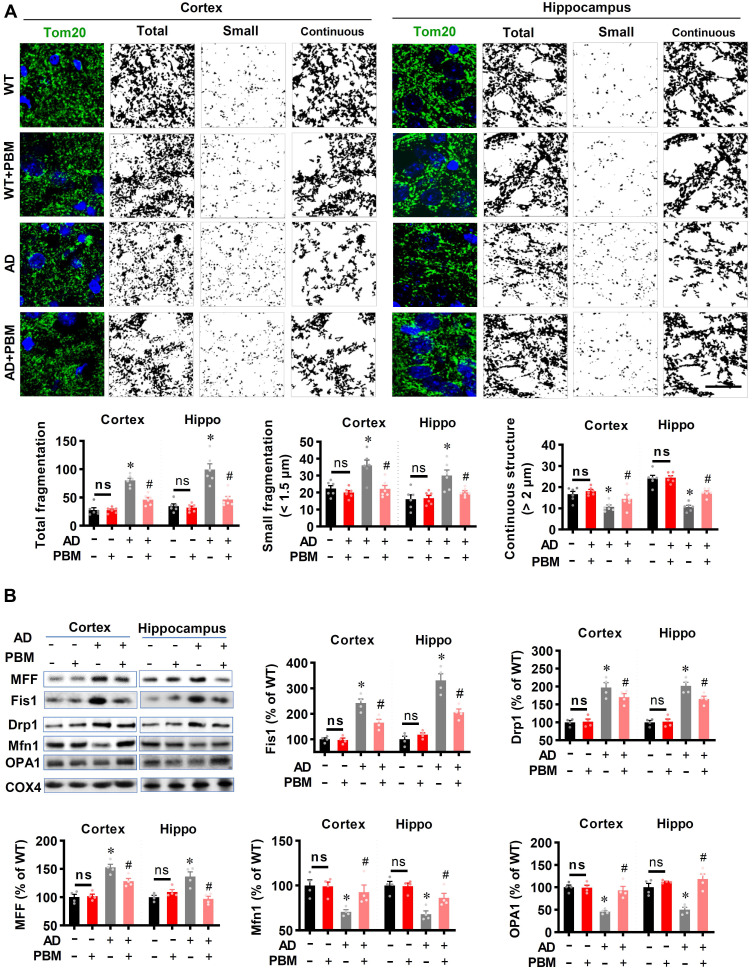
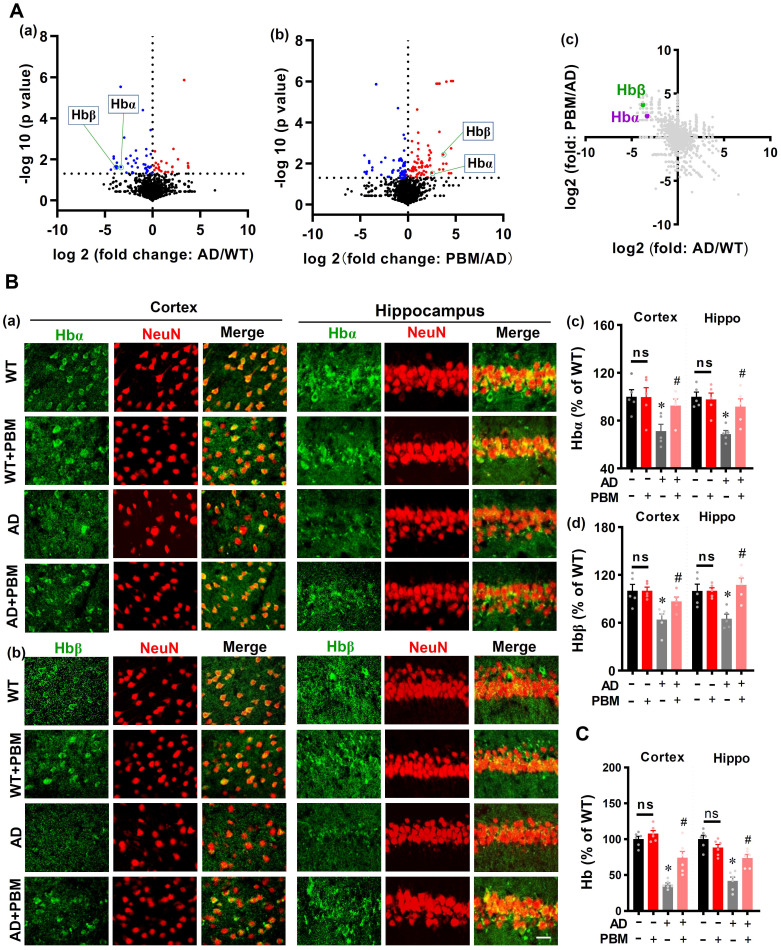
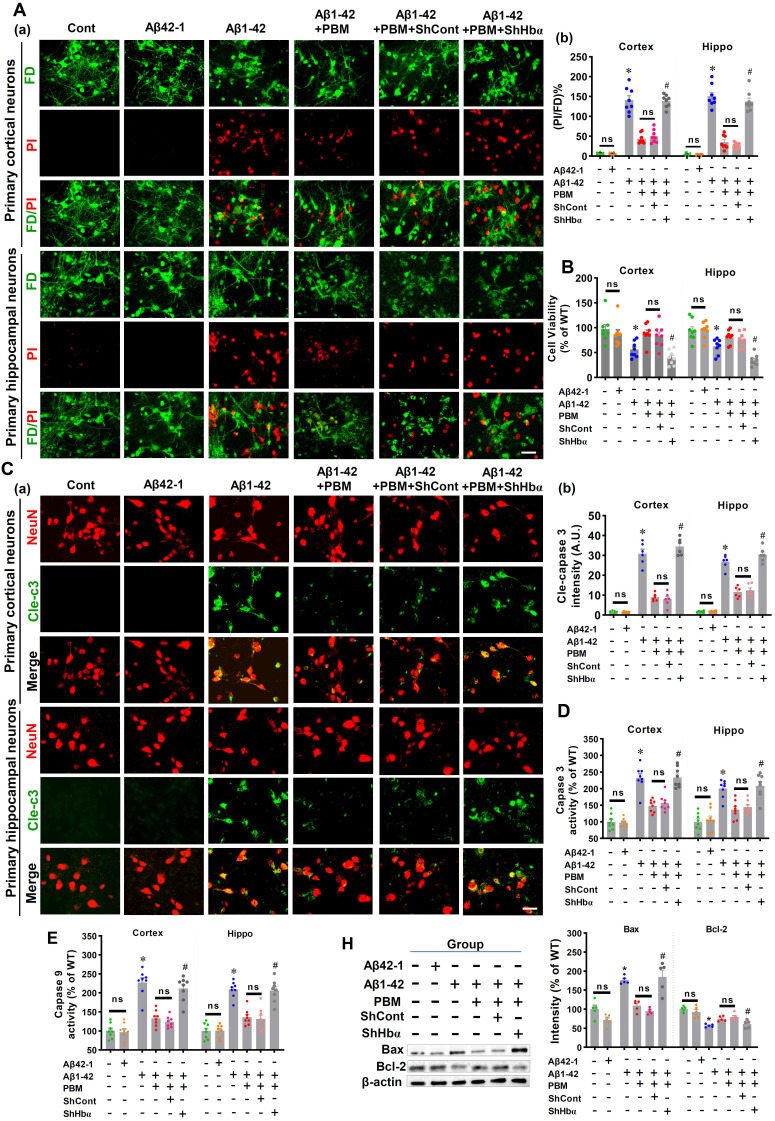
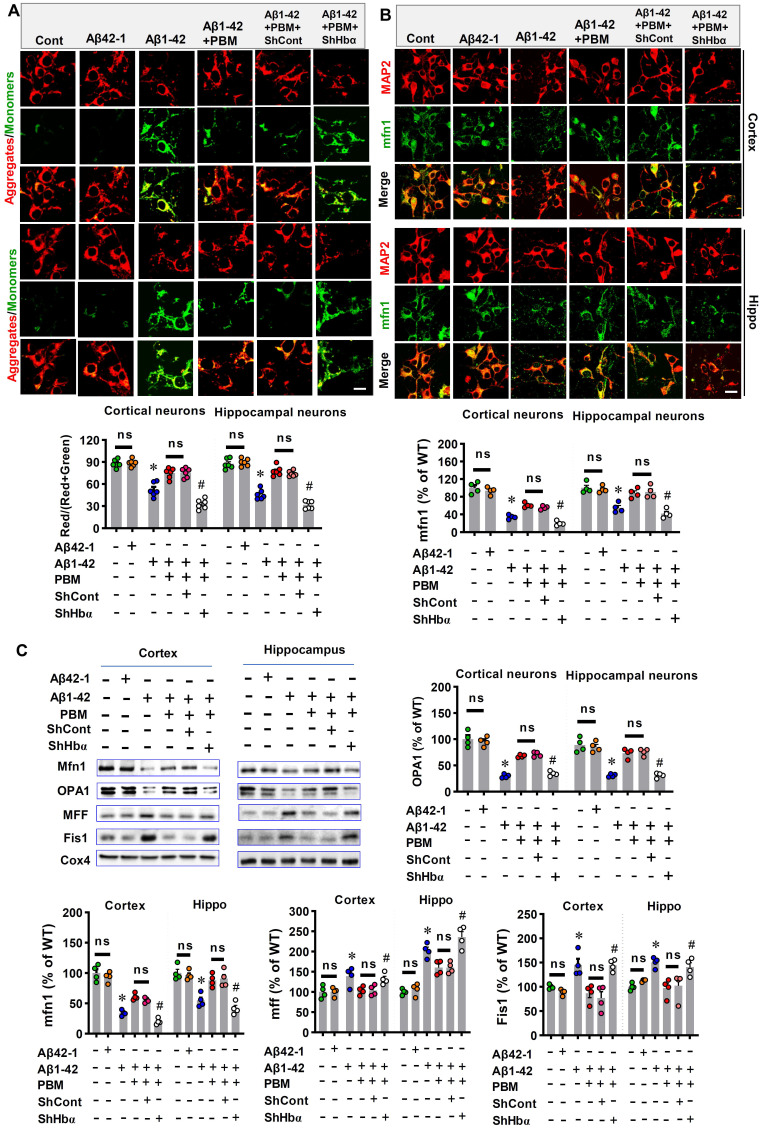
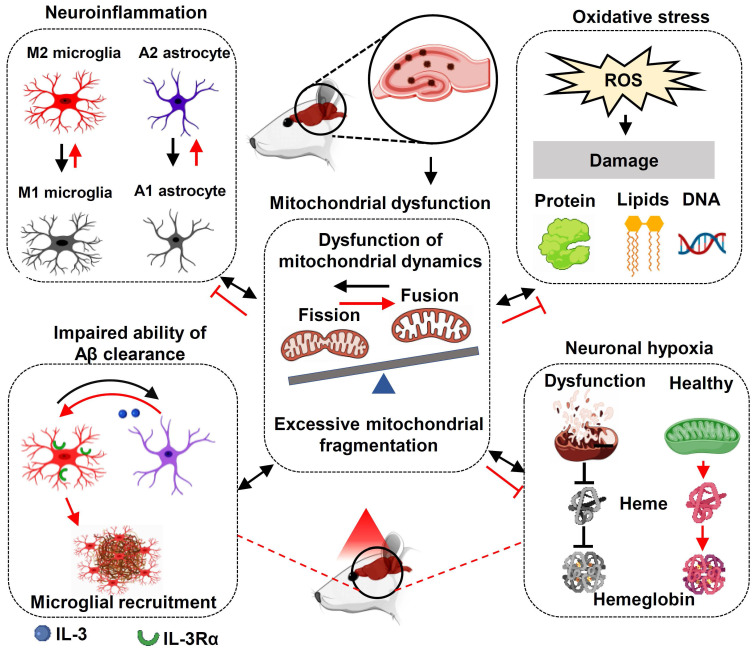
Alzheimer's disease (AD) is the most common form of dementia in the elderly, causing neuronal degeneration and cognitive deficits that significantly impair independence and quality of life for those affected and their families. Though AD is a major neurodegenerative disease with vast avenues of investigation, there is no effective treatment to cure AD or slow disease progression. The present work evaluated the therapeutic effect of long-term photobiomodulation (PBM) treatment with continuous-wave low-level laser on AD and its underlying mechanism. Methods: PBM was implemented for 2 min, 3 times per week for 16 months in 2-month-old transgenic AD rats. A battery of behavioral tests was performed to measure the effect of PBM treatment on cognitive dysfunction in AD rats. The effects of PBM therapy on typical AD pathologies, including amyloid plaques, intracellular neurofibrillary tangles, neuronal loss, neuronal injury, neuronal apoptosis, and neurodegeneration, were then assessed. The underlying mechanisms were measured using immunofluorescence staining, western blotting analysis, mass spectrometry, primary cortical and hippocampal cell cultures, and related assay kits. Results: PBM treatment significantly improved the typical AD pathologies of memory loss, amyloid plaques, tau hyperphosphorylation, neuronal degeneration, spine damage, and synaptic loss. PBM treatment had several mechanistic effects which may explain these beneficial effects, including 1) regulation of glial cell polarization and inhibition of neuroinflammation, 2) preservation of mitochondrial dynamics by regulating fission and fusion proteins, and 3) suppression of oxidative damage to DNA, proteins, and lipids. Furthermore, PBM enhanced recruitment of microglia surrounding amyloid plaques by improving the expression of microglial IL-3Rα and astrocytic IL-3, which implies a potential role of PBM in improving Aβ clearance. Finally, our results implicate neuronal hemoglobin in mediating the neuroprotective effect of PBM, as Hbα knockdown abolished the neuroprotective effect of PBM treatment. Conclusion: Collectively, our data supports the potential use of PBM treatment to prevent or slow the progression of AD and provides new insights into the molecular mechanisms of PBM therapy.

Keywords: Microglia recruitment; Mitochondria; Neuronal hemoglobin; Photobiomodulation; TgF344 rats.


Conflict of interest statement

Competing Interests: The authors have declared that no competing interest exists.

Figures

Figure 1
Figure 1
PBM treatment attenuates cognitive deficits in AD-like rats. (A) Schematic diagram of the experimental design for the in vivo study (a) and in vitro study. (B) Representative tracking plots of animals, escape latency, and escape velocity on the training day (a) and tracking plots, quadrant occupancy, and exploring errors on the probe trials in the Barnes maze test (b) were recorded and analyzed. (C) Representative tracking plots of rats, exploring time spent on two identical objects or on the original object (green) and novel object (blue), entries to the area where the objects located on sampling stage (a) and choice stage were recorded and analyzed. (D) The representative exploration tracks during Y maze (a), and analysis on total entries (b) and alternations (c). Data in behavioral tests are presented as mean ± SEM (n = 12-15). *P < 0.05 versus WT group, # P < 0.05 versus AD group. ns indicates no significant difference (P > 0.05).
Figure 2
Figure 2
PBM treatment ameliorates neuronal injury, neuronal apoptosis, and neuronal degeneration. (A) Representative images of MBP staining and the relative fluorescence intensity compared with the WT group in both the cortex and hippocampus (Hippo). (B) Representative images of MAP2 staining and the relative fluorescence intensity. (C) TUNEL staining was performed to analyze cellular apoptosis. (D) Western blot analysis of Bax protein expression in both the cortex and hippocampus. (E) Caspase-3 activity was determined using a caspase-3 activity kit and expressed as a percentage of change compared with the WT group. (F) Caspase-9 activity was determined using a caspase-9 activity kit. (G) Typical staining of F-Jade C and NeuN in both the cortex and hippocampus. Line-scan analysis showed a strong co-localization of NeuN and F-Jade C signals in the AD group (a). Quantitative analyses of F-Jade C positive cells (b) and surviving neurons (c) in both the cortex and hippocampus. Scale bar = 20 µm. Data are presented as mean ± SEM (n = 4-6). *P < 0.05 versus WT group, # P < 0.05 versus AD group. ns indicates no significant difference (P > 0.05).
Figure 3
Figure 3
PBM treatment alleviates the changes of synapse and dendritic spine density. (A) Ultrastructural analysis of synapses using electron microscopy in both the cortex and hippocampus (a, Scale bar = 200 nm). Low-magnification photograph showing the numbers of synapses (red arrow) in the region of interest of cortex and hippocampus (b, Scale bar = 10 µm). The number of vesicles per bouton (c), docked vesicles (d), bouton size (e), PSD length (f), and the number of synapses (g) were analyzed. Data are presented as mean ± SEM (n = 18). (B) Western blot analysis of synaptophysin (a presynaptic marker), spinophilin (a spine marker), and PSD-95 (a postsynaptic marker). Data are presented as mean ± SEM (n = 4). (C) Representative images of synaptophysin and spinophilin staining in both the cortex and hippocampus were shown in (a, Scale bar = 10 µm). The relative fluorescence intensity of spinophilin (b) and synaptophysin (c), and colocalized puncta between the two channels were qualified. Data are presented as mean ± SEM (n = 6). (D) Representative images of dendritic segments stained by Golgi staining. The dendrite and spine morphologies in both the cortex and hippocampus were analyzed using Image J. Data are presented as mean ± SEM (n = 20). *P < 0.05 versus WT group, # P < 0.05 versus AD group. ns indicates no significant difference (P > 0.05).
Figure 4
Figure 4
PBM treatment attenuates amyloid load and abnormal Tau hyperphosphorylation. (A) Representative immunofluorescence staining for Aβ (4G8) in both the cortex and hippocampus (a). The numbers of plaques (b), Aβ plaque load (c), and the cumulative frequency distribution of the size of the plaque (d) in both the cortex and hippocampus were analyzed. Scale bar = 400 µm. n = 5. (B) Representative 3D reconstruction of amyloid plaques (a) and the analysis of amyloid plaques volume (b). (C) Detergent-soluble and detergent-insoluble Aβ (1-40) and Aβ (1-42) were measured in both the cortex and hippocampus. (E) Representative immunofluorescence staining for PHF1. Scale bar = 20 µm. Data are presented as mean ± SEM (n = 6). *P < 0.05 versus WT group, # P < 0.05 versus AD group.
Figure 5
Figure 5
PBM treatment recruits microglia surrounding amyloid plaques by regulating astrocytic IL-3 and microglial IL-3Rα. (A) Representative immunofluorescence staining and 3D reconstruction of Iba-1 (green) and Aβ (4G8, red) in both cortex and hippocampus (a). Microglial count around amyloid plaques (b) and the colocalization between microglia and Aβ deposition (c) were analyzed. (B) Representative immunofluorescence images showing co-localization of IL-3Rα (red) and Iba-1 (green) in proximity to amyloid plaques in both the cortex and hippocampus (a). The number of IL-3Rα-positive microglia in the cortex (b) and (c) was analyzed. (C) Representative images showing co-localization of IL-3 (red) and GFAP (green) in both the cortex and hippocampus. Scale bar = 20 µm. Data are presented as mean ± SEM (n = 6). *P < 0.05.
Figure 6
Figure 6
PBM treatment promotes microglial polarization from M1 to M2 phenotype. (A) Representative confocal microscopy images and 3D reconstruction images of Iba-1 with M1 marker CD16/32 or the M2 marker CD 206 in both the cortex and hippocampus. The relative fluorescent intensities of CD16/32 and CD206 were analyzed using Image J. Data are presented as mean ± SEM (n = 5). Rectangles indicate cells enlarged and 3D-rendered in the bottom row. Scale bar = 20 µm. (B) Western blotting analysis of M1 phenotype markers (i.e., CD32, CD86, and iNOS) and M2 phenotype markers (i.e., TGFβ and ARG). Data are presented as mean ± SEM (n = 4). (C) Immunofluorescence staining of Iba-1 with M1 marker CD16/32 or the M2 marker CD 206 in vitro cell culture. Scale bar = 20 µm. Data are presented as mean ± SEM (n = 6). *P < 0.05 versus WT group, # P < 0.05 versus AD or Aβ1-42 group.
Figure 7
Figure 7
PBM treatment promotes astrocytic polarization from A1 to A2 phenotype. (A) Representative confocal microscopy images of GFAP (green) with A1 marker C3d or the A2 marker S100A10 in both the cortex and hippocampus. The relative fluorescent intensities of C3d and S100A10 were analyzed using Image J. (B) Representative confocal microscopy images of GFAP with C3d or S100A10 in vitro cell culture. Scale bar = 20 µm. Data are presented as mean ± SEM (n = 6). *P < 0.05 versus WT group, # P < 0.05 versus AD or Aβ1-42 group. ns indicates no significant difference (P > 0.05).
Figure 8
Figure 8
PBM treatment preserves mitochondrial dynamics and regulates mitochondrial fission and fusion-associated proteins in the cortex and hippocampus. (A) Representative confocal microscopy images of Tom20 (green, a mitochondrial outer membrane marker) and DAPI in the cortex and hippocampus. The images were processed using Image J, and the mitochondrial segments were separated as total particles, small particles (size < 1.5 µm), and continuous structures (size > 2 µm). The number of total particles, small particles, and continuous structures was normalized using the total mitochondrial area. (B) Western blotting and quantitative analyses of mitochondrial fission proteins (i.e., MFF, FIS1, Drp1) and fusion proteins (i.e., MFN2 and OPA1). Data are presented as mean ± SEM (n = 4). *P < 0.05 versus WT group, # P < 0.05 versus AD group. ns indicates no significant difference (P > 0.05).
Figure 9
Figure 9
PBM Treatment preserves neuronal hemoglobin. (A) The volcano plot of mass spectrometry results. The blue/red dots indicate the decreased/increased level of proteins in the AD group when compared with the WT group (a). The volcano plot in (b) shows the results of PBM comparing with the AD group. The level of Hbα and Hbβ were significantly decreased in AD compared with WT animals, which were preserved in AD animals with PBM treatment. The dotted line indicates P < 0.05. (c) A two-dimension plot for the ratio of AD/WT and PBM/AD. n=3. (B) Representative images showing co-localization of Hbα (green in (a)) or Hbβ (green in (b)) and GFAP (red) in both the cortex and hippocampus. The fluorescent intensities of Hbα (c) and Hbβ (d) were analyzed. Scale bar = 20 µm. (C) The levels of hemoglobin were measured by a hemoglobin colorimetric assay kit. Data are presented as mean ± SEM (n = 6). *P < 0.05.
Figure 10
Figure 10
Hbα knockdown abolishes PBM treatment's protection on primary culturing neurons. (A) Cell viability was measured using dual-fluorescent FD/PI assay. (a) Representative confocal microscopy images of FD/PI staining of primary cortical neurons and hippocampal neurons. Cellular viability was expressed as the ratio of FD/PI (n=8). Scale bar = 20 µm. (B) MTT assay was performed to test cellular metabolic activity as an indicator of cell viability. Data was quantified as percentage changes versus the cont. group. (C) Levels of cleaved-caspase 3 were measured using immunofluorescence staining. Scale bar = 20 µm. n=6. (D) The caspase-3 and (E) caspase 9 activity was measured using the corresponding activity assay kit and expressed as a percentage change versus the control group (n=8). (H) Western blotting and quantitative analyses of Bax and Bcl-1. Data were presented as a percentage change versus the control group (n=5). *P < 0.05 versus control group, # P < 0.05 versus PBM group. ns indicates no significant difference (P > 0.05).
Figure 11
Figure 11
Hbα knockdown abolishes PBM treatment's protection on mitochondria in the primary culturing neurons. (A) JC-1 Dye was used for detecting mitochondrial membrane potential in the primary culturing neurons. The red JC-1 aggregates indicate high mitochondrial membrane potential, and the green JC-1 monomers indicate low mitochondrial membrane potential. (B) The primary culturing neurons were stained with MAP2 and mfn2 antibodies. The intensities of mitochondrial fusion-related mfn2 were expressed percentage changes versus the control group. Scale bar = 10 µm. (C) Western blotting and quantitative analyses of mitochondrial fission proteins (i.e., MFF and FIS1) and fusion proteins (i.e., MFN2 and OPA1). All data were expressed as a percentage change versus the control group and presented as mean ± SEM (n = 4-6). *P < 0.05 versus cont. group, # P < 0.05 versus PBM group. ns indicates no significant difference (P > 0.05).
Figure 12
Figure 12
Molecular mechanisms of PBM treatment in AD. The improvement of multiple targets contributes to the beneficial effects of PBM treatment including the inhibition of oxidative damage and neuroinflammation; promoting M2 and A2 polarization; improving microglial recruitment; the preservation of mitochondrial function and mitochondrial integrity, and the expression of neuronal hemoglobin. Red lines indicate proposed beneficial effects/mechanisms of PBM in AD.

Similar articles

Cited by

References

    1. Alzheimer's Association. 2021 Alzheimer's disease facts and figures. Alzheimers Dement. 2021;17:327–406. - PubMed
    1. Wu C, Yang L, Li Y, Dong Y, Yang B, Tucker LD. et al. Effects of Exercise Training on Anxious-Depressive-like Behavior in Alzheimer Rat. Med Sci Sports Exerc. 2020;52:1456–69. - PMC - PubMed
    1. Wu C, Yang L, Tucker D, Dong Y, Zhu L, Duan R. et al. Beneficial Effects of Exercise Pretreatment in a Sporadic Alzheimer's Rat Model. Med Sci Sports Exerc. 2018;50:945–56. - PMC - PubMed
    1. Liu PP, Xie Y, Meng XY, Kang JS. History and progress of hypotheses and clinical trials for Alzheimer's disease. Signal Transduct Target Ther. 2019;4:29. - PMC - PubMed
    1. Rajmohan R, Reddy PH. Amyloid-Beta and Phosphorylated Tau Accumulations Cause Abnormalities at Synapses of Alzheimer's disease Neurons. J Alzheimers Dis. 2017;57:975–99. - PMC - PubMed

Publication types

Substances