. 2022 Feb 21:10:766748.
doi: 10.3389/fbioe.2022.766748. eCollection 2022.

A Coupled Biomechanical-Smoothed Particle Hydrodynamics Model for Horse Racing Tracks

Affiliations

A Coupled Biomechanical-Smoothed Particle Hydrodynamics Model for Horse Racing Tracks

Simon M Harrison et al. Front Bioeng Biotechnol. .

Abstract

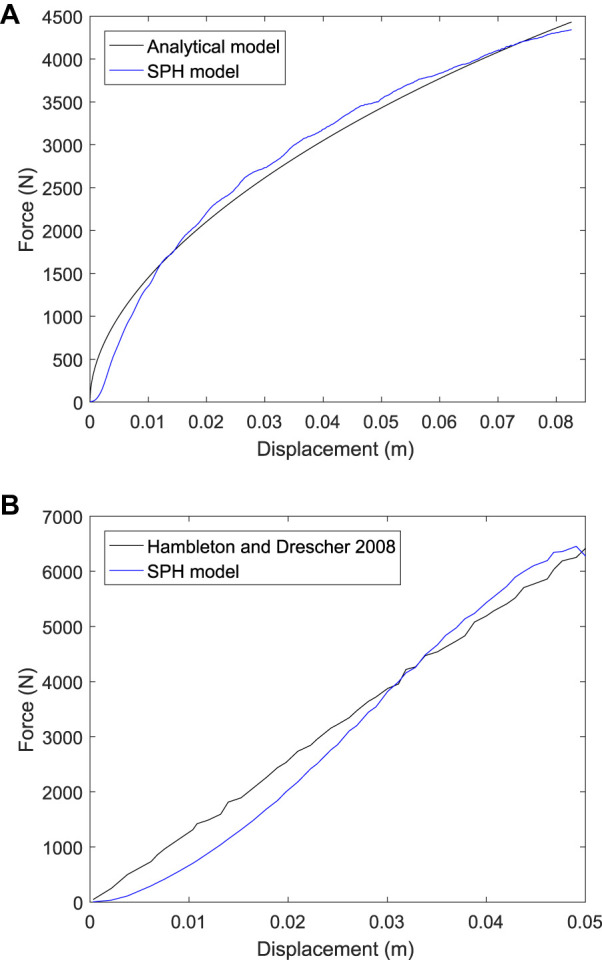
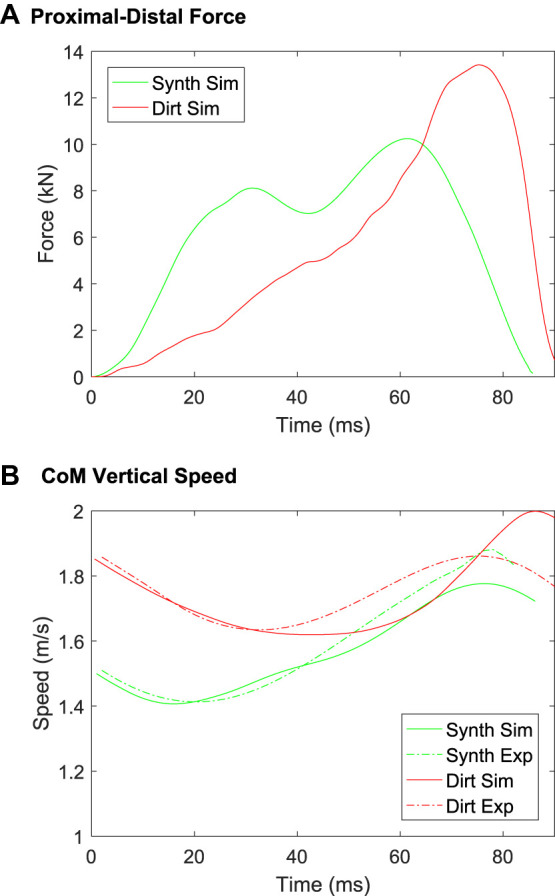
Distal limb injuries are common in racing horses and track surface properties have been associated with injury risk. To better understand how track surfaces may contribute to equine limb injury, we developed the first 3D computational model of the equine hoof interacting with a racetrack and simulated interactions with model representations of 1) a dirt surface and 2) an all-weather synthetic track. First, a computational track model using the Smoothed Particle Hydrodynamics (SPH) method with a Drucker-Prager (D-P) elastoplastic material model was developed. It was validated against analytical models and published data and then calibrated using results of a custom track testing device applied to the two racetrack types. Second, a sensitivity analysis was performed to determine which model parameters contribute most significantly to the mechanical response of the track under impact-type loading. Third, the SPH track model was coupled to a biomechanical model of the horse forelimb and applied to hoof-track impact for a horse galloping on each track surface. We found that 1) the SPH track model was well validated and it could be calibrated to accurately represent impact loading of racetrack surfaces at two angles of impact; 2) the amount of harrowing applied to the track had the largest effect on impact loading, followed by elastic modulus and cohesion; 3) the model is able to accurately simulate hoof-ground interaction and enables study of the relationship between track surface parameters and the loading on horses' distal forelimbs.

Keywords: biomechanics; elastoplastic; equine; gait; large deformation; quadruped.


Conflict of interest statement

The authors declare that the research was conducted in the absence of any commercial or financial relationships that could be construed as a potential conflict of interest.

Figures

FIGURE 1
FIGURE 1
(A–C) Photographs of the track testing device (TTD) and ensemble force-displacement results for the TTD experiments as reported in (Setterbo et al., 2013) for (D) the dirt track and (E) synthetic (all weather) track. In the TTD experiments, a cylindrical mass is dropped onto a track from a known height. External force and distance travelled are recorded with the purpose of characterising the impact properties of the track.
FIGURE 2
FIGURE 2
Configuration of the simulation configuration for the track testing device. The configuration for the dirt track is shown in (A). The top layer of the track has a large number of voids in the material to represent harrowing that is used to break up and soften the track surface. The track extends 0.5 m in depth, below which the ground is predominantly rock. The rock is modelled as a rigid boundary condition. The synthetic track has a depth of 0.26 m under which a rigid boundary condition is also used. Close-up views of the dirt track and synthetic track models are shown in (B) and (C) respectively, which show the non-smooth top surface created by harrowing. The track testing device (TTD) is dropped and the force and displacement are predicted by the simulation. These results are compared to the matching experimental measurements in order to calibrate the rheological component of the model for the deformation of each track surface.
FIGURE 3
FIGURE 3
Schematic of the forelimb skeletal model used to simulate hoof-track forces during locomotion. The SPH track model is the same as used for Calibration of the Track Model Material Properties Using Data From the Track Testing Experiments section. The forelimb is represented by surface meshes of the distal bones (for visualisation purposes) and the outside surface of the hoof. The position and orientation of the hoof is prescribed from motion capture data, but the vertical position of the hoof is predicted by the simulation.
FIGURE 4
FIGURE 4
The two simulation configurations used in the verification and validation analysis. Panel (A) shows the configuration for cylindrical indentation of an elastic solid “soil”. Panel (B) shows the configuration for the indentation of an elastoplastic solid by a rigid wheel.
FIGURE 5
FIGURE 5
(A) Predicted slope of the force-displacement curve for the cylindrical indentation simulation for different SPH resolutions, compared to the analytical model result. Particle separations (psep) of 4–15 mm were used in separate simulations of the indentation problem. The simulation results can be considered converged in respect to particle size and verified against the analytical model for a particle size of 5 mm or smaller. (B) Predicted slope of the force-displacement curve for the cylindrical indentation simulation for different values of bulk modulus, compared to the analytical model result for an SPH resolution of 5 mm.
FIGURE 6
FIGURE 6
Force-displacement results from simulations of wheel indentation into (A) a cohesive soil, and (B) a frictional soil from (Hambleton and Drescher, 2008) and for the current SPH model.
FIGURE 7
FIGURE 7
Visualisation of the interaction of the track testing device with ground for the case a dirt track. The left columns show the results for a vertical impact and the right column shows results for an angled impact. The track is coloured by von Mises stress at various times indicated by labels (A–H). The net force on the TTD is shown as a red vector.
FIGURE 8
FIGURE 8
Visualisation of the interaction of the track testing device with ground for the case a synthetic track. The left columns show the results for a vertical impact and the right column shows results for an angled impact. The track is coloured by von Mises stress at various times indicated by labels (A–H). The net force on the TTD is shown as a red vector.
FIGURE 9
FIGURE 9
Variation of force-time results for simulations using the calibrated material parameters of the (A,B) dirt, and (C,D) synthetic tracks. Results for the vertical impact are shown in the left column (A, C) and for the 20° from vertical impact are shown in the right column (B, D). The experimental data is shown as mean (solid black line) ± standard deviation (dashed black lines) and the simulation data is shown as a red solid line.
FIGURE 10
FIGURE 10
Variation of force-displacement results for the simulated track testing device with changes to (A,B) bulk modulus and (C,D) cohesion parameters of the track. Results for the dirt track are shown in the left column (a, c) for the synthetic track are shown in the right column (b, d).
FIGURE 11
FIGURE 11
Variation of force-displacement results for the simulated track testing device with changes to (A,B) the friction angle parameter and (C,D) variations to the void space (or the volume proportion of air) in the harrowed upper section of track of the track. Results for the dirt track are shown in the left column (a, c) for the synthetic track are shown in the right column (b, d).
FIGURE 12
FIGURE 12
Visualisation of the gait simulations using the coupled B-SPH model for (A) the dirt track and (B) the synthetic track. The bones of the distal limb and the outside surface of the hoof are shown in each instant. The ground reaction force is shown as a red vector. The track surface is coloured by von Mises stress.
FIGURE 13
FIGURE 13
B-SPH model predictions of (A) ground reaction force and (B) centre of mass (CoM) speed in the proximal-distal (vertical) direction, for the synthetic and dirt track surfaces.

References

    1. Akbari Shahkhosravi N., C. R. Bellenzani M., M. S. Davies H., Komeili A. (2021a). The Influence of Equine Limb Conformation on the Biomechanical Responses of the Hoof: An In Vivo and Finite Element Study. J. Biomech. 128, 110715. 10.1016/j.jbiomech.2021.110715 - DOI - PubMed
    1. Akbari Shahkhosravi N., Gohari S., Komeili A., Burvill C., Davies H. (2021b). Linear Elastic and Hyperelastic Studies of Equine Hoof Mechanical Response at Different Hydration Levels. J. Mech. Behav. Biomed. Mater. 121, 104622. 10.1016/j.jmbbm.2021.104622 - DOI - PubMed
    1. Bailey C. J., Reid S. W. J., Hodgson D. R., Rose R. J. (1999). Impact of Injuries and Disease on a Cohort of Two- and Three-Year-Old Thoroughbreds in Training. Vet. Rec. 145, 487–493. 10.1136/vr.145.17.487 - DOI - PubMed
    1. Behnke R. (2018). Numerical Time-Domain Modelling of Hoof-Ground Interaction during the Stance Phase. Equine Vet. J. 50, 519–524. 10.1111/evj.12782 - DOI - PubMed
    1. Biewener A. A. (1998). Muscle-tendon Stresses and Elastic Energy Storage during Locomotion in the Horse. Comp. Biochem. Physiol. B: Biochem. Mol. Biol. 120, 73–87. 10.1016/s0305-0491(98)00024-8 - DOI - PubMed