. 2022 Feb 12;25(3):103918.
doi: 10.1016/j.isci.2022.103918. eCollection 2022 Mar 18.

Slow waves form expanding, memory-rich mesostates steered by local excitability in fading anesthesia

Affiliations

Slow waves form expanding, memory-rich mesostates steered by local excitability in fading anesthesia

Antonio Pazienti et al. iScience. .

Abstract

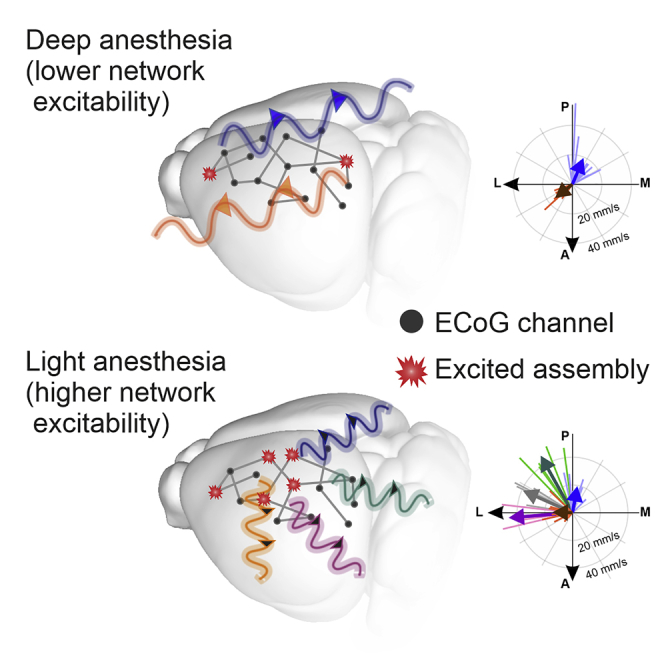
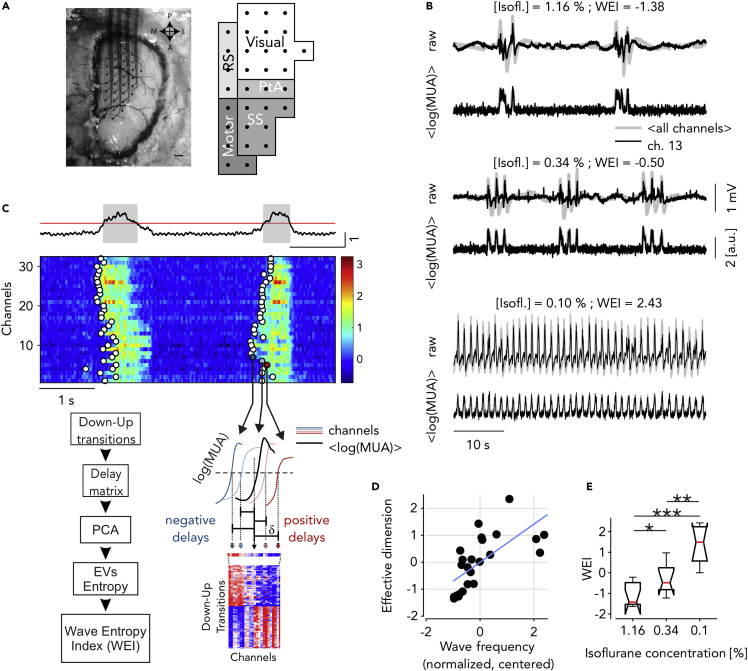
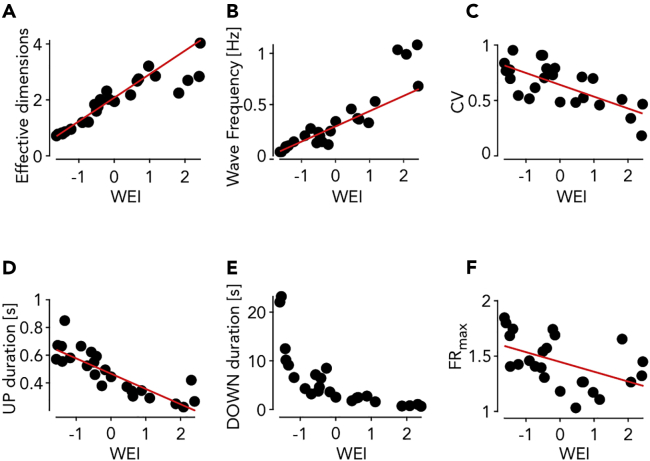
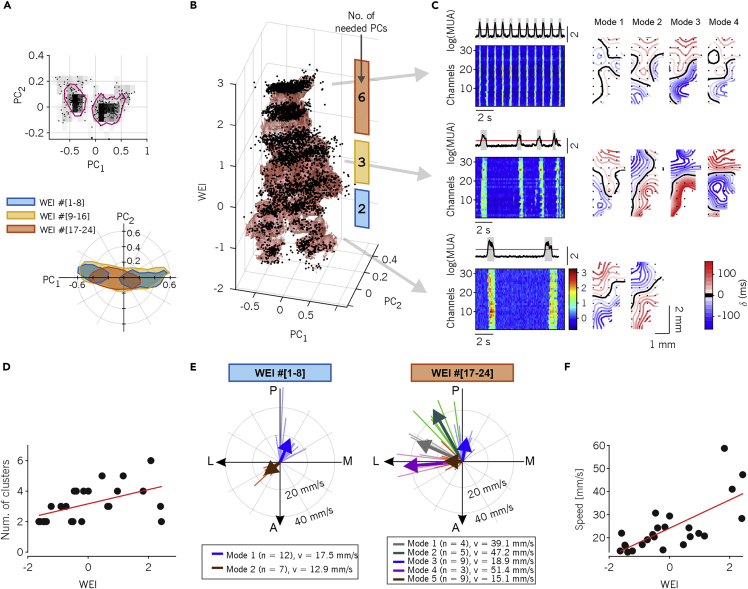
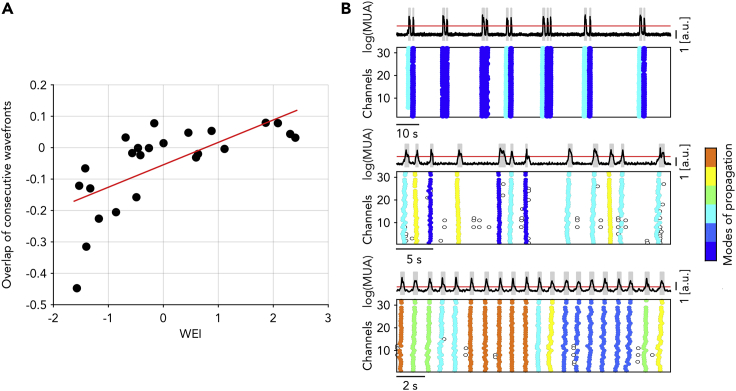
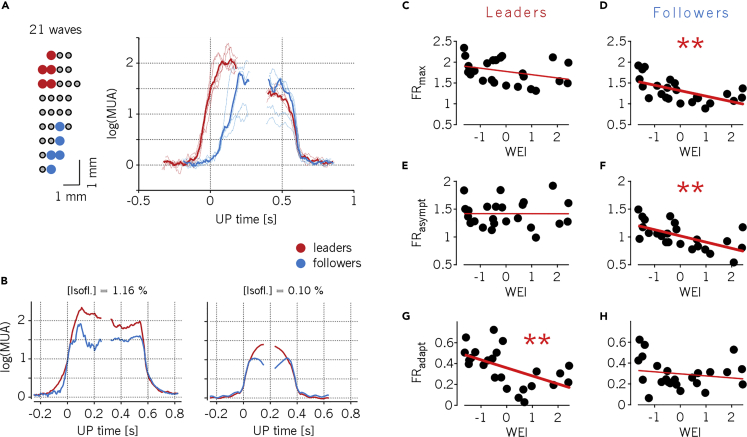
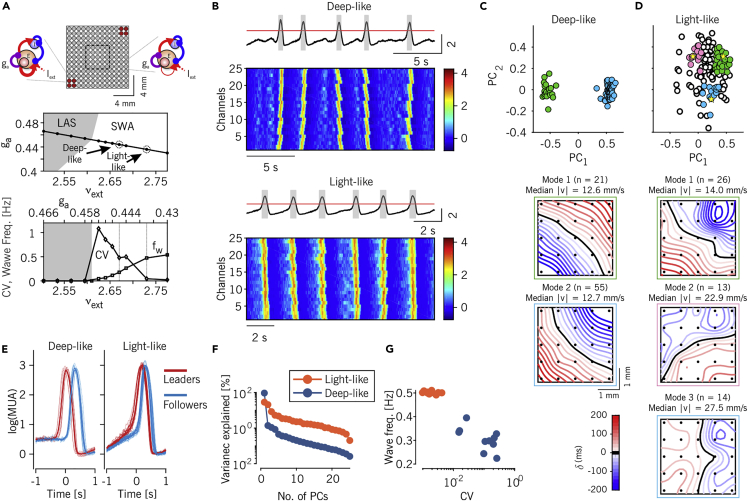
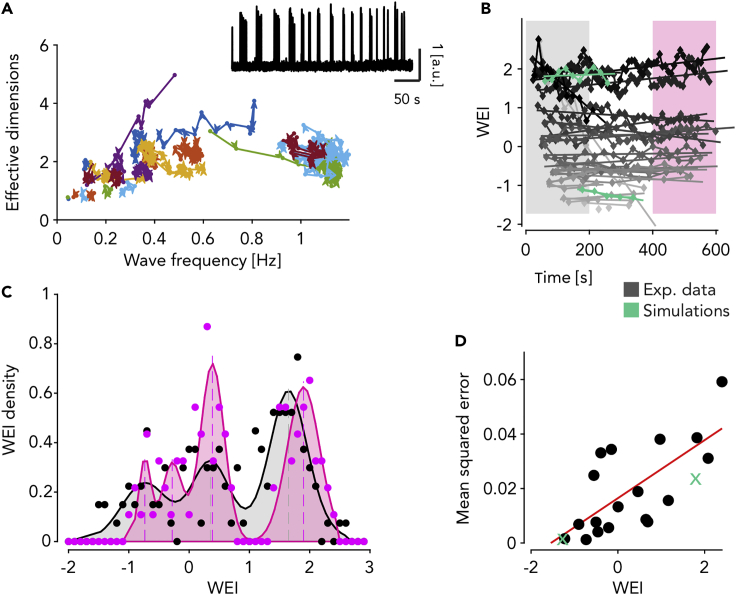
In the arousal process, the brain restores its integrative activity from the synchronized state of slow wave activity (SWA). The mechanisms underpinning this state transition remain, however, to be elucidated. Here we simultaneously probed neuronal assemblies throughout the whole cortex with micro-electrocorticographic recordings in mice. We investigated the progressive shaping of propagating SWA at different levels of isoflurane. We found a form of memory of the wavefront shapes at deep anesthesia, tightly alternating posterior-anterior-posterior patterns. At low isoflurane, metastable patterns propagated in more directions, reflecting an increased complexity. The wandering across these mesostates progressively increased its randomness, as predicted by simulations of a network of spiking neurons, and confirmed in our experimental data. The complexity increase is explained by the elevated excitability of local assemblies with no modifications of the network connectivity. These results shed new light on the functional reorganization of the cortical network as anesthesia fades out.

Keywords: Experimental models in systems biology; Neuroscience.


Conflict of interest statement

The authors declare no competing interests.

Figures

None
Graphical abstract
Figure 1
Figure 1
Extraction of the wave entropy index (WEI) from dimensionality and frequency during slow waves (A) Superficial 32-channel multielectrode array placed on the cortical surface of anesthetized mice (left) and schematic representation of the recorded cortical areas (right, as in (Dasilva et al., 2021)). (B) Representative raw recordings and log(MUA) for one experiment in three anesthesia levels. Gray: average of all channels; black: representative channel. (C) Top: representative average log(MUA) (black), threshold used to extract the Up states (red) and identified Up and Down states (gray and white periods, respectively). Middle: single-channel log(MUA) of activation fronts (Down-Up transitions) from example slow waves (circles). Bottom right: time lags δ of each state transition from the center of a wave comprise the rows of the blue-red time lag matrix (TLM, bottom). Bottom left: flow chart of the method used to work out the wave entropy index (WEI) based on measure of the effective dimension of the TLM and the frequency of Down-Up waves occurrence. EV: eigenvalues. (D) Effective dimension (see STAR Methods) and mean frequency of the Down-Up transitions (normalized by their variances and centered around their means) for each recording (n=24, eight mice, and three anesthesia levels each). Blue line: first principal component, onto which the single recordings are projected thus defining the wave entropy index (WEI). (E) WEI values versus anesthesia concentration (stars indicate significance for Wilcoxon test, P<0.05, <0.01, <0.001, respectively).
Figure 2
Figure 2
Statistical properties of the slow wave activity (SWA) as a function of the WEI (A–F) Number of effective dimensions (A), wave frequency (Down-Up transitions) (B), coefficient of variation of Down-Up cycles (C), mean Up (D), Down (E) state durations and maximal firing rate during the Ups versus the WEI (F). Red lines: linear regression (P < 10˗9, P < 10˗9, P < 0.001, P < 10˗6, P < 0.05 for panels (A–D and F), respectively).
Figure 3
Figure 3
Speed and wave diversity increases as anesthesia fades out (A) Top: representative distribution of time lags (i.e., rows of the TLM) in the space of the first two principal components (PC1, PC2). All transitions from experiments with WEI ranking one to eight are shown. Magenta contours represent 66% isodensity levels of the distribution. Bottom: 65% isodensity contours for the activation waves from experiments and anesthesia levels pooled in three equally-sized groups according to the WEI ranking. (B) Activation waves (dots) for all experiments projected on the first 2 PCs versus WEI. Red shading: smoothed 65% isodensity surface. The colored bars on the right show the WEI ranges that define the three groups used in panel (A). The number written on each bar shows the number of PCs needed to obtain a value of Pearson correlation 0.8 between the TLM reconstructed with this very number of PCs only and the original, full TLM. (C) Average and single-channel MUA for three experiments and anesthesia levels representative of the WEI groups in (A) and (B). Right: resulting average spatiotemporal propagating patterns of activation waves clustered in different “modes of propagation” (see also supplemental movies S1 and S2). (D) Number of propagation modes per experiment and anesthesia level. Red line: linear regression (P < 0.05). (E) Direction and velocity of the modes of propagation from the experiment’s eight lowest and highest values of WEI. Modes are colored according to the results of k-means clustering. Clusters with less than three patterns are not shown (number of excluded modes = 1, number of excluded patterns = 2). Thick arrows: average directions and velocities of each mode. (F) Mean propagation velocity for each experiment and anesthesia level. Red line: linear regression (P < 10˗4).
Figure 4
Figure 4
Propagation modes alternate as anesthesia level gets deeper (A) Autocorrelation (i.e., overlap) of the time lags associated with consecutive activation waves for experiment and anesthesia levels with increasing WEI. Red line: linear regression (P < 0.001). (B) Average log(MUA) and single-channel Down-Up transitions for three representative experiments, showing (from top to bottom) negative, null, and positive consecutive overlap. Colors represent different modes of propagations as in Figure 3.
Figure 5
Figure 5
Neuronal assemblies leading wave propagations are the most excitable (A) Left: mapping of the five channels leading (red) and following (blue) a representative mode of propagation (in this case going posterior-anterior, and containing 21 activation waves). Right: average log(MUA) of the leading and following channels in their Down-Up and Up-Down transitions (thin lines), and their grand-averages (thick lines). The average time of Down-Up transitions in a wave is considered as time origin. (B) Representative average log(MUA) during Down-Up and Up-Down transitions of leading and following channels for two anesthesia levels in the same animal. Differently from panel (A), time origin refers to state transitions for each group of channels. WEI values are −1.63 and 0.46 for deep and light anesthesia levels, respectively. (C–F) Maximum (C, D) and asymptotic (E, F) firing rate (FRmax and FRasympt, respectively) during Up states for leading and following channels across all experiments and anesthesia levels (n = 24). (stars in panels D,F: P < 0.01.) (G and H) Firing rate adaptation measured as the difference FRasympt - FRmax from panels (C–F) for leading (G) and following (H) channels. (P < 0.01 for panel G.)
Figure 6
Figure 6
Increased excitability in model explains observed changes as anesthesia lightens (A) Top: schematic representation of the simulated network, consisting of 13 × 13 local cell assemblies. Cell assemblies are composed of excitatory and inhibitory integrate-and-fire neurons and are sketched on the left those with increased excitability (stronger synaptic self-excitation, red circles) and on the right the ones with reference excitability in the rest of the grid. The internal square shows the portion of the network used for the analysis. Middle: bifurcation diagram showing the different activity regimes displayed by spiking neuron network simulations as the level ga of the firing rate adaptation and the rate vext of incoming excitatory spikes from other (external) areas are changed. To model anesthesia fading, these parameters are changed according to the depicted black line connecting the low-firing asynchronous (LAS) and the slow wave state. The arrows point to the parameter combinations used in the rest of the figure. Bottom: coefficient of variation of Up-Down cycles (circles) and frequency of waves (fw, squares) measured in simulations along the above black trajectory. (B) Representative average and single-channel log(MUA) in the simulated network for low wave frequency/high CV (top, “deep-like”), and high frequency/low CV (bottom, “light-like”) modeling deep and light levels of anesthesia, respectively. (C and D) Distributions of time lag arrays of spontaneously occurring activation waves in the model network in the plane (PC1, PC2) as in Figures 3A and 3B for in vivo recordings. Model networks in both the deep-like and the light-like conditions are shown (panel C and D, respectively). Colored dots highlight the wavefronts belonging to the modes of propagations singled out in bottom panels, relying on k-means clustering as in Figure 3C. For the “light-like” case (panel D) three representative groups of wavefronts were selected; these included the points centered at the yellow stars (see STAR Methods for details). (E) Average log(MUA) of the five leading (red) and five following (blue) channels (thin) and averages (thick) around the Down-Up transitions for all modes shown in panel C, for the “deep-like” (left) and “light-like” (right) conditions. (F) Percentage of explained variance as a function of the number of PCs for the TLMs extracted from the simulated data. (G) Frequency of the activation waves versus the CV of the Up-Down cycles for the simulated data obtained from 10 equally-sized nonoverlapping intervals of time.
Figure 7
Figure 7
WEI drifts in time toward two preferred values at fixed anesthesia levels (A) Time-resolved relationship between effective dimension of activation waves and their frequency of occurrence for all experiments and anesthesia levels (n = 24) each identified by a different color. Points of the trajectories are computed from time windows including 30 consecutives activation waves. Adjacent time windows have 10 waves of overlap. Inset: example experiment with log(MUA) displaying nonstationary frequency of wave occurrence. (B) Time-resolved WEI computed in the same time window as in (A). Time values are the centers of the time windows. Lines are linear fits for each experiment and anesthesia level. Colored intervals highlight the first and the last 200 s of the experiments. Gray levels represent the average WEI value. Green: simulations. (C) Distribution of WEI values for the first and the last 200 s of the experiments (highlighted in panel B). Colored shading, fit of the distribution with up to four Gaussian probability densities. (D) Mean squared error of the linear fits shown in (B) as a function of the mean WEI per experiment and anesthesia levels (n = 24). Red line: linear regression (P<0.05). Green: simulations.

Similar articles

Cited by

References

    1. Adamantidis A.R., Gutierrez Herrera C., Gent T.C. Oscillating circuitries in the sleeping brain. Nat. Rev. Neurosci. 2019;20:746–762. - PubMed
    1. Alkire M.T., Hudetz A.G., Tononi G. Consciousness and anesthesia. Science. 2008;322:876–880. - PMC - PubMed
    1. Amit D.J., Brunel N. Model of global spontaneous activity and local structured activity during delay periods in the cerebral cortex. Cereb. Cortex. 1997;7:237–252. - PubMed
    1. Andrillon T., Nir Y., Staba R.J., Ferrarelli F., Cirelli C., Tononi G., Fried I. Sleep spindles in humans: insights from intracranial EEG and unit recordings. J. Neurosci. 2011;31:17821–17834. - PMC - PubMed
    1. Barttfeld P., Uhrig L., Sitt J.D., Sigman M., Jarraya B., Dehaene S. Signature of consciousness in the dynamics of resting-state brain activity. Proc. Natl. Acad. Sci. U S A. 2015;112:887–892. - PMC - PubMed

LinkOut - more resources