. 2022 Feb 18;4(2):fcac044.
doi: 10.1093/braincomms/fcac044. eCollection 2022.

Astrocytic junctional adhesion molecule-A regulates T-cell entry past the glia limitans to promote central nervous system autoimmune attack

Affiliations

Astrocytic junctional adhesion molecule-A regulates T-cell entry past the glia limitans to promote central nervous system autoimmune attack

Mario Amatruda et al. Brain Commun. .

Abstract

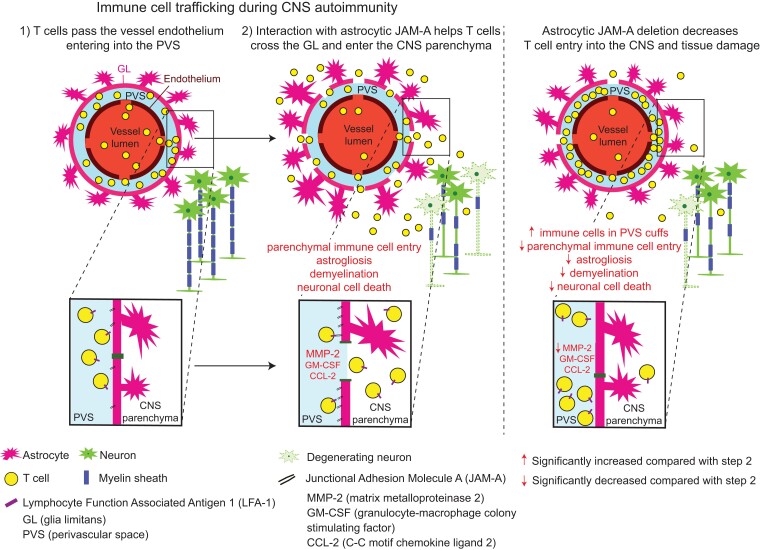
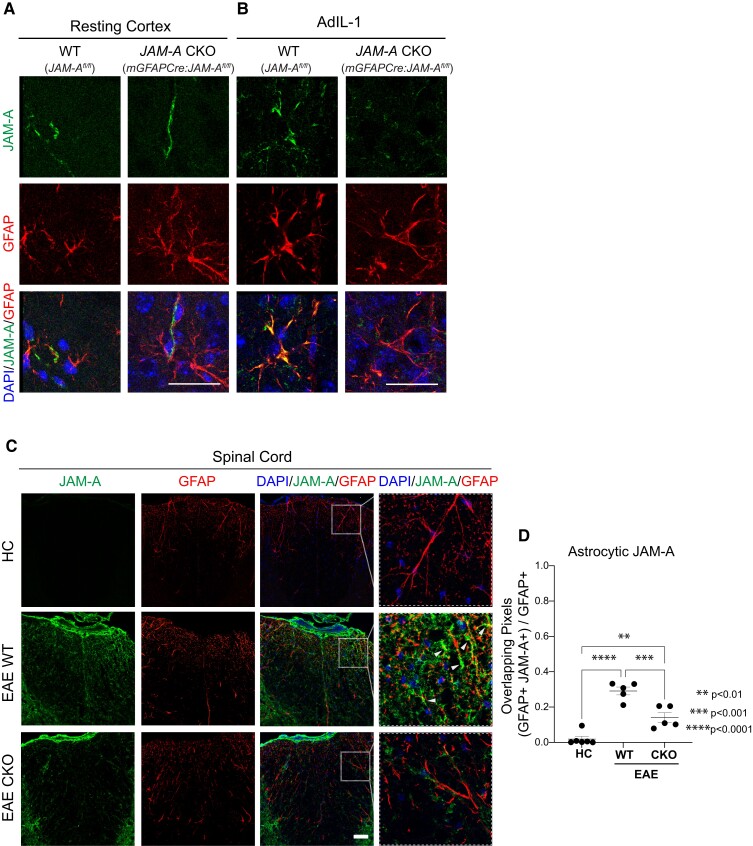
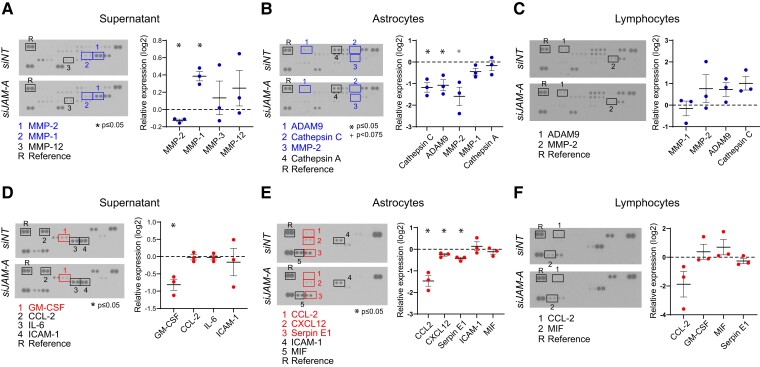
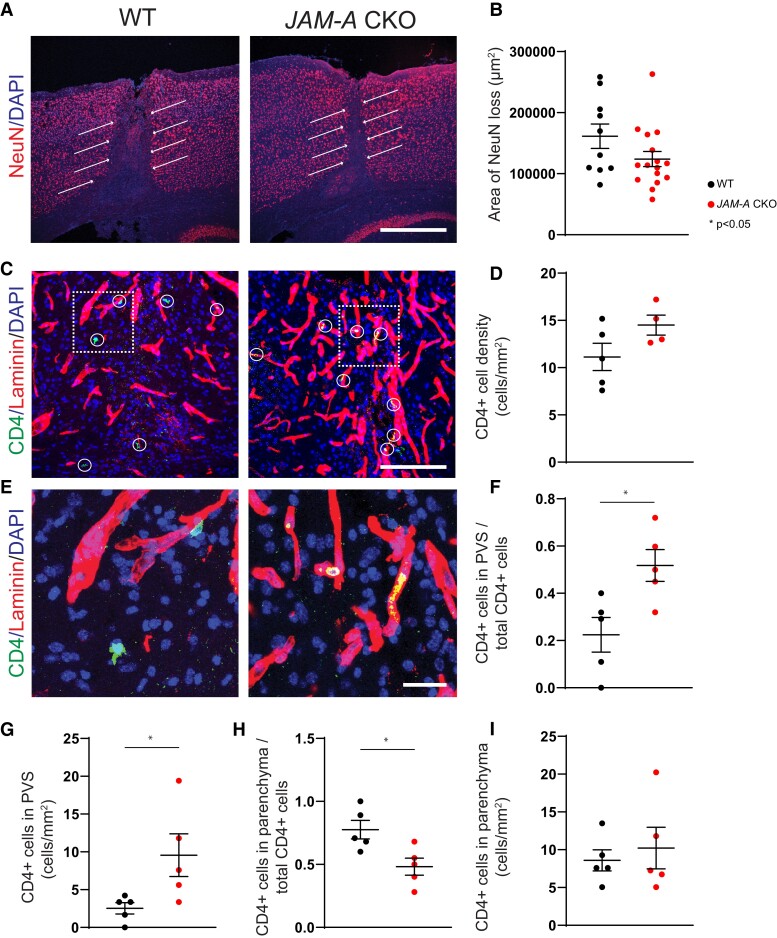
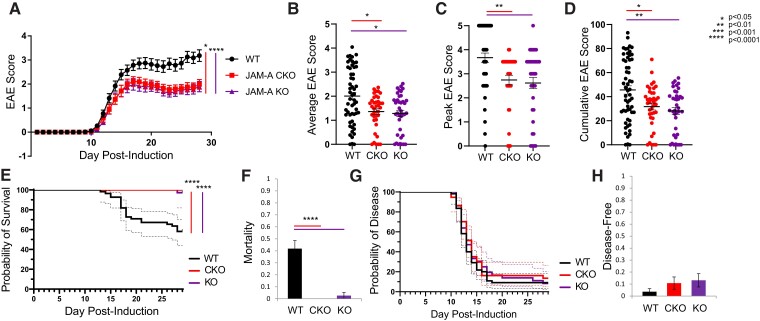
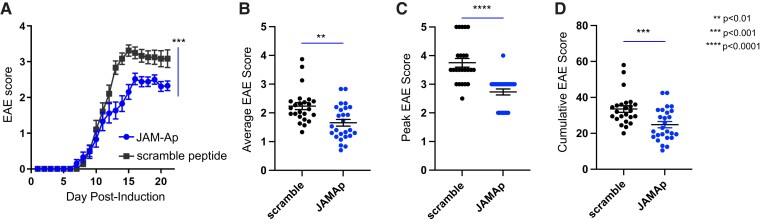
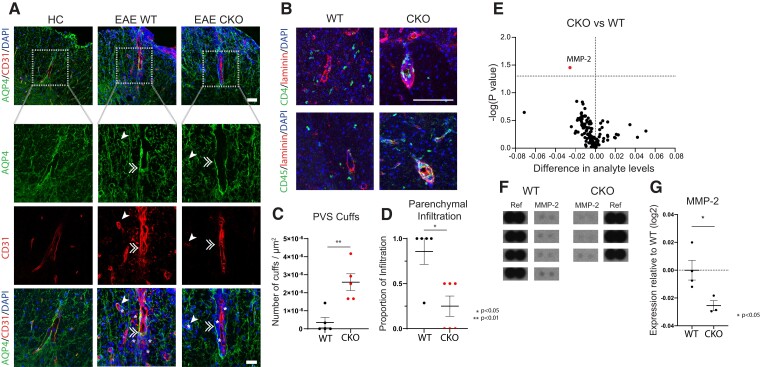
Contact-mediated interactions between the astrocytic endfeet and infiltrating immune cells within the perivascular space are underexplored, yet represent potential regulatory check-points against CNS autoimmune disease and disability. Reactive astrocytes upregulate junctional adhesion molecule-A, an immunoglobulin-like cell surface receptor that binds to T cells via its ligand, the integrin, lymphocyte function-associated antigen-1. Here, we tested the role of astrocytic junctional adhesion molecule-A in regulating CNS autoinflammatory disease. In cell co-cultures, we found that junctional adhesion molecule-A-mediated signalling between astrocytes and T cells increases levels of matrix metalloproteinase-2, C-C motif chemokine ligand 2 and granulocyte-macrophage colony-stimulating factor, pro-inflammatory factors driving lymphocyte entry and pathogenicity in multiple sclerosis and experimental autoimmune encephalomyelitis, an animal model of CNS autoimmune disease. In experimental autoimmune encephalomyelitis, mice with astrocyte-specific JAM-A deletion (mGFAP:CreJAM-Afl/fl ) exhibit decreased levels of matrix metalloproteinase-2, reduced ability of T cells to infiltrate the CNS parenchyma from the perivascular spaces and a milder histopathological and clinical course of disease compared with wild-type controls (JAM-Afl/fl ). Treatment of wild-type mice with intraperitoneal injection of soluble junctional adhesion molecule-A blocking peptide decreases the severity of experimental autoimmune encephalomyelitis, highlighting the potential of contact-mediated astrocyte-immune cell signalling as a novel translational target against neuroinflammatory disease.

Keywords: astrocyte immune cell cross-talk; experimental autoimmune encephalomyelitis; glia limitans; junctional adhesion molecule-A; multiple sclerosis.


Figures

Graphical Abstract
Graphical Abstract
Figure 1
Figure 1
Inflammation induces reactive astrocytes to express JAM-A diffusely throughout the cell surface membrane in vitro. (A and B) Astrocytic JAM-A (green) was increased in vitro at 24 h after treatment with 20 ng/ml IL-1β and, not significantly, by the combination of IL-1β + 100 ng/ml CCL-2 but not CCL-2 alone (average vehicle (14 500) versus IL-1β (18 915) versus CCL-2 (14 950) versus IL-1β + CCL-2 (17 665), vehicle versus IL-1β: P = 0.03, CCL-2 versus IL-1β: P = 0.04, one-way ANOVA with Tukey’s multiple comparison test). JAM-A was both diffusely localized throughout the cell membrane (green arrows) and co-localized with the tight junction marker, occludin (OCLN, red, red arrows; yellow double-headed arrow pointing to overlay of OCLN and JAM-A in yellow). Scale bar: 10 µm. (C) Astrocytic occludin was similarly induced at 24 h after treatment with IL-1β or the combination of IL-1β and CCL-2 but not CCL-2 alone (average vehicle (10 550) versus IL-1β (17 706) versus CCL-2 (12 117) versus IL-1β + CCL-2 (16 657), vehicle versus IL-1β: P = 0.01, vehicle versus IL-1β + CCL-2: P = 0.03, CCL-2 versus IL-1β: P = 0.04, one-way ANOVA with Tukey’s multiple comparison test). (D) The addition of CCL-2 to IL-1β did not change the proportion of JAM-A+ pixels co-localized with OCLN+ pixels at 24 h [IL-1β (0.36) versus IL-1β + CCL-2 (0.32), P = 0.63, unpaired two-tailed t-test]. (B–D) The analysis was performed on three images for each three technical replicates per condition. Dot plots show the average of the technical replicates within each biological replicate (n = 3 per group).
Figure 2
Figure 2
Astrocytic JAM-A expression was successfully reduced in vivo using a transgenic mouse line. (A and B) JAM-A and GFAP expression patterns were visualized in vivo in the cortex of WT (JAMAfl/fl) and JAM-A CKO (mGFAPCre:JAMAfl/fl) mice both in resting conditions (A) and after the injection of an IL-1β expressing adenovirus (AdIL-1) (B). In the resting cortex (A), JAM-A (green) does not strongly overlap (yellow) with astrocytes (GFAP, red). In the inflamed cortex of WT AdIL-1-injected brains (B), JAM-A (green) overlaps with GFAP (red, overlap: yellow) and astrocytic JAM-A appears diminished in CKOs. Scale bars in A and B are 25 µm. (C) Images show immunofluorescence for JAM-A (green), GFAP (red) and DAPI (blue) in the spinal cord dorsal column of HCs, WT and CKO mice with EAE. JAM-A expression is nearly undetectable in the spinal cord of HC mice, while it is upregulated in EAE WT and EAE CKO mice. EAE CKO mice show decreased immunoreactivity to JAM-A in GFAP-positive astrocytes compared with EAE WT, as shown in the higher magnification inset (white dashed square). White arrowheads point to JAMA-A+ GFAP+ astrocytes (overlap: yellow). Scale bar: 50 µm. (D) Colocalization analysis shows a greater proportion of GFAP+ pixels that co-localize with JAM-A+ pixels during EAE compared with HC [average HC (0.19) versus EAE WT (0.29) versus EAE CKO (0.14), HC versus EAE WT: P < 0.0001; HC versus EAE CKO: P = 0.0036] and a decreased proportion in EAE CKO mice compared with EAE WT mice (EAE WT versus EAE CKO: P = 0.0009). Number of animals HC, n = 6; EAE WT, n = 5; EAE cKO, n = 5, one-way ANOVA with Tukey’s multiple comparison test.
Figure 3
Figure 3
Astrocytic JAM-A increases pro-inflammatory protease and cytokine levels in astrocyte-CD3+ T-cell co-culture. Astrocytes were transfected with JAM-A or non-targeted siRNA (siJAM-A versus siNT), then co-cultured with CD3+ T cells for 24 h and samples processed for human protease and cytokine ELISA immunoassays. (A–C) JAM-A knock-down in astrocytes led to an increase of MMP-1 (relative log2 expression 0.38, P = 0.019) and a decrease of MMP-2 (relative log2 expression −0.13, P = 0.014) in the supernatant and decrease of ADAM9 (relative log2 expression −1.074, P = 0.05) and cathepsin C (relative log2 expression −1.174, P = 0.006) in astrocyte lysates (B). There were no significant changes in protease levels seen in lymphocyte lysates (C). (D–F) Astrocytic JAM-A knock-down led to decreased levels of (D) GM-CSF (relative log2 expression −0.79, P = 0.04) in the supernatant and (E) CCL-2 (relative log2 expression −1.3, P = 0.03), CXCL12 (relative log2 expression −0.13, P = 0.04) and serpin E1 (relative log2 expression −0.3, P = 0.03) in astrocytic lysates. There were no significant changes in cytokine levels seen in lymphocyte lysates (F). Data (A–F) are from three biological replicates; two-tailed paired t-tests were performed on probes demonstrating a visually detectable signal in normalized expression values relative to a reference control.
Figure 4
Figure 4
In inflammatory cortical lesions, CD4+ T cells are arrested within the PVS in the absence of astrocytic JAM-A. Asymptomatic inflammatory cortical lesions were induced in JAM-A CKO and WT mice via the microinjection of AdIL-1 into the frontal cortex. Brains were harvested for histopathology at 7 days post-injection. (A and B) Lesions in JAM-A CKO mice, as measured by the area of neuronal cell death (loss of NeuN, red, white arrows), showed a trend in smaller lesion size compared with WT mice that did not reach statistical significance (P = 0.18, CKO n = 16 mice, WT n = 10 mice, Mann–Whitney test). (C and D) CD4+ cells (green and circled in white) showed an increased but statistically non-significant trend in number within JAM-A CKO lesions, scale bar: 125 μm [average number/mm2, 14.5 (CKO) versus 11.1 (WT), P = 0.11; CKO n = 4 mice, WT n = 5 mice, Mann–Whitney test]. (E–I) In JAM-A CKO mice, a higher proportion and total number of CD4+ cells (green) co-localize to the laminin-positive (red) basement membrane of the PVS while a lower proportion of cells localize to the parenchyma (laminin-negative) though total number of cells within the parenchyma per area remain the same. (E) Scale bar: 25 μm. (F) Average proportion of CD4+ cells in the PVS over total CD4+ cells: 0.50 (CKO) versus 0.29 (WT), P = 0.02. (G) Average number CD4+ cells in the PVS/mm2: 7.6 (CKO) versus 3.4 (WT), P = 0.03. (H) Average proportion of CD4+ cells in the parenchyma over total CD4+ cells: 0.50 (CKO) versus 0.70 (WT), P = 0.02. (I) Average number CD4+ cells in the PVS/mm2: 7.2 (CKO) versus 7.6 (WT), P = 0.85. (F–I) N = 5 mice per group, Mann–Whitney tests.
Figure 5
Figure 5
Astrocytic JAM-A promotes clinical disease severity during EAE. (A) JAM-A CKO and KO mice showed a milder course of clinical disability than WT mice with EAE and there was no difference between CKO and KO animals (WT versus JAM-A CKO: P = 0.0122, WT versus JAM-A KO: P < 0.0001, JAM-A CKO versus JAM-A KO: P > 0.05, Friedman’s one-way ANOVA with Dunn’s multiple comparisons test). (B–D) Average (B), peak (C) and cumulative (D) scores of the EAE trial shown in (A) were significantly lower in CKO and KO mice compared with WT [average score: 2.0 (WT) versus 1.36 (CKO) versus 1.28 (KO), WT versus CKO: P = 0.030, WT versus KO: P = 0.016, CKO versus KO: P > 0.5; peak score: 3.6 (WT) versus 2.7 (CKO) versus 2.6 (KO), WT versus CKO: P = 0.003, WT versus KO: P = 0.002, CKO versus KO: P > 0.5; cumulative score: 45.58 (WT) versus 31.75 (CKO) versus 28.2 (KO), WT versus CKO: P = 0.04, WT versus KO: P = 0.007, CKO versus KO: P > 0.5, Kruskal–Wallis tests]. Average in graphs shown with SEM. (E) Survival curves of mortality revealed that WT mice sustained greater mortality over the course of EAE than CKO or KO, Mantel–Cox test, P < 0.0001. (F) At Day 28, mortality rate was higher in WT mice compared with CKO and KO [0.41 (WT) versus 0 (CKO) versus 0.26 (KO), P < 0.0001, Kruskal–Wallis test]. (G) Disease curves demonstrated no differences in susceptibility to or timing of disease, Mantel–Cox test, P = 0.65. (H) At Day 28, rates of disease resistance (proportion of mice that did not develop neurological deficit) showed an increased trend that was not statistically significant for CKO and KO compared with WT [0.014 (WT) versus 0.108 (CKO) versus 0.131 (KO), P = 0.22, Kruskal–Wallis test]. Graphs (A–H) show pooled data from three independent EAE experiments for WT and CKO and two independent EAE experiments for KO with a minimum of nine mice per group in each experiment, total WT n = 55, JAM-A CKO n = 37, JAM-A KO n = 38.
Figure 6
Figure 6
Treatment with a JAM-Ap reduced clinical disease severity during EAE. (A) WT mice with EAE treated with daily intraperitoneal injection of a JAM-Ap from Day 7 post-immunization showed a significantly milder course of clinical disability compared with scramble peptide-treated controls. Differences in the disease progression over time were assessed with the Wilcoxon matched-pairs signed-rank test (P = 0.0005). Average (B), peak (C) and cumulative (D) scores of the EAE trial shown in (A) were significantly lower in JAM-Ap-treated mice compared with scramble peptide-treated mice [average score: 2.23 (scramble) versus 1.65 (JAM-Ap), P = 0.001; peak score: 3.75 (scramble) versus 2.73 (JAM-Ap), P < 0.0001; cumulative score: 33.54 (WT) versus 24.83 (CKO), P = 0.001, Mann–Whitney tests]. Average in graphs shown with SEM. Graphs (A–D) show pooled data from three independent EAE experiments with a minimum of eight mice per group for each experiment, total JAM-Ap n = 24, scramble n = 26.
Figure 7
Figure 7
In EAE, astrocytic JAM-A signalling induces MMP-2 expression and promotes T-lymphocyte entry into the CNS parenchyma from the PVSs. (A) PVSs were identified relative to AQP4 staining of the astrocyte endfeet and CD31 staining of the endothelium in HC, WT and CKO mice. Cell infiltrates (DAPI, blue) were seen in the CNS at 5 days post-EAE disease onset in both WT and CKO but not in HC. Representative images demonstrate that in JAM-A CKO, infiltrating cells (highlighted by white asterisks) accumulated mostly within the PVSs (between AQP4 and CD31) whereas in WT, infiltrating cells localized diffusely past the PVSs within the CNS parenchyma. White single arrowheads and white doubled arrowheads indicate transverse and longitudinal blood vessels, respectively. Top panel, scale bar: 50 µm. Bottom panels represent inset outlined by dotted white box, scale bar: 30 µm. (B) In inflammatory lesions of EAE at Day 21 post-immunization, in CKO mice, CD4+ (green, upper panel) and CD45+ cells (green, lower panel) clustered in ‘cuffs’, colocalizing with the pan-laminin marker (in red), whereas in WT mice, CD4+ and CD45+ cells were instead located in the parenchyma. Scale bar: 100 µm. (C) Number of CD4+ cuffs/µm2 of lumbar spinal cord cross-sections were increased in JAM-A CKO mice compared with WTs [average 3.5 × 10−7 (WT) versus 2.6 × 10−6 (CKO), P = 0.008, Mann–Whitney test, number of mice: WT n = 5, CKO n = 5]. (D) Proportion of parenchymal infiltration of CD4+ cells seen in serial spinal cord sections was lower in JAM-A CKO compared with WT mice [average 0.86 (WT) versus 0.25 (CKO), P = 0.02, Mann–Whitney test, WT n = 5, CKO n = 6]. (E) A volcano plot shows the differential level of 111 pro-inflammatory cytokines, chemokines, proteases and acute phase reactants in spinal cord lysates of JAM-A CKO and WT mice at 5 days post-EAE disease onset as measured using mouse proteome ELISA immunoassays. CKO mice showed an overall reduction of many factors, though MMP-2 (highlighted in red) was the sole statistically significant factor compared with WT controls. (F) MMP-2 probes on the ELISA array in CKO and WT mice, along with reference spots, used for signal (pixel intensity) normalization, are shown. Complete ELISA arrays from each mouse are shown in Supplementary Fig. 6 and original blots are included in Supplementary Materials. (G) Spinal cord levels of MMP-2 in CKO mice relative to WT controls were significantly decreased at 5 days post-EAE disease onset (relative log2 expression −0.025, P = 0.0351, two-tailed unpaired t-test, WT, n = 4; CKO, n = 3).
Figure 8
Figure 8
Astrocytic JAM-A does not change the total number of CD3+ or proportion of CD4+ cells within the CNS or spleen during EAE. (A–H) Flow cytometry was performed on spinal cords and spleens of WT (n = 5) and CKO (n = 5) mice with EAE on Day 5 from the onset of disease. Average EAE score: WT 2.8, CKO 2.6. (A) Representative plots show (B) similar total CD3+ cell counts in the spinal cord of CKO and WT (mean CKO 0.23% versus WT 0.19%, P = 0.42, unpaired two-tailed t-test). (C) Representative plots reflect (D) no difference found in the proportion of CD3+CD4+ cells in the spinal cord of CKOs compared with WTs (mean CKO 84.73% versus WT 87.97%, P = 0.29, unpaired two-tailed t-test). (E–H) In the spleen, total CD3+ and CD3+CD4+ counts were unchanged between CKO and WT groups (CD3+: mean CKO 24.3% versus WT 28.4%, P = 0.25; CD3+CD4+: mean CKO 53.1% versus 55.6%, P = 0.34, unpaired two-tailed t-test).
Figure 9
Figure 9
Astrocytic JAM-A exacerbates histopathological markers of neuroinflammatory damage in EAE. (A and B) Proportion of fluoromyelin (FM, green; marker of myelin) positive area of the lumbar anterolateral white matter tracts was significantly decreased in WT—but not in CKO—mice in both the acute (5 days from disease onset) and late chronic stage of EAE (28 days post-induction) compared with HCs [HC (98.53%) versus EAE WT 5 days from disease onset (77.85%), P = 0.0014; HC (98.53%) versus EAE WT Day 28 post-induction (69.35%), P < 0.0001]. In the acute phase of EAE, CKO mice showed a greater, although non-statistically significant proportion of myelinated white matter area than time-matched WT controls [EAE CKO 5 days (89.91%) versus EAE WT 5 days (77.85%), P > 0.05] and a significantly greater proportion of FM-positive area than EAE WT mice at 28 days post-induction [EAE CKO 5 days (89.91%) versus EAE WT Day 28 post-induction (69.35%), P = 0.0015]. At the chronic stage of disease, EAE CKO mice showed a significantly larger proportion of myelinated white matter area than time-matched WT controls [EAE WT Day 28 post-induction (69.35%) versus EAE CKO Day 28 post-induction (91.2%), P = 0.0007]. Scale bar: 400 µm. (C and D) Number of NeuN+ neurons/mm2 within the ventral grey matter of the lumbar spinal cord was, on average, higher in EAE CKO mice than in EAE WT controls and significantly in EAE CKO mice at Day 28 post-induction compared with time-matched controls (average values for HC (207.5), EAE WT 5 days from disease onset (127.1) EAE CKO 5 days from disease onset (167.1), EAE WT Day 28 post induction (139.3), EAE CKO Day 28 post induction (204.6); HC versus EAE WT 5 days: P < 0.0001, HC versus EAE CKO Day 5: P = 0.04, HC versus WT Day 28: P = 0.0002, EAE WT 5 days versus EAE CKO Day 28: P = 0.0001, EAE WT Day 28 versus EAE CKO Day 28: P = 0.0005). Scale bar: 100 µm. (E and F) GFAP-positive (purple, marker of astrocytes) pixel sum/µm2 of the lumbar anterolateral white matter tracts was quantified as a proxy for astrogliosis. GFAP levels were similar between HCs and mice with EAE at Day 5 from disease onset and significantly increased in EAE WT mice at Day 28 post-immunization (average values for HC (33.55), EAE WT 5 days from disease onset (35.73), EAE CKO 5 days from disease onset (40.02), EAE WT Day 28 post induction (64.83), EAE CKO Day 28 post induction (54.72); HC versus EAE WT Day 28: P = 0.002, EAE WT 5 days versus EAE WT Day 28: P = 0.009, EAE WT Day 5 versus EAE WT Day 28: P = 0.03). EAE CKO mice at Day 28 post-induction showed a decreased trend of GFAP immunoreactivity compared with time-matched WT controls. Scale bar: 100 µm. (B, D and E) HC n = 6 animals, EAE WT 5 days from disease onset n = 5, EAE CKO 5 days from disease onset n = 5, EAE WT Day 28 post-induction n = 6, EAE CKO Day 28 post-induction n = 5 for B, n = 6 for D and E; one-way ANOVA with Tukey’s multiple comparison test. At least three (from three to six) sections from each animal were analysed.

References

    1. Frischer JM, Weigand SD, Guo Y, et al. Clinical and pathological insights into the dynamic nature of the white matter multiple sclerosis plaque. Ann Neurol. 2015;78(5):710–721. - PMC - PubMed
    1. Lassmann H. Pathogenic mechanisms associated with different clinical courses of multiple sclerosis. Front Immunol. 2018;9:3116. - PMC - PubMed
    1. Abbott NJ, Rönnbäck L, Hansson E. Astrocyte–endothelial interactions at the blood–brain barrier. Nat Rev Neurosci. 2006;7(1):41–53. - PubMed
    1. Engelhardt B, Ransohoff RM. Capture, crawl, cross: The T cell code to breach the blood–brain barriers. Trends Immunol. 2012;33(12):579–589. - PubMed
    1. Schläger C, Körner H, Krueger M, et al. Effector T-cell trafficking between the leptomeninges and the cerebrospinal fluid. Nature. 2016;530(7590):349–353. - PubMed

LinkOut - more resources