Predicting Viable Skin Concentration: Modelling the Subpapillary Plexus
- PMID: 35266087
- PMCID: PMC9090854
- DOI: 10.1007/s11095-022-03215-z
Predicting Viable Skin Concentration: Modelling the Subpapillary Plexus
Abstract
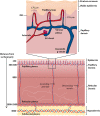
The skin concentration of a substance after a topical application or exposure determines both local treatment outcomes and the dermal toxicity assessment of various products. However, quantifying the time course of those concentrations at skin effect sites, such as the viable epidermal, superficial dermis and appendages in humans is especially problematic in vivo, making physiologically based mathematical modelling an essential tool to meet this need. This work further develops our published physiologically based pharmacokinetic and COMSOL based dermal transport modelling by considering the impact of the superficial subpapillary dermal plexus, which we represent as two well stirred compartments. The work also studied the impact on dermal concentrations of subpapillary plexus size, depth, blood velocity and density of subpapillary plexus vessels. Sensitivity analyses are used to define the most important transport determinants of skin concentrations after topical application of a substance, with previously published results used to validate the resulting analyses. This resulting model describes the available experimental data better than previous models, especially at deeper dermal depths.
Keywords: COMSOL; Computational modelling; Subpapillary plexus; Viable skin concentration.
© 2022. The Author(s).
Conflict of interest statement
The authors have no conflicts to declare.
Figures


Similar articles
-
Physiologically based mathematical modelling of solute transport within the epidermis and dermis.Int J Pharm. 2019 Oct 5;569:118547. doi: 10.1016/j.ijpharm.2019.118547. Epub 2019 Aug 1. Int J Pharm. 2019. PMID: 31377408
-
Convective transport of highly plasma protein bound drugs facilitates direct penetration into deep tissues after topical application.Br J Clin Pharmacol. 2012 Apr;73(4):564-78. doi: 10.1111/j.1365-2125.2011.04128.x. Br J Clin Pharmacol. 2012. PMID: 21999217 Free PMC article.
-
Prediction of concentration-time profile and its inter-individual variability following the dermal drug absorption.J Pharm Sci. 2012 Jul;101(7):2584-95. doi: 10.1002/jps.23155. Epub 2012 Apr 19. J Pharm Sci. 2012. PMID: 22517028
-
Mathematical and pharmacokinetic modelling of epidermal and dermal transport processes.Adv Drug Deliv Rev. 2013 Feb;65(2):169-90. doi: 10.1016/j.addr.2012.04.009. Epub 2012 May 7. Adv Drug Deliv Rev. 2013. PMID: 22575500 Review.
-
Safety assessment of Salicylic Acid, Butyloctyl Salicylate, Calcium Salicylate, C12-15 Alkyl Salicylate, Capryloyl Salicylic Acid, Hexyldodecyl Salicylate, Isocetyl Salicylate, Isodecyl Salicylate, Magnesium Salicylate, MEA-Salicylate, Ethylhexyl Salicylate, Potassium Salicylate, Methyl Salicylate, Myristyl Salicylate, Sodium Salicylate, TEA-Salicylate, and Tridecyl Salicylate.Int J Toxicol. 2003;22 Suppl 3:1-108. Int J Toxicol. 2003. PMID: 14617432 Review.
Cited by
-
Engineered Human Tissue as A New Platform for Mosquito Bite-Site Biology Investigations.Insects. 2023 Jun 2;14(6):514. doi: 10.3390/insects14060514. Insects. 2023. PMID: 37367330 Free PMC article.
-
Use of nailfold capillaroscopy for the assessment of patients undergoing digit replantation and revascularization.Jt Dis Relat Surg. 2025 Jan 2;36(1):65-77. doi: 10.52312/jdrs.2025.1900. Epub 2024 Oct 18. Jt Dis Relat Surg. 2025. PMID: 39719903 Free PMC article.
-
Predicting Human Dermal Drug Concentrations Using PBPK Modeling and Simulation: Clobetasol Propionate Case Study.AAPS PharmSciTech. 2024 Feb 17;25(3):39. doi: 10.1208/s12249-024-02740-x. AAPS PharmSciTech. 2024. PMID: 38366149
-
Mathematical modelling of hollow microneedle-mediated transdermal drug delivery.Drug Deliv Transl Res. 2025 Sep;15(9):3226-3251. doi: 10.1007/s13346-025-01801-3. Epub 2025 Feb 6. Drug Deliv Transl Res. 2025. PMID: 39913061 Free PMC article.
-
Multiphysics Simulation in Drug Development and Delivery.Pharm Res. 2023 Feb;40(2):611-613. doi: 10.1007/s11095-022-03330-x. Epub 2022 Jul 7. Pharm Res. 2023. PMID: 35794396 Free PMC article. No abstract available.
References
-
- Calcutt JJ, Anissimov YG. Physiologically based mathematical modelling of solute transport within the epidermis and dermis. Int J Pharm. 2019;569. - PubMed
MeSH terms
Grants and funding
LinkOut - more resources
Full Text Sources

