

Trends in Illness Severity, Hospitalization, and Mortality for Community-Onset Pneumonia at 118 US Veterans Affairs Medical Centers
- PMID: 35266121
- PMCID: PMC8906522
- DOI: 10.1007/s11606-022-07413-8
Trends in Illness Severity, Hospitalization, and Mortality for Community-Onset Pneumonia at 118 US Veterans Affairs Medical Centers
Abstract
Background: Deaths from pneumonia were decreasing globally prior to the COVID-19 pandemic, but it is unclear whether this was due to changes in patient populations, illness severity, diagnosis, hospitalization thresholds, or treatment. Using clinical data from the electronic health record among a national cohort of patients initially diagnosed with pneumonia, we examined temporal trends in severity of illness, hospitalization, and short- and long-term deaths.
Design: Retrospective cohort PARTICIPANTS: All patients >18 years presenting to emergency departments (EDs) at 118 VA Medical Centers between 1/1/2006 and 12/31/2016 with an initial clinical diagnosis of pneumonia and confirmed by chest imaging report.
Exposures: Year of encounter.
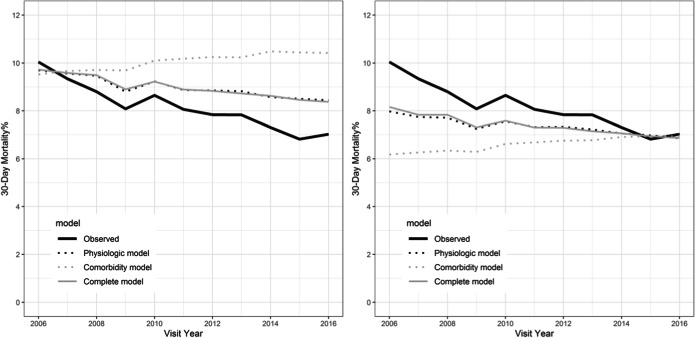
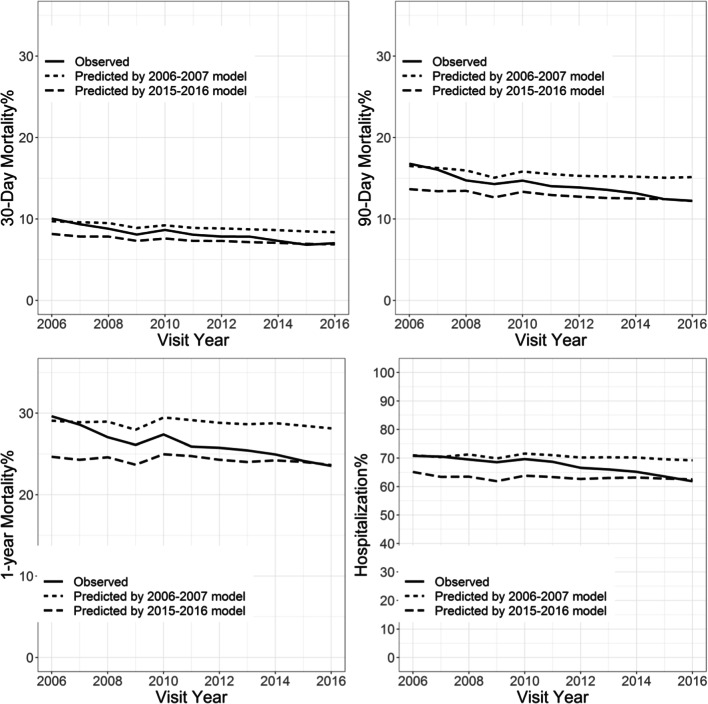
Main measures: Hospitalization and 30-day and 90-day mortality. Illness severity was defined as the probability of each outcome predicted by machine learning predictive models using age, sex, comorbidities, vital signs, and laboratory data from encounters during years 2006-2007, and similar models trained on encounters from years 2015 to 2016. We estimated the changes in hospitalizations and 30-day and 90-day mortality between the first and the last 2 years of the study period accounted for by illness severity using time covariate decompositions with model estimates.
Results: Among 196,899 encounters across the study period, hospitalization decreased from 71 to 63%, 30-day mortality 10 to 7%, 90-day mortality 16 to 12%, and 1-year mortality 29 to 24%. Comorbidity risk increased, but illness severity decreased. Decreases in illness severity accounted for 21-31% of the decrease in hospitalizations, and 45-47%, 32-24%, and 17-19% of the decrease in 30-day, 90-day, and 1-year mortality. Findings were similar among underrepresented patients and those with only hospital discharge diagnosis codes.
Conclusions: Outcomes for community-onset pneumonia have improved across the VA healthcare system after accounting for illness severity, despite an increase in cases and comorbidity burden.
Keywords: emergency department; hospitalization; outcomes; pneumonia; trends.
© 2022. This is a U.S. government work and not under copyright protection in the U.S.; foreign copyright protection may apply.
Conflict of interest statement
The authors have no conflicts of interest to disclose.
Figures

References
-
- Centers For Disease Control And Prevention, National Center For Health Statistics. Underlying Cause Of Death 1999-2015 On Cdc Wonder Online Database, Released December, 2016. Data Are From The Multiple Cause Of Death Files, 1999-2015, As Compiled From Data Provided By The 57 Vital Statistics Jurisdictions Through The Vital Statistics Cooperative Program. Accessed At http://Wonder.Cdc.Gov/Ucd-Icd10.html On Oct 23, 2017 1:06:11 Am.
Publication types
MeSH terms
Grants and funding
LinkOut - more resources
Full Text Sources
Medical
