Review
. 2022 Jun 1;43(8):2693-2706.
doi: 10.1002/hbm.25801. Epub 2022 Mar 9.

Monofractal analysis of functional magnetic resonance imaging: An introductory review

Affiliations
Review

Monofractal analysis of functional magnetic resonance imaging: An introductory review

Olivia Lauren Campbell et al. Hum Brain Mapp. .

Abstract

The following review will aid readers in providing an overview of scale-free dynamics and monofractal analysis, as well as its applications and potential in functional magnetic resonance imaging (fMRI) neuroscience and clinical research. Like natural phenomena such as the growth of a tree or crashing ocean waves, the brain expresses scale-invariant, or fractal, patterns in neural signals that can be measured. While neural phenomena may represent both monofractal and multifractal processes and can be quantified with many different interrelated parameters, this review will focus on monofractal analysis using the Hurst exponent (H). Monofractal analysis of fMRI data is an advanced analysis technique that measures the complexity of brain signaling by quantifying its degree of scale-invariance. As such, the H value of the blood oxygenation level-dependent (BOLD) signal specifies how the degree of correlation in the signal may mediate brain functions. This review presents a brief overview of the theory of fMRI monofractal analysis followed by notable findings in the field. Through highlighting the advantages and challenges of the technique, the article provides insight into how to best conduct fMRI fractal analysis and properly interpret the findings with physiological relevance. Furthermore, we identify the future directions necessary for its progression towards impactful functional neuroscience discoveries and widespread clinical use. Ultimately, this presenting review aims to build a foundation of knowledge among readers to facilitate greater understanding, discussion, and use of this unique yet powerful imaging analysis technique.

Keywords: Hurst exponent; complexity; fractal analysis; functional magnetic resonance imaging; neuroimaging; scale-free dynamics.


Conflict of interest statement

There are no conflicts of interest to disclose.

Figures
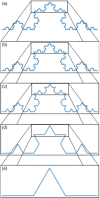
FIGURE 1
FIGURE 1
Self‐similarity demonstrated on an exact geometrical fractal. The generation rule of the Koch curve (e) is repeatedly applied to the straight lines of the object to create an ideal fractal structure (d‐a). Self‐similarity can be observed, for example, in comparing (a) and (b), where the pattern is observed independent of the scale at which it is viewed. If a portion of (a) is magnified, it resembles the whole of (b)
FIGURE 2
FIGURE 2
fGn and fBm signals and their power spectral density plots. (a) Sample fGn (top) and fBm (bottom) plots, illustrating the stationary versus nonstationary nature of each. Each plot is 1,024 time‐points, has a Hurst value of 0.75, and was created using the Davies Harte method (Davies & Harte, 1987) (using https://pypi.org/project/fbm/). (b) Power spectral density log–log plots of the above signals were generated using Welch's method using β = 0.49 for the fGn signal and 2.4 for the fBm signal. Applying the extended H (H′) concept (Eke et al., ; Hartmann et al., 2013), the relation H′ = ([β + 1]/2) yielded H′ values of 0.75 and 1.75 for the fGn and fBm signals, respectively
FIGURE 3
FIGURE 3
BOLD signal dynamics in the human brain. An axial slice from a healthy volunteer subject (36 year old male) scanned at rest with a 3T scanner (GE Discovery 750). The scan acquired 990 time‐points with a TR of 0.6 s corresponding to a sampling frequency of 1.66 Hz with a resolution of 3 × 3 × 3 mm3. Illustrative BOLD time series and their PSDs are shown for the CSF (top left), gray matter (bottom left), and white matter (right). Note the multimodal pattern in the cortical gray matter region, which is consistent with the findings of Nagy et al. (2017) and Herman et al. (2011). Herman et al. (2011) used high‐definition 11.4T/5 Hz fMRI data acquisition in an anesthetized rodent model to demonstrate that BOLD dynamics were multimodal in the cortical areas. β was calculated by the Welch's method and converted to extended H according to Eke et al. (2000) and Hartmann et al. (2013) by H′ = ([β + 1] / 2). The respective values of β and H′ were 1.35 and 1.175 in gray matter, 0.2 and 0.6 in white matter, and 0.08 and 0.54 in CSF, respectively
FIGURE 4
FIGURE 4
Overview of neurological findings and H. A diagram consolidating the current findings and their H values. Studies appear to agree that white matter, task novelty, schizophrenia, and so on generally have lower‐H values, while gray matter, mTBI, rest, and so on are associated with higher values. In the middle, we have placed ASD, as there have been conflicting results in these studies. ASD = autism spectrum disorder; mTBI = mild traumatic brain injury; DMN = default mode network
FIGURE 5
FIGURE 5
Effects on H with and without preprocessing. All images are sample sagittal, coronal, and axial slices of a healthy human subject at rest using a 7T scanner with 900 time‐points, TR of 1 s, and resolution of 1.6 × 1.6 × 1.6 mm3. Welch's method was used to calculate β. Extended H values (H′) were calculated as H′ = ([β + 1]/2) according to Eke et al. (2000) and Hartmann et al. (2013). (a) H′ values in the brain with no preprocessing steps taken; (b) H′ values in the brain after performing motion correction using rigid registration, 100 s high pass filter cutoff, 5 mm full width at half maximum spatial smoothing, and variance‐normalized; (c) H′ values in the brain after extraction of non‐brain signal components using independent component analysis, such as cardiac, respiratory, white matter, motion, and scanner artifacts. As can be seen, exclusion of influences extrinsic to the voxel‐wise BOLD signals by various preprocessing steps improves tissue contrast with gray matter having H′ values exceeding 1 and white matter with H′ values closer to 0.5. This figure demonstrates that H′ values exceeding 1 are realistic for the cortical and some sub‐cortical gray matter regions indicating the presence of fBm‐type dynamics. fMRI data come from the Human Connectome Project (Young Adult cohort; HCPS1200 release https://www.humanconnectome.org/; voxel location: 64, 64, and 41, s3://hcp‐openaccess/HCP_1200/102311/unprocessed/7T/rfMRI_REST1_PA/), and H maps were produced by the authors

References

    1. Afshinpour, B. , Hossein‐Zadeh, G.‐A. , & Soltanian‐Zadeh, H. (2008). Nonparametric trend estimation in the presence of fractal noise: Application to fMRI time‐series analysis. Journal of Neuroscience Methods, 171(2), 340–348. 10.1016/j.jneumeth.2008.03.017 - DOI - PubMed
    1. Akhrif, A. , Romanos, M. , Domschke, K. , Schmitt‐Boehrer, A. , & Neufang, S. (2018). Fractal analysis of BOLD time series in a network associated with waiting impulsivity. Frontiers in Physiology, 9. 10.3389/fphys.2018.01378 - DOI
    1. Anticevic, A. , Cole, M. W. , Murray, J. D. , Corlett, P. R. , Wang, X.‐J. , & Krystal, J. H. (2012). The role of default network deactivation in cognition and disease. Trends in Cognitive Sciences, 16(12), 584–592. 10.1016/j.tics.2012.10.008 - DOI - PMC - PubMed
    1. Barnes, A. , Bullmore, E. T. , & Suckling, J. (2009). Endogenous human brain dynamics recover slowly following cognitive effort. PLoS ONE, 4(8), e6626. 10.1371/journal.pone.0006626 - DOI - PMC - PubMed
    1. Bédard, C. , & Destexhe, A. (2009). Macroscopic models of local field potentials and the apparent 1/f noise in brain activity. Biophysical Journal, 96(7), 2589–2603. 10.1016/j.bpj.2008.12.3951 - DOI - PMC - PubMed

Publication types