. 2022 Jul;20(7):1274-1284.
doi: 10.1111/pbi.13805. Epub 2022 Mar 22.

Increasing floral visitation and hybrid seed production mediated by beauty mark in Gossypium hirsutum

Affiliations

Increasing floral visitation and hybrid seed production mediated by beauty mark in Gossypium hirsutum

Muhammad Ali Abid et al. Plant Biotechnol J. 2022 Jul.

Abstract

Hybrid crop varieties have been repeatedly demonstrated to produce significantly higher yields than their parental lines; however, the low efficiency and high cost of hybrid seed production has limited the broad exploitation of heterosis for cotton production. One option for increasing the yield of hybrid seed is to improve pollination efficiency by insect pollinators. Here, we report the molecular cloning and characterization of a semidominant gene, Beauty Mark (BM), which controls purple spot formation at the base of flower petals in the cultivated tetraploid cotton species Gossypium barbadense. BM encodes an R2R3 MYB113 transcription factor, and we demonstrate that GbBM directly targets the promoter of four flavonoid biosynthesis genes to positively regulate petal spot development. Introgression of a GbBM allele into G. hirsutum by marker-assisted selection restored petal spot formation, which significantly increased the frequency of honeybee visits in G. hirsutum. Moreover, field tests confirmed that cotton seed yield was significantly improved in a three-line hybrid production system that incorporated the GbBM allele. Our study thus provides a basis for the potentially broad application of this gene in improving the long-standing problem of low seed production in elite cotton hybrid lines.

Keywords: Gossypium barbadense; Gossypium hirsutum; Beauty Mark; MYB; hybrid seed yield.


Conflict of interest statement

The authors declare no competing interests.

Figures
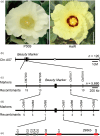
Figure 1
Figure 1
Cloning of the GbBM gene. (a) The flower “beauty mark” phenotypes of the P30B and HaiR lines. Scale bars, 1 cm. (b) Location of GbBM on Gossypium barbadense chromosome A07. (c) Coarse linkage map of GbBM. The number of recombinants in the F2 population derived by HaiR and P30B between the marker and GbBM is indicated. (d) High‐resolution linkage map of GbBM. (e) Annotation of the candidate region surrounding GbBM on G. barbadense chromosome A07 Arrows indicate putative genes the in the G. barbadense reference assembly. The red arrows represent three R2R3 MYB transcription factor genes.
Figure 2
Figure 2
Expression pattern of GbBM gene and Phylogenetic analysis of the GbBM protein. (a) GbBM expression profile in various tissues. R, root; GS, green stem; RS, red stem; GL, green leaf; RL, red leaf under normal condition; FRL, frosted red leaf; WPBP, white petal before pollination; RPAP, red petal after pollination; BSR, bud spotted region of HaiR; BSP, bud‐spotted region of P30B. Bars are the mean SD of three biological replicates. (b) Subcellular localization of 35S::GbBM‐GFP (upper panel) and 35S::GFP (lower panel) in Arabidopsis protoplasts. Scale bars, 10 μm. (c) Phylogenetic analysis of GbBM (marked with red) and other MYBs using R2R3 MYB domains. Subgroup (S) names are indicated on the right, and the subgroups are colored.
Figure 3
Figure 3
The phenotype of GbBM CRISPR/Cas9 lines. (a) Editing of the GbBM locus using CRISPR/Cas9 with two independent single‐guide RNAs (sgRNA1 for an inactivating insertion and sgRNA2 for an inactivating deletion). The sgRNA target sites and a protospacer‐adjacent motifs (PAM) are indicated in green and in blue, respectively. Insertions and deletions are indicated in red or by dashes, respectively. (b) Beauty mark flower phenotypes in wild type, B‐cr1, and B‐cr2 plants. Scale bars, 1.5 cm.
Figure 4
Figure 4
Natural variations at the coding sequence of GhBM. (a) Mapping of allelic variation to the G. hirsutum GhBM protein sequence. (b) The relative firefly/Renilla luciferase values of GhBM and GbBM promoter fragments in Arabidopsis protoplasts. The empty vector control is included as GAL4‐fLUC. Bars represent mean ± s.d. (n = 3 biologically independent replicates). (c) Constructs used for GhBM and GbBM transcriptional activity assays as shown in (d); VP16 was used as a positive control. TATA, TATA box for DNA binding. fLUC, firefly luciferase. REN, Renilla luciferase. NOS, nopaline synthase terminator. (d) Transient transcriptional activity analysis in Arabidopsis protoplasts illustrating the transcriptional activity of GhBM and GbBM. The relative luciferase activities were calculated by normalizing the LUC values against Renilla. The data in c and e were analyzed by ANOVA one‐way comparison followed by LSD test. Different letters above the bars indicate a significant difference at P < 0.05.
Figure 5
Figure 5
Anthocyanin and flavones content in P30B and NIL plants. (a) Gross morphologies of P30B and NIL plants at flowering stage. Scale bar, 1.5 cm. (b) Relative expression of GbBM gene in flower beauty mark and nonbeauty mark regions of P30B and NIL. B, bud stage. C, candle stage. F, flowering stage. The transcript levels are expressed relative to that of cotton Actin1 in each sample and Bars represent means SD of three biological replicates. (c) Statistical analysis of area of beauty mark of P30B and NIL lines. Data are means SD (n = 10 flower petals). P values are based on two‐tailed, two‐sample t tests. (d). HPLC chromatograms and characteristic absorbance spectra of the extracted anthocyanin from the beauty mark region of P30B and NIL. Peaks for cyanidin, delphinidin, and petunidin were marked. mAU, milli‐absorbance unit. (e) Contents of cyanidin, delphinidin, and petunidin in beauty mark regions of the P30B and NIL. FW, fresh weight. Bars represents means SD of three biological replicates. (f) Contents of quercetin and kaempferol in nonbeauty mark regions of the P30B and NIL. FW, fresh weight. Bars represents means SD of three biological replicates. P values are based on two‐tailed, two‐sample t tests
Figure 6
Figure 6
Genes of anthocyanin and flavone pathway enzymes and their expressions. (a) Genes of the enzymes catalyzing the defined steps in anthocyanin and flavones and their homologs are indicated. The transcripts levels are shown by heatmap, estimated using Cuffdiff by computing the fragment per kilobase of transcript per million reads sequence (FPKM) value for each transcript. PAL, phenylalanine ammonia lyase; C4H, cinnamate‐4‐hydroxylase; 4CL, 4‐coumarate‐coA ligase; CHS, chalcone synthase; CHI, chalcone‐flavonone isomerase; F3H, flavanone 3ß‐hydroxylase; F3’H, flavonoid 3’‐momooxygenase; F3’5’H, flavonoid 3’‐momooxygenase; FLS, flavonol synthase/flavanone 3‐hydroxylase; DFR, dihydroflavomol‐4‐reductase; ANS, anthocyanidin synthase; UFGT, UDP‐glycose flavonoid glycosyltransferase. Distributions of genes in the G. barbadense genome are indicated by their accession numbers. (b) Analysis of gene expression in anthocyanin and flavones pathway by qRT‐PCR. Bars represent means SD of three technical replicates. P values are based on two‐tailed, two‐sample t tests
Figure 7
Figure 7
GbBM directly activates the expression of anthocyanin and flavone biosynthesis genes in G. barbadense. (a) AD‐GbBM activates the expression of the lacZ reporter genes driven by the promoters of Gb4CL, GbCHS, GbCHI, GbF3H, GbFLS, GbDFR, GbANS, GbUFGT, and GbPAL in yeast. Representative data are shown from one of three biological replicates, which yielded similar results. (b–e) ChIP assays indicating the association of GbBM with several regions in the promoters of GbCHS (b), GbFLS (c), GbDFR (d), and GbANS (e). The regions tested by ChIP assays are shown in the schematic representation. The putative MYB‐core elements are indicated by black lines, respectively. The promoter of GbActin1 was used for normalization. Bars represent means SD of three biological replicates. P values are based on two‐tailed, two‐sample t tests.
Figure 8
Figure 8
Reshaping of flower beauty mark contributes to honeybee visiting frequency reinforcement and increases hybrid seed yield in G. hirsutum. (a) Average honeybees visit number for a flower per day was evaluated using honeybees in an experimental greenhouse. Value is mean SD of ten days. (b–d) Agronomic traits of P30A and P30A GbBM after crossing with Y18R by honeybee‐mediated pollination. Hybrid seed yield per plot (b) (n = 4 plots), boll numbers (c) (n = 50 plants), and unginned cotton yield per plant (d) (n = 50 plants) of P30A and P30A GbBM . In a–d, P values are based on two‐tailed, two‐sample t tests

References

    1. Chen, Y. , Rivlin, A. , Lange, A. , Ye, X. , Vaghchhipawala, Z. , Eisinger, E. , Dersch, E. et al. (2014) High throughput Agrobacterium tumefaciens‐mediated germline transformation of mechanically isolated meristem explants of cotton (Gossypium hirsutum L.). Plant Cell Rep. 33, 153–164. - PubMed
    1. Dai, J. and Dong, H. (2014) Intensive cotton farming technologies in China: achievements, challenges and countermeasures. Field Crops Res. 155, 99–110.
    1. Dell'Olivo, A. and Kuhlemeier, C. (2013) Asymmetric effects of loss and gain of a floral trait on pollinator preference. Evolution, 67, 3023–3031. - PubMed
    1. Dubos, C. , Stracke, R. , Grotewold, E. , Weisshaar, B. , Martin, C. and Lepiniec, L. (2010) MYB transcription factors in Arabidopsis . Trends Plant Sci. 15, 573–581. - PubMed
    1. Eaton, F.M. (1955) Physiology of the cotton plant. Annu. Rev. Plant Physiol. 6, 299–328.

Publication types

LinkOut - more resources