

doi: 10.1111/ajt.16981.
OPTN/SRTR 2020 Annual Data Report: COVID
Affiliations
- PMID: 35266617
- PMCID: PMC9111379
- DOI: 10.1111/ajt.16981
Item in Clipboard
OPTN/SRTR 2020 Annual Data Report: COVID
Am J Transplant.
2022 Mar.
No abstract available
Figures

Number of prevalent kidney candidates. Month 0 begins March 13, 2020, the date of declaration of the National Emergency. Candidates listed at multiple centers are counted once per listing. Includes active and inactive candidates on the list any time during the month.

Number of new kidney candidates. Month 0 begins March 13, 2020, the date of declaration of the National Emergency. A new candidate is one who first joined the list during the given month, without having been listed in a previous month.

Deceased donor kidney transplant rate. Month 0 begins March 13, 2020, the date of declaration of the National Emergency. Transplant rates are computed as the number of deceased donor transplants per 100 patient-years of waiting in a given month. Individual listings are counted separately.

Living donor kidney transplant rate. Month 0 begins March 13, 2020, the date of declaration of the National Emergency. Transplant rates are computed as the number of living donor transplants per 100 patient-years of waiting in a given month. Individual listings are counted separately.

Number of kidney offers. Month 0 begins March 13, 2020, the date of declaration of the National Emergency.

Kidney offer acceptance rate. Month 0 begins March 13, 2020, the date of declaration of the National Emergency.
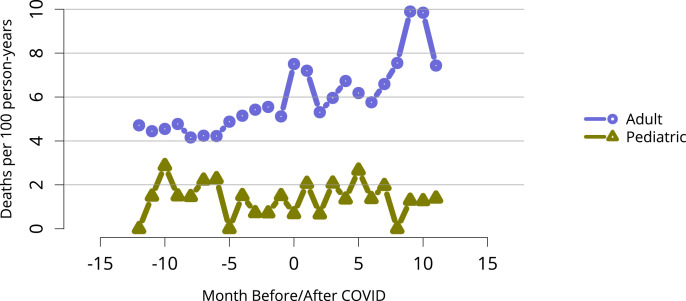
Kidney waiting list mortality rate. Month 0 begins March 13, 2020, the date of declaration of the National Emergency. Mortality rates are computed as the number of deaths per 100 patient-years of waiting in the given year. Waiting time is censored at transplant, death, transfer to another program, removal because of improved condition, or end of cohort. Individual listings are counted separately.

Kidney all-cause graft failure. Month 0 begins March 13, 2020, the date of declaration of the National Emergency.

Difference in risk adjusted kidney waiting list mortality hazard ratio before to after COVID-19 by OPO. Waiting list mortality hazard ratio is the difference in the OPO’s hazard ratio compared to the nation as a whole in the 12 months after the onset of the COVID-19 pandemic as compared to the 12 months before the onset of the pandemic. Waiting time is censored at transplant, death, transfer to another program, removal because of improved condition, or end of cohort. Individual listings are counted separately.

Difference in risk adjusted kidney transplant rate before to after COVID-19 by OPO. Transplant rate ratio is the difference in the OPO’s rate ratio compared to the nation as a whole in the 12 months after the onset of the COVID-19 pandemic as compared to the 12 months before the onset of the pandemic. Individual listings are counted separately.

Difference in risk adjusted kidney all-cause graft failure hazard ratio before to after COVID-19 by OPO. Graft failure hazard ratio is the difference in the OPO’s hazard ratio compared to the nation as a whole in the 12 months after the onset of the COVID-19 pandemic as compared to the 12 months before the onset of the pandemic.

Number of prevalent pancreas candidates. Month 0 begins March 13, 2020, the date of declaration of the National Emergency. Candidates listed at multiple centers are counted once per listing. Includes active and inactive candidates on the list any time during the month.

Number of new pancreas candidates. Month 0 begins March 13, 2020, the date of declaration of the National Emergency. A new candidate is one who first joined the list during the given month, without having been listed in a previous month.

Deceased donor pancreas transplant rate. Month 0 begins March 13, 2020, the date of declaration of the National Emergency. Transplant rates are computed as the number of deceased donor transplants per 100 patient-years of waiting in a given month. Individual listings are counted separately.

Pancreas waiting list mortality rate. Month 0 begins March 13, 2020, the date of declaration of the National Emergency. Mortality rates are computed as the number of deaths per 100 patient-years of waiting in the given year. Waiting time is censored at transplant, death, transfer to another program, removal because of improved condition, or end of cohort. Individual listings are counted separately.

Pancreas all-cause graft failure. Month 0 begins March 13, 2020, the date of declaration of the National Emergency.

Difference in risk adjusted pancreas waiting list mortality hazard ratio before to after COVID-19 by OPO. Waiting list mortality hazard ratio is the difference in the OPO’s hazard ratio compared to the nation as a whole in the 12 months after the onset of the COVID-19 pandemic as compared to the 12 months before the onset of the pandemic. Waiting time is censored at transplant, death, transfer to another program, removal because of improved condition, or end of cohort. Individual listings are counted separately.

Difference in risk adjusted pancreas transplant rate before to after COVID-19 by OPO. Transplant rate ratio is the difference in the OPO’s rate ratio compared to the nation as a whole in the 12 months after the onset of the COVID-19 pandemic as compared to the 12 months before the onset of the pandemic. Individual listings are counted separately.

Difference in risk adjusted pancreas all-cause graft failure hazard ratio before to after COVID-19 by OPO. Graft failure hazard ratio is the difference in the OPO’s hazard ratio compared to the nation as a whole in the 12 months after the onset of the COVID-19 pandemic as compared to the 12 months before the onset of the pandemic.

Number of prevalent liver candidates. Month 0 begins March 13, 2020, the date of declaration of the National Emergency. Candidates listed at multiple centers are counted once per listing. Includes active and inactive candidates on the list any time during the month.

Number of new liver candidates. Month 0 begins March 13, 2020, the date of declaration of the National Emergency. A new candidate is one who first joined the list during the given month, without having been listed in a previous month.

Deceased donor liver transplant rate. Month 0 begins March 13, 2020, the date of declaration of the National Emergency. Transplant rates are computed as the number of deceased donor transplants per 100 patient-years of waiting in a given month. Individual listings are counted separately.

Living donor liver transplant rate. Month 0 begins March 13, 2020, the date of declaration of the National Emergency. Transplant rates are computed as the number of living donor transplants per 100 patient-years of waiting in a given month. Individual listings are counted separately.

Number of liver offers. Month 0 begins March 13, 2020, the date of declaration of the National Emergency.

Liver offer acceptance rate. Month 0 begins March 13, 2020, the date of declaration of the National Emergency.

Liver waiting list mortality rate. Month 0 begins March 13, 2020, the date of declaration of the National Emergency. Mortality rates are computed as the number of deaths per 100 patient-years of waiting in the given year. Waiting time is censored at transplant, death, transfer to another program, removal because of improved condition, or end of cohort. Individual listings are counted separately.

Liver all-cause graft failure. Month 0 begins March 13, 2020, the date of declaration of the National Emergency.

Difference in risk adjusted liver waiting list mortality hazard ratio before to after COVID-19 by OPO. Waiting list mortality hazard ratio is the difference in the OPO’s hazard ratio compared to the nation as a whole in the 12 months after the onset of the COVID-19 pandemic as compared to the 12 months before the onset of the pandemic. Waiting time is censored at transplant, death, transfer to another program, removal because of improved condition, or end of cohort. Individual listings are counted separately.

Difference in risk adjusted liver transplant rate before to after COVID-19 by OPO. Transplant rate ratio is the difference in the OPO’s rate ratio compared to the nation as a whole in the 12 months after the onset of the COVID-19 pandemic as compared to the 12 months before the onset of the pandemic. Individual listings are counted separately.

Difference in risk adjusted liver all-cause graft failure hazard ratio before to after COVID-19 by OPO. Graft failure hazard ratio is the difference in the OPO’s hazard ratio compared to the nation as a whole in the 12 months after the onset of the COVID-19 pandemic as compared to the 12 months before the onset of the pandemic.

Number of prevalent intestine candidates. Month 0 begins March 13, 2020, the date of declaration of the National Emergency. Candidates listed at multiple centers are counted once per listing. Includes active and inactive candidates on the list any time during the month.

Number of new intestine candidates. Month 0 begins March 13, 2020, the date of declaration of the National Emergency. A new candidate is one who first joined the list during the given month, without having been listed in a previous month.

Deceased donor intestine transplant rate. Month 0 begins March 13, 2020, the date of declaration of the National Emergency. Transplant rates are computed as the number of deceased donor transplants per 100 patient-years of waiting in a given month. Individual listings are counted separately.

Intestine waiting list mortality rate. Month 0 begins March 13, 2020, the date of declaration of the National Emergency. Mortality rates are computed as the number of deaths per 100 patient-years of waiting in the given year. Waiting time is censored at transplant, death, transfer to another program, removal because of improved condition, or end of cohort. Individual listings are counted separately.

Intestine all-cause graft failure. Month 0 begins March 13, 2020, the date of declaration of the National Emergency.

Difference in risk adjusted intestine transplant rate before to after COVID-19 by OPO. Transplant rate ratio is the difference in the OPO’s rate ratio compared to the nation as a whole in the 12 months after the onset of the COVID-19 pandemic as compared to the 12 months before the onset of the pandemic. Individual listings are counted separately.

Difference in risk adjusted intestine all-cause graft failure hazard ratio before to after COVID-19 by OPO. Graft failure hazard ratio is the difference in the OPO’s hazard ratio compared to the nation as a whole in the 12 months after the onset of the COVID-19 pandemic as compared to the 12 months before the onset of the pandemic.

Number of prevalent heart candidates. Month 0 begins March 13, 2020, the date of declaration of the National Emergency. Candidates listed at multiple centers are counted once per listing. Includes active and inactive candidates on the list any time during the month.

Number of new heart candidates. Month 0 begins March 13, 2020, the date of declaration of the National Emergency. A new candidate is one who first joined the list during the given month, without having been listed in a previous month.

Deceased donor heart transplant rate. Month 0 begins March 13, 2020, the date of declaration of the National Emergency. Transplant rates are computed as the number of deceased donor transplants per 100 patient-years of waiting in a given month. Individual listings are counted separately.

Number of heart offers. Month 0 begins March 13, 2020, the date of declaration of the National Emergency.

Heart offer acceptance rate. Month 0 begins March 13, 2020, the date of declaration of the National Emergency.

Heart waiting list mortality rate. Month 0 begins March 13, 2020, the date of declaration of the National Emergency. Mortality rates are computed as the number of deaths per 100 patient-years of waiting in the given year. Waiting time is censored at transplant, death, transfer to another program, removal because of improved condition, or end of cohort. Individual listings are counted separately.

Heart all-cause graft failure. Month 0 begins March 13, 2020, the date of declaration of the National Emergency.

Difference in risk adjusted heart waiting list mortality hazard ratio before to after COVID-19 by OPO. Waiting list mortality hazard ratio is the difference in the OPO’s hazard ratio compared to the nation as a whole in the 12 months after the onset of the COVID-19 pandemic as compared to the 12 months before the onset of the pandemic. Waiting time is censored at transplant, death, transfer to another program, removal because of improved condition, or end of cohort. Individual listings are counted separately.

Difference in risk adjusted heart transplant rate before to after COVID-19 by OPO. Transplant rate ratio is the difference in the OPO’s rate ratio compared to the nation as a whole in the 12 months after the onset of the COVID-19 pandemic as compared to the 12 months before the onset of the pandemic. Individual listings are counted separately.

Difference in risk adjusted heart all-cause graft failure hazard ratio before to after COVID-19 by OPO. Graft failure hazard ratio is the difference in the OPO’s hazard ratio compared to the nation as a whole in the 12 months after the onset of the COVID-19 pandemic as compared to the 12 months before the onset of the pandemic.

Number of prevalent lung candidates. Month 0 begins March 13, 2020, the date of declaration of the National Emergency. Candidates listed at multiple centers are counted once per listing. Includes active and inactive candidates on the list any time during the month.

Number of new lung candidates. Month 0 begins March 13, 2020, the date of declaration of the National Emergency. A new candidate is one who first joined the list during the given month, without having been listed in a previous month.

Deceased donor lung transplant rate. Month 0 begins March 13, 2020, the date of declaration of the National Emergency. Transplant rates are computed as the number of deceased donor transplants per 100 patient-years of waiting in a given month. Individual listings are counted separately.

Number of lung offers. Month 0 begins March 13, 2020, the date of declaration of the National Emergency.

Lung offer acceptance rate. Month 0 begins March 13, 2020, the date of declaration of the National Emergency.

Lung waiting list mortality rate. Month 0 begins March 13, 2020, the date of declaration of the National Emergency. Mortality rates are computed as the number of deaths per 100 patient-years of waiting in the given year. Waiting time is censored at transplant, death, transfer to another program, removal because of improved condition, or end of cohort. Individual listings are counted separately.

Lung all-cause graft failure. Month 0 begins March 13, 2020, the date of declaration of the National Emergency.

Difference in risk adjusted lung waiting list mortality hazard ratio before to after COVID-19 by OPO. Waiting list mortality hazard ratio is the difference in the OPO’s hazard ratio compared to the nation as a whole in the 12 months after the onset of the COVID-19 pandemic as compared to the 12 months before the onset of the pandemic. Waiting time is censored at transplant, death, transfer to another program, removal because of improved condition, or end of cohort. Individual listings are counted separately.

Difference in risk adjusted lung transplant rate before to after COVID-19 by OPO. Transplant rate ratio is the difference in the OPO’s rate ratio compared to the nation as a whole in the 12 months after the onset of the COVID-19 pandemic as compared to the 12 months before the onset of the pandemic. Individual listings are counted separately.

Difference in risk adjusted lung all-cause graft failure hazard ratio before to after COVID-19 by OPO. Graft failure hazard ratio is the difference in the OPO’s hazard ratio compared to the nation as a whole in the 12 months after the onset of the COVID-19 pandemic as compared to the 12 months before the onset of the pandemic.

Eligible deaths referral rate. Month 0 begins March 13, 2020, the date of declaration of the National Emergency.
References
MeSH terms
LinkOut - more resources
Full Text Sources
Medical
