

Angpt2/Tie2 autostimulatory loop controls tumorigenesis
- PMID: 35266635
- PMCID: PMC9081903
- DOI: 10.15252/emmm.202114364
Angpt2/Tie2 autostimulatory loop controls tumorigenesis
Abstract
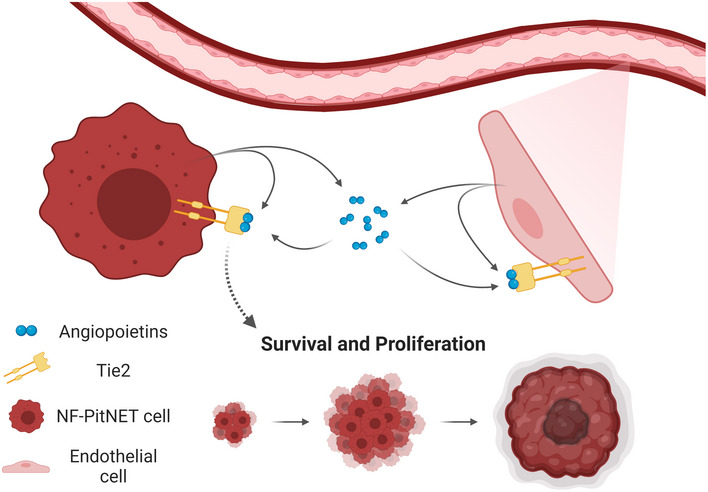
Invasive nonfunctioning (NF) pituitary neuroendocrine tumors (PitNETs) are non-resectable neoplasms associated with frequent relapses and significant comorbidities. As the current therapies of NF-PitNETs often fail, new therapeutic targets are needed. The observation that circulating angiopoietin-2 (ANGPT2) is elevated in patients with NF-PitNET and correlates with tumor aggressiveness prompted us to investigate the ANGPT2/TIE2 axis in NF-PitNETs in the GH3 PitNET cell line, primary human NF-PitNET cells, xenografts in zebrafish and mice, and in MENX rats, the only autochthonous NF-PitNET model. We show that PitNET cells express a functional TIE2 receptor and secrete bioactive ANGPT2, which promotes, besides angiogenesis, tumor cell growth in an autocrine and paracrine fashion. ANGPT2 stimulation of TIE2 in tumor cells activates downstream cell proliferation signals, as previously demonstrated in endothelial cells (ECs). Tie2 gene deletion blunts PitNETs growth in xenograft models, and pharmacological inhibition of Angpt2/Tie2 signaling antagonizes PitNETs in primary cell cultures, tumor xenografts in mice, and in MENX rats. Thus, the ANGPT2/TIE2 axis provides an exploitable therapeutic target in NF-PitNETs and possibly in other tumors expressing ANGPT2/TIE2. The ability of tumor cells to coopt angiogenic signals classically viewed as EC-specific expands our view on the microenvironmental cues that are essential for tumor progression.
Keywords: PitNETs; angiopoietin 2; anti-angiopoietin biologicals; tumor-bound Tie2; tumor/endothelial cell crosstalk.
© 2022 The Authors. Published under the terms of the CC BY 4.0 license.
Figures
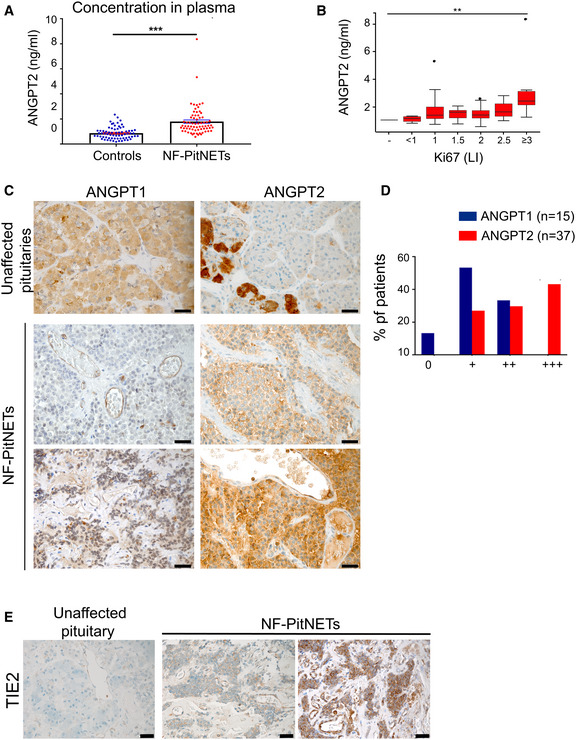
ANGPT2 plasma concentration in 69 NF‐NF‐PitNET patients and in 69 age‐ and gender‐matched healthy controls. Each dot represents one individual. Healthy controls: mean ± SEM = 0.8698 ± 0.05757; PitNET patients; mean ± SEM = 1.786 ± 0.1383; Difference between means = 0.9158 ± 0.1498; 95% confidence interval = 0.6181 to 1.213. ***P‐value < 0.0001 by unpaired t‐test with Welch’s correction.
Correlation between circulating ANGP T2 levels and Ki67 LI (i.e., % of Ki67‐positive cells). All box plots show 25th to 75th percentiles (box) and 5th to 95th percentiles (whiskers). The line in the box represents the median. Results are expressed as mean ± SEM. **P = 0.014 by one‐way ANOVA (P = 0.007 by Kruskal–Wallis test).
Expression of ANGPT1 and ANGPT2 in human unaffected anterior pituitary (control, n = 3) and in human NF‐PitNETs. Thirty‐seven human NF‐PitNETs were analyzed for ANGPT2 expression and 14 for ANGPT1. NF‐PitNET panels show representative cases. Original magnification: 400×; scale bar: 20 µm.
Summary of the IHC results for human NF‐PitNETs.
Expression of Tie2 receptor in human normal pituitary (n = 3) and human NF‐PitNET tissues (n = 10). Original magnification: 400×; scale bar: 20 µm.

qRT–PCR for Angpt1 and Angpt2 was performed on pituitary samples from tumor‐bearing MENX mutant rats (n = 10, 12, respectively) and wild‐type control rats (n = 5, 8). Data are expressed as mean ± SEM. *P = 0.049; **P = 0.008 by t‐test.
IHC was performed on pituitary tissues from wild‐type (n = 5) and MENX mutant rats (n = 10) using antibodies against Angpt1, Angpt2. Representative stainings are shown. Original magnification: 400×; scale bar: 20 µm. N, normal area; T, tumor area.
Expression of Angpt2, Tie2, and CD‐31 in rat NF‐PitNETs and associated ECs (used as positive control). Consecutive tissue sections of rat NF‐PitNETs (n = 4) were stained with the indicated antibodies. One representative tumor is shown. The dashed shape indicates the vessel present in the consecutive slides. Original magnification: 200×; scale bar: 20 µm.
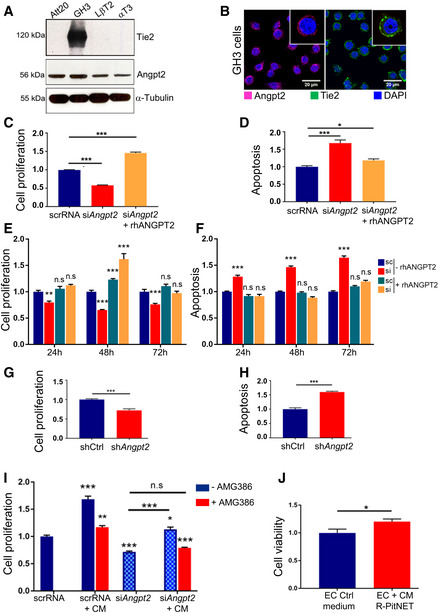
Expression of Angpt2 and Tie2 was assessed in Att20, GH3, LβT2 and αT3 cells by western blotting (WB) using specific antibodies. α‐Tubulin was included as loading control.
Immunofluorescence (IF) of GH3 cells for Angpt2 (red) and Tie2 (green). Nuclei were counterstained with DAPI (blue). Original magnification: 400x; scale bar: 20 µm. Panels shown are representative of 3 independent experiments.
Cell proliferation of GH3 cells transfected with siAngpt2 or scrRNA POOLs and incubated with rhANGPT2 (+rhANGPT2) or left untreated (−rhANGPT2) normalized against scrRNA‐transfected cells. ***P < 0.0001 (one‐way ANOVA).
In samples parallel to (C), activated caspase‐3/7 was measured to assess for apoptosis. ***P < 0.0001; *P = 0.0411 (one‐way ANOVA).
Cell proliferation of GH3 cells transfected with the individual siAngpt2 or scrRNA and incubated with rhANGPT2 (+rhANGPT2) or left untreated (−rhANGPT2) normalized against scrRNA‐transfected, untreated (scr‐rhANGPT2) cells. n.s., not significant; ***P < 0.0001; **P < 0.002 (one‐way ANOVA).
In samples parallel to (E), activated caspase‐3/7 was measured to assess for apoptosis. n.s., not significant; ***P < 0.0001 (one‐way ANOVA).
Cell proliferation of GH3‐shAngpt2 (#2) cells or cells transduced with shCtrl was measured 24h later and normalized against shCtrl. ***P < 0.0001 (t‐test).
In samples parallel to (G), activated caspase‐3/7 was measured to assess for apoptosis. ***P < 0.0001 (t‐test).
GH3 cells transfected with siAngpt2 or scrRNA POOLs were incubated with conditioned medium (CM) from rat primary PitNET cells for 24 h. CM was pre‐incubated with AMG386 (red bars), or left untreated (blue bars). Cell proliferation was measured and normalized against that of scrRNA‐transfected cells. n.s., not significant; ***P < 0.0001; **P = 0.00116; *P = 0.0192 by two‐way ANOVA.
Cell viability of isolated rat primary EC cells incubated with CM from isolated rat primary PitNET cells. The experiments was performed independently 2 times, each with 3 technical replicates. Results are expressed as mean ± SEM. *P < 0.0368 (t‐test). (C–I) Data are expressed as the mean ± SEM of three biological replicates, each with 3–6 technical replicates.
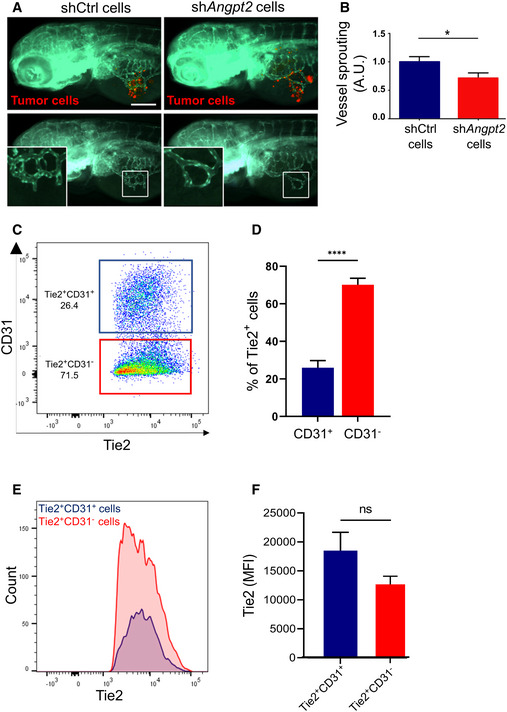
Zebrafish larvae were implanted with red fluorescence‐stained GH3 cells infected with unspecific shRNA (shCtrl) or with shAngpt2 (#2). In the bottom panels, the red channel was omitted to highlight the tumor‐induced microvascular networks. Digital magnifications of graft regions (white boxes) are shown in the bottom left panels. Scale bar: 100 µm.
Quantification of tumor‐induced vessel sprouting in zebrafish embryos engrafted with GH3 ‐shCtrl versus shC2 cells (n = 20 each). Data were normalized against the mean of the control (shCtrl) group arbitrarily set to 1. A.U. arbitrary Units; *P = 0.0319 (t‐test).
Example of flow cytometry data of primary rat pituitary cells from a tumor‐bearing MENX rat gated for cell surface Tie2 and CD31 expression (cells were pre‐gated for Tie2).
Percentage of Tie2+CD31− (PitNET cells) and Tie2+CD31+ (ECs) in the pituitary glands of 7 age‐matched (8 months) MENX rats. Data are expressed as the mean ± SEM. ****P < 0.0001 (t‐test).
A representative graph displaying the Tie2 fluorescence intensity and counts of Tie2+CD31− and Tie2+CD31− cell populations the pituitary of one rat.
Fluorescence intensities of the Tie2+CD31− and Tie2+CD31− cell populations across all 7 pituitary samples. Data are expressed as the mean ± SEM. n.s, not significant (Mann–Whitney test).
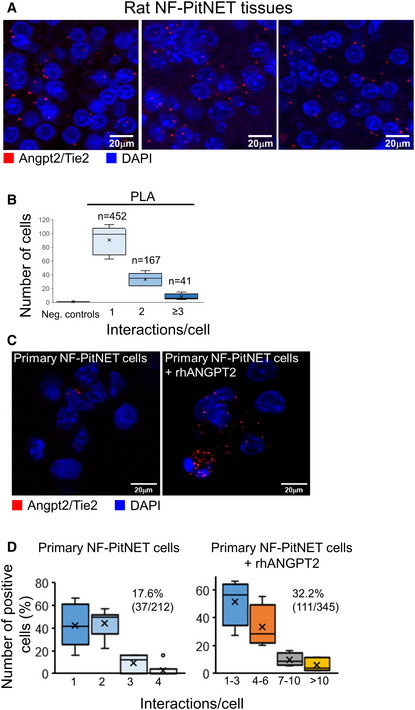
Proximity ligation assay (PLA) was performed on FFPE sections of rat PitNETs (n = 5) using antibodies against both Angpt2 and Tie2. Nuclei were counterstained with DAPI (blue). Original magnification: 400×; scale bar: 20 µm.
Quantification of the interactions between Angpt2 and Tie2 in rat PitNET tissues versus negative controls obtained using only 1 antibody (Appendix Fig S7C). Box plots show 25th to 75th percentiles (box) and 5th to 95th percentiles (whiskers). The line in the box represents the median, whereas the “x” represents the mean.
PLA was performed as in (A) on isolated rat primary NF‐PitNET stimulated with rhANGPT2.
Quantification of Angpt2/Tie2 interactions in primary NF‐PitNET incubated with/without rhANGPT2. The total number of cells counted is reported in parenthesis (i.e., 212 and 345) as well as the number of positive cells (= showing at least one interaction). The graphs show the percentage of cells having the number of interactions reported on the x axis. Box plots show 25th to 75th percentiles (box) and 5th to 95th percentiles (whiskers). The line in the box represents the median, the “x” represents the mean, and the circle outlier points.
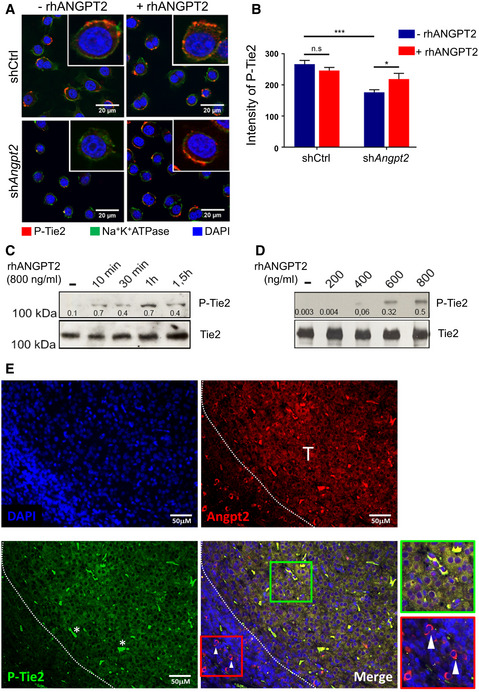
Co‐IF for both P‐Tie2 (Tyr 1102/1108; red) and for Na+K+ ATPase (green), used as plasma membrane marker, of GH3 cells transduced with unspecific shRNA (shCtrl) and shAngpt2 (#2) and incubated with rhANGPT2 or left untreated. Original magnification: 400×; scale bar: 20 μm.
Quantification of P‐Tie2 immunostaining intensity in cells shown in (A) shCtrl‐transduced GH3 cells (266.71 ± 12.12); in shAngpt2 cells (176.04 ± 8.46); in control cells treated with rhANGPT2: shCtrl + rhANGPT2: 246.33 ± 9.79 (versus shCtrl, not significant by t‐test); in treated knockdown cells: shAngpt2 + rhANGPT2: 218.68 ± 18.16 (versus shC2; *P = 0.0421 by t‐test). The experiment was performed twice each with three technical replicates. Intensities are expressed as arbitrary units ± SEM. ***P < 0.0001 by t‐test.
Tie2 and P‐Tie2 expression in serum‐starved GH3 cells transfected with siAngpt2 POOLs and stimulated with rhANGPT2 for the indicated times.
Tie2 and P‐Tie2 expression in cells as in (C) stimulated with the indicated doses of rhANGPT2 for 30 min.
Co‐IF for Angpt2 (red) and P‐Tie2 (green) of a representative rat primary NF‐PitNET. Nuclei were counterstained with DAPI. White arrows point to Angpt2‐positive (P‐Tie2 negative) cells in adjacent non‐tumor area. Scale bars: 50 µm. T, tumor area.
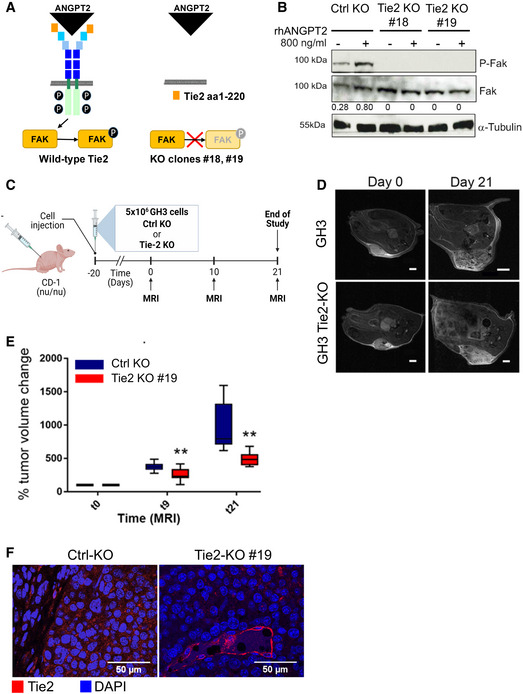
Scheme of the wild‐type Tie2 receptor (left), and the receptor domain left‐over in the targeted clones #18 and #19 (right) and the impact of the mutation on the activation of downstream signaling.
Expression of total Fak and P‐Fak (Y397) in serum‐starved GH3 Ctrl‐KO and Tie2‐KO clones #18 and #19 stimulated with rhANGPT2 for 30 min or left untreated. The numbers represent the ratio phospho/total Fak. Anti‐α‐tubulin antibody was used to check for equal loading. Blot shown is representative of 3 independent experiments.
Scheme of the in vivo study in mouse xenografts of GH3 Ctrl‐KO and Tie2‐KO cells (clone #19).
T2‐weighted images of two xenografted tumors taken at day 0 and 21 (largest diameter) representing the two animal groups. Scale bar: 2 mm, except GH3‐Ctrl KO day 21: 4 mm.
Changes in tumor volumes as determined by MRI were normalized to the day 0 value (=100%) for each animal. All box plots show 25th to 75th percentiles (box) and 5th to 95th percentiles (whiskers). The line in the box represents the median. **P = 0.003 (one way ANOVA).
Expression of Tie2 (red) in the xenografted tumors (n = 3 each group). Nuclei were counterstained with DAPI (blue). Original magnification: 400×; scale bar: 50 µm.
- A, B
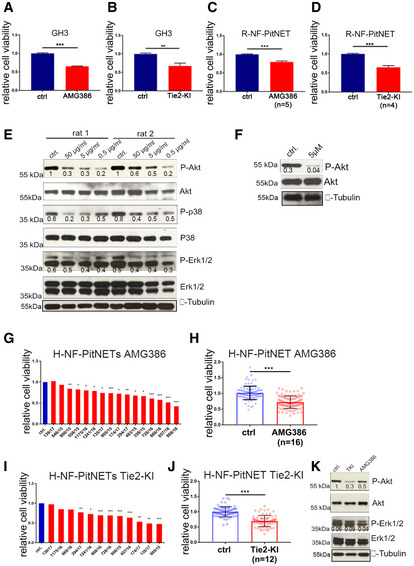
Cell proliferation of GH3 cells treated with 5 μg/ml AMG386 (A) or 5 μM Tie2‐KI (B) or left untreated (ctrl) normalized against untreated cells. ***P < 0.0001; **P = 0.0072 (t‐test). Results are expressed as mean ± SEM of three biological replicates with 6 technical replicates.
- C, D
Cell viability of rat primary PitNET cells (R‐PitNET) treated with AMG386 (n = 5 rats) (C) or Tie2‐KI (n = 4 rats) (D) or left untreated (ctrl) normalized against untreated cells. Primary cultures were treated, each with 6 technical replicates. Results are expressed as mean ± SD. ***P < 0.0001 (t‐test).
- E
Expression of phosphorylated (P) and total Akt, p38 and Erk1/2 in two R‐PitNET cultures with enough cells upon treatment with AMG386.
- F
Expression of phosphorylated (P) and total Akt in one R‐PitNET culture treated with Tie2‐KI or left untreated (ctrl).
- G–J
Cell viability of human primary PitNET cultures treated with (G, H) AMG386 (n = 16) or (I, J) Tie2‐KI (n = 12) normalized against untreated control cells for each patient (set to 1). Significance in (G, I): *P < 0.05; **P < 0.01; ***P < 0.001 (by t‐test, comparing each treated sample with its untreated control). Results in (H) and (J) are expressed as mean ± SEM of the normalized values of 6 technical replicates for each samples. Each dot represents the relative cell viability of one technical replicate. Significance in (H, J) ***P < 0.0001 (t‐test).
- K
Example of responsive H‐PitNET treated with AMG386 or Tie2‐KI. Total proteins were extracted and probed for P‐ and total Akt and Erk1/2. Anti‐α‐tubulin antibody as used to check for equal loading. The blot shown is representative of three independent cultures.
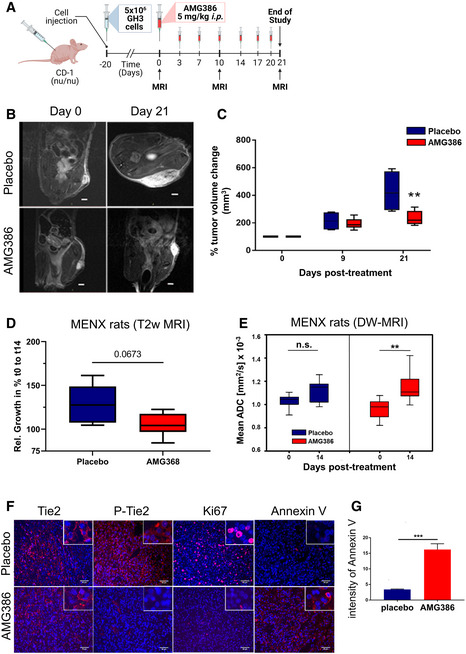
Scheme of the in vivo treatment of GH3‐derived xenografts with AMG386.
T2‐weighted images of two xenografted tumors taken at day 0 and 21 (largest diameter). The tumors are representative of the two treatment groups Scale bar: 2 mm.
Changes in tumor volumes as determined by MRI were normalized to the day 0 value (= 100%) for each animal. All box plots show 25th to 75th percentiles (box) and 5th to 95th percentiles (whiskers). The line in the box represents the median. **P = 0.007 (one way ANOVA).
Changes in tumor volumes in female rats treated with AMG386 (n = 6) or with placebo (n = 5) for 14 days as determined by anatomical MRI, normalized to the day 0 value. Box plots show 25th to 75th percentiles (box) and 5th to 95th percentiles (whiskers). The line in the box represents the median. P = 0.0673, not significant (one way ANOVA).
ADC values of the rat PitNETs before (day 0) and after (day 14) treatment with AMG386 (red, n = 8) or placebo (blue, n = 5). Box plots show 25th to 75th percentiles (box) and 5th to 95th percentiles (whiskers). The line in the box represents the median. **P = 0.009; n.s., not significant (t‐test).
Ex vivo expression of Tie2, P‐Tie2, Ki67 and Annexin V in PitNETs of female rats treated with AMG386 or placebo for 14 days. Original magnification: 200×; scale bar: 50 µm. Panels shown are representative of the two animal groups.
Quantification of Annexin V intensity from tissues stained as in (F) (n = 4/group). Three different areas per tumor sample were analyzed. Intensities are expressed as arbitrary units ± SEM. ***P < 0.001 (by t‐test).
References
-
- Asa SL, Casar‐Borota O, Chanson P, Delgrange E, Earls P, Ezzat S, Grossman A, Ikeda H, Inoshita N, Karavitaki N et al (2017) From pituitary adenoma to pituitary neuroendocrine tumor (PitNET): an International Pituitary Pathology Club proposal. Endocr Relat Cancer 24: C5–C8 - PubMed
-
- Bogdanovic E, Nguyen VP, Dumont DJ (2006) Activation of Tie2 by angiopoietin‐1 and angiopoietin‐2 results in their release and receptor internalization. J Cell Sci 119: 3551–3560 - PubMed
-
- Chiloiro S, Bianchi A, Doglietto F, de Waure C, Giampietro A, Fusco A, Iacovazzo D, Tartaglione L, Di Nardo F, Signorelli F et al (2014) Radically resected pituitary adenomas: prognostic role of Ki 67 labeling index in a monocentric retrospective series and literature review. Pituitary 17: 267–276 - PubMed
-
- Daly C, Eichten A, Castanaro C, Pasnikowski E, Adler A, Lalani AS, Papadopoulos N, Kyle AH, Minchinton AI, Yancopoulos GD et al (2013) Angiopoietin‐2 functions as a Tie2 agonist in tumor models, where it limits the effects of VEGF inhibition. Cancer Res 73: 108–118 - PubMed
MeSH terms
Substances
LinkOut - more resources
Full Text Sources
Medical
Molecular Biology Databases
Research Materials
Miscellaneous
