. 2022 Apr 27;10(2):e0243821.
doi: 10.1128/spectrum.02438-21. Epub 2022 Mar 10.

Distinct Roles of Honeybee Gut Bacteria on Host Metabolism and Neurological Processes

Affiliations

Distinct Roles of Honeybee Gut Bacteria on Host Metabolism and Neurological Processes

Zijing Zhang et al. Microbiol Spectr. .

Abstract

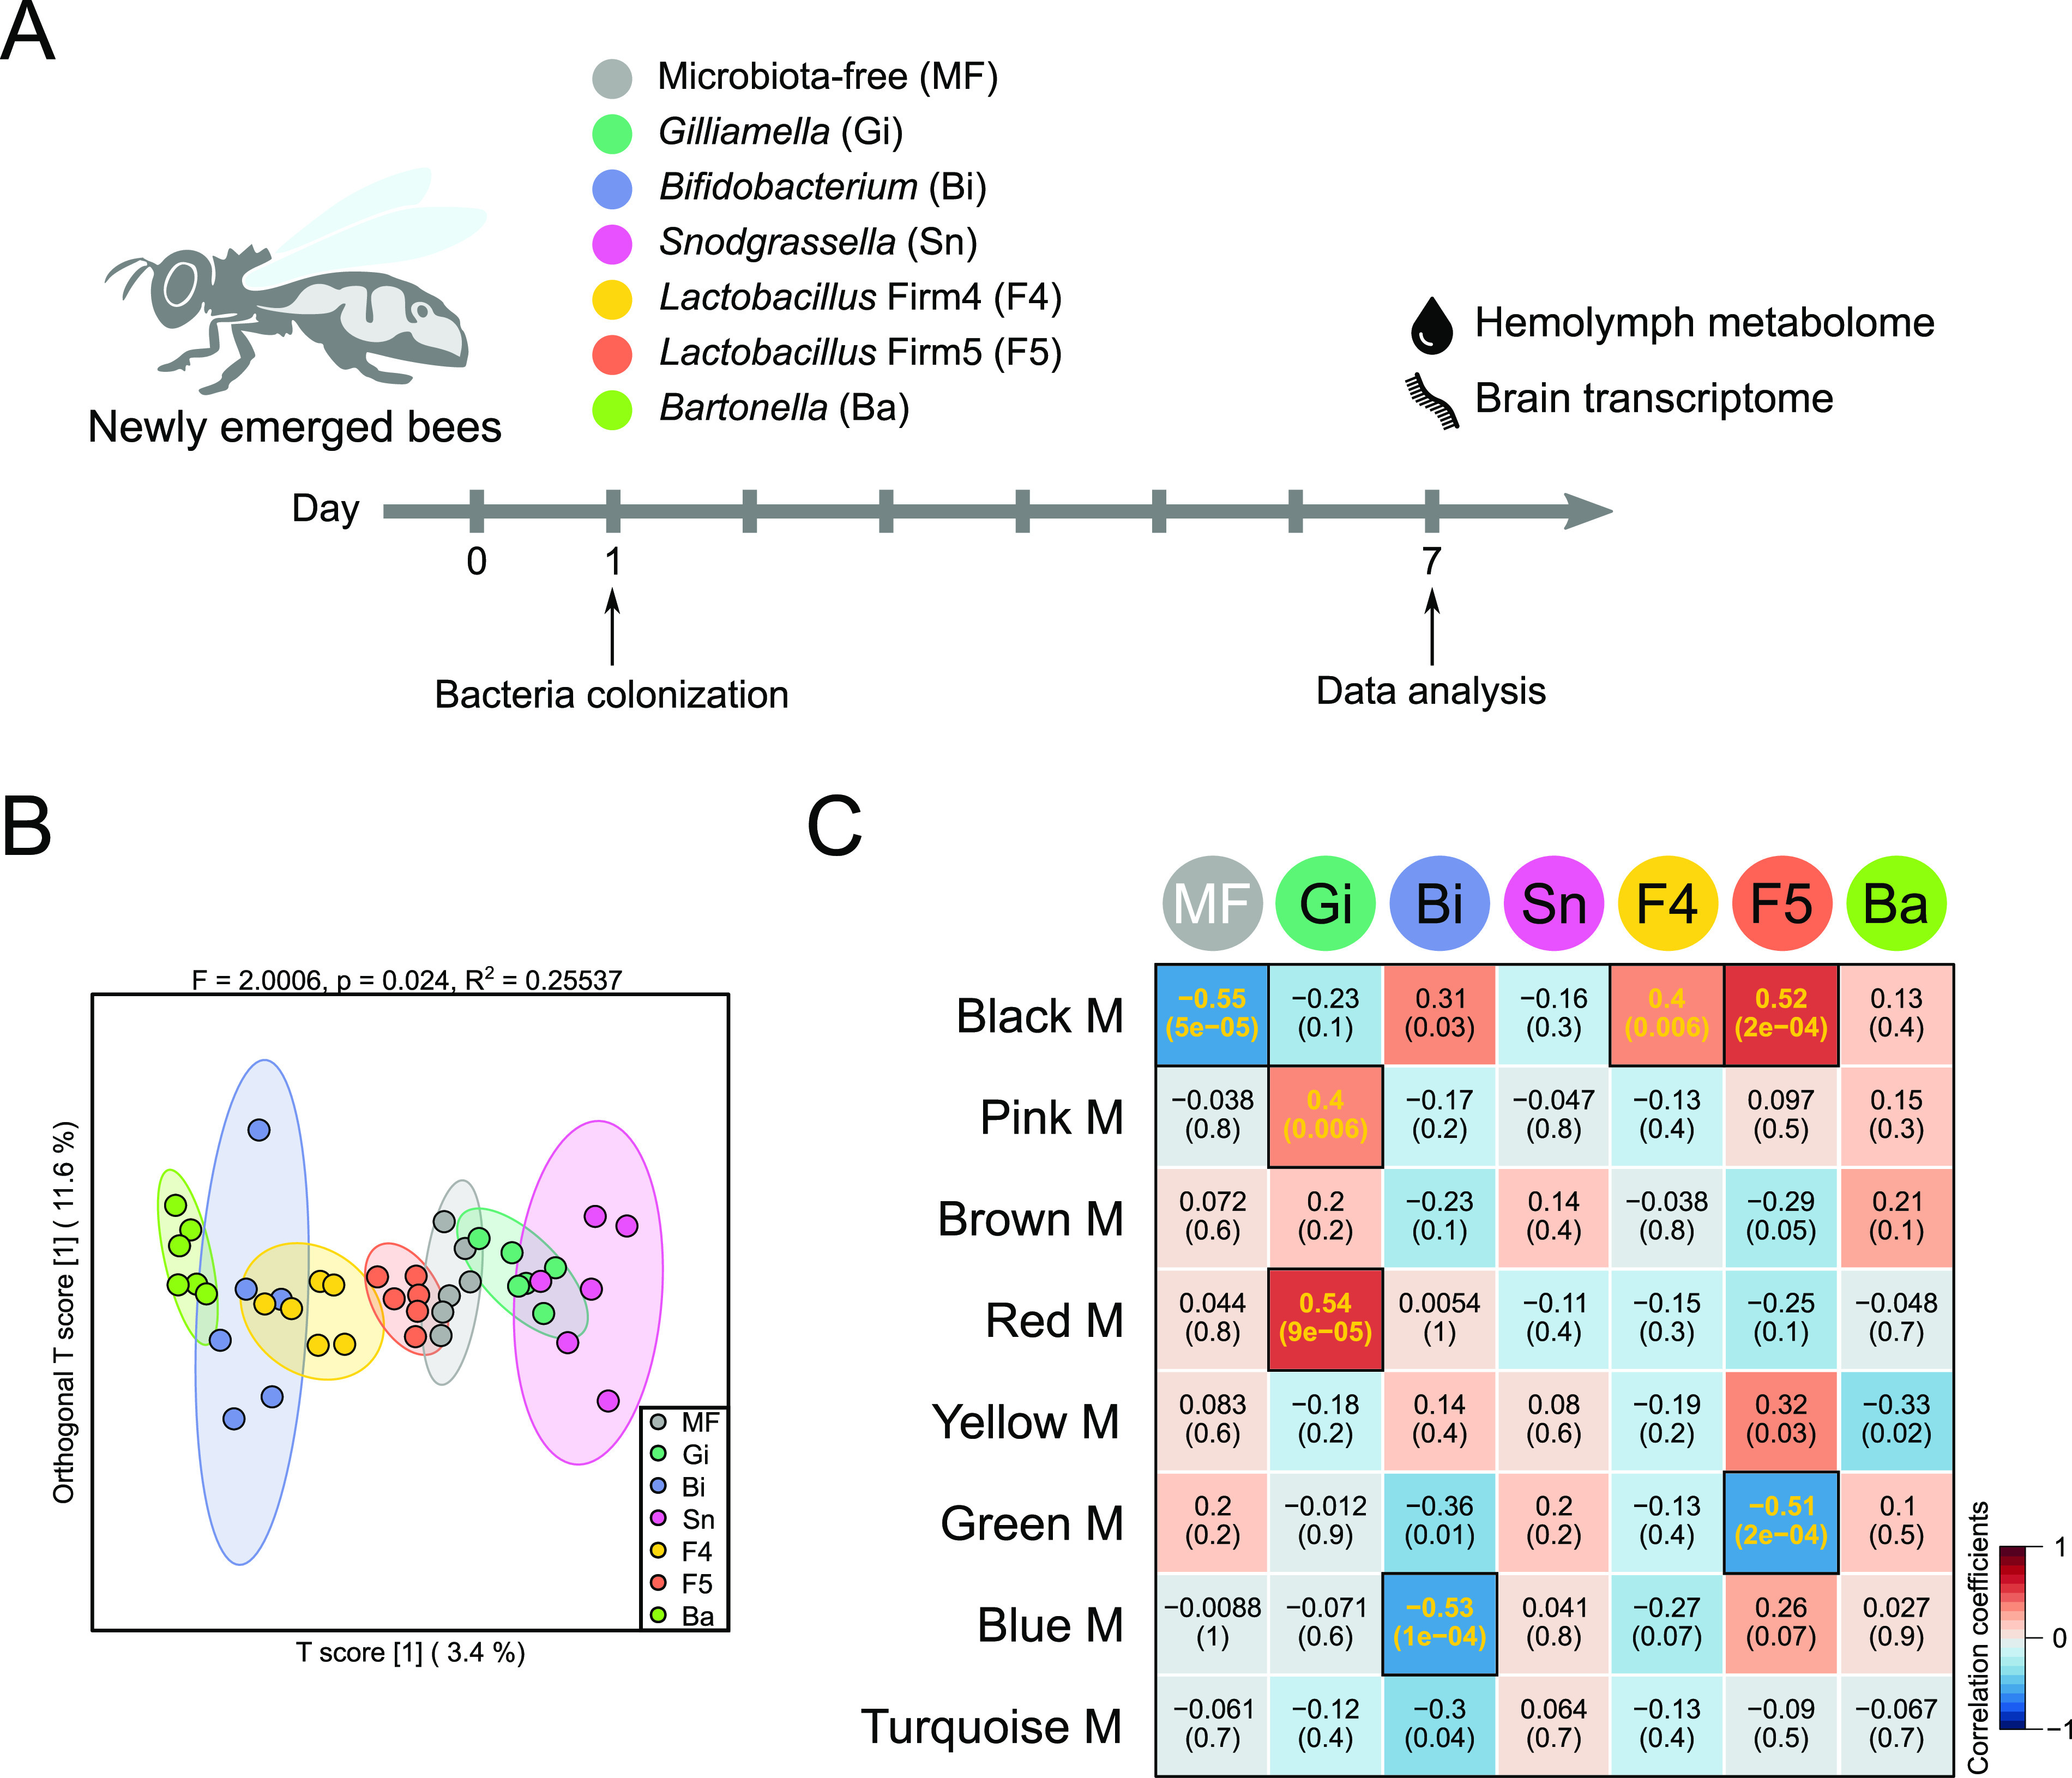
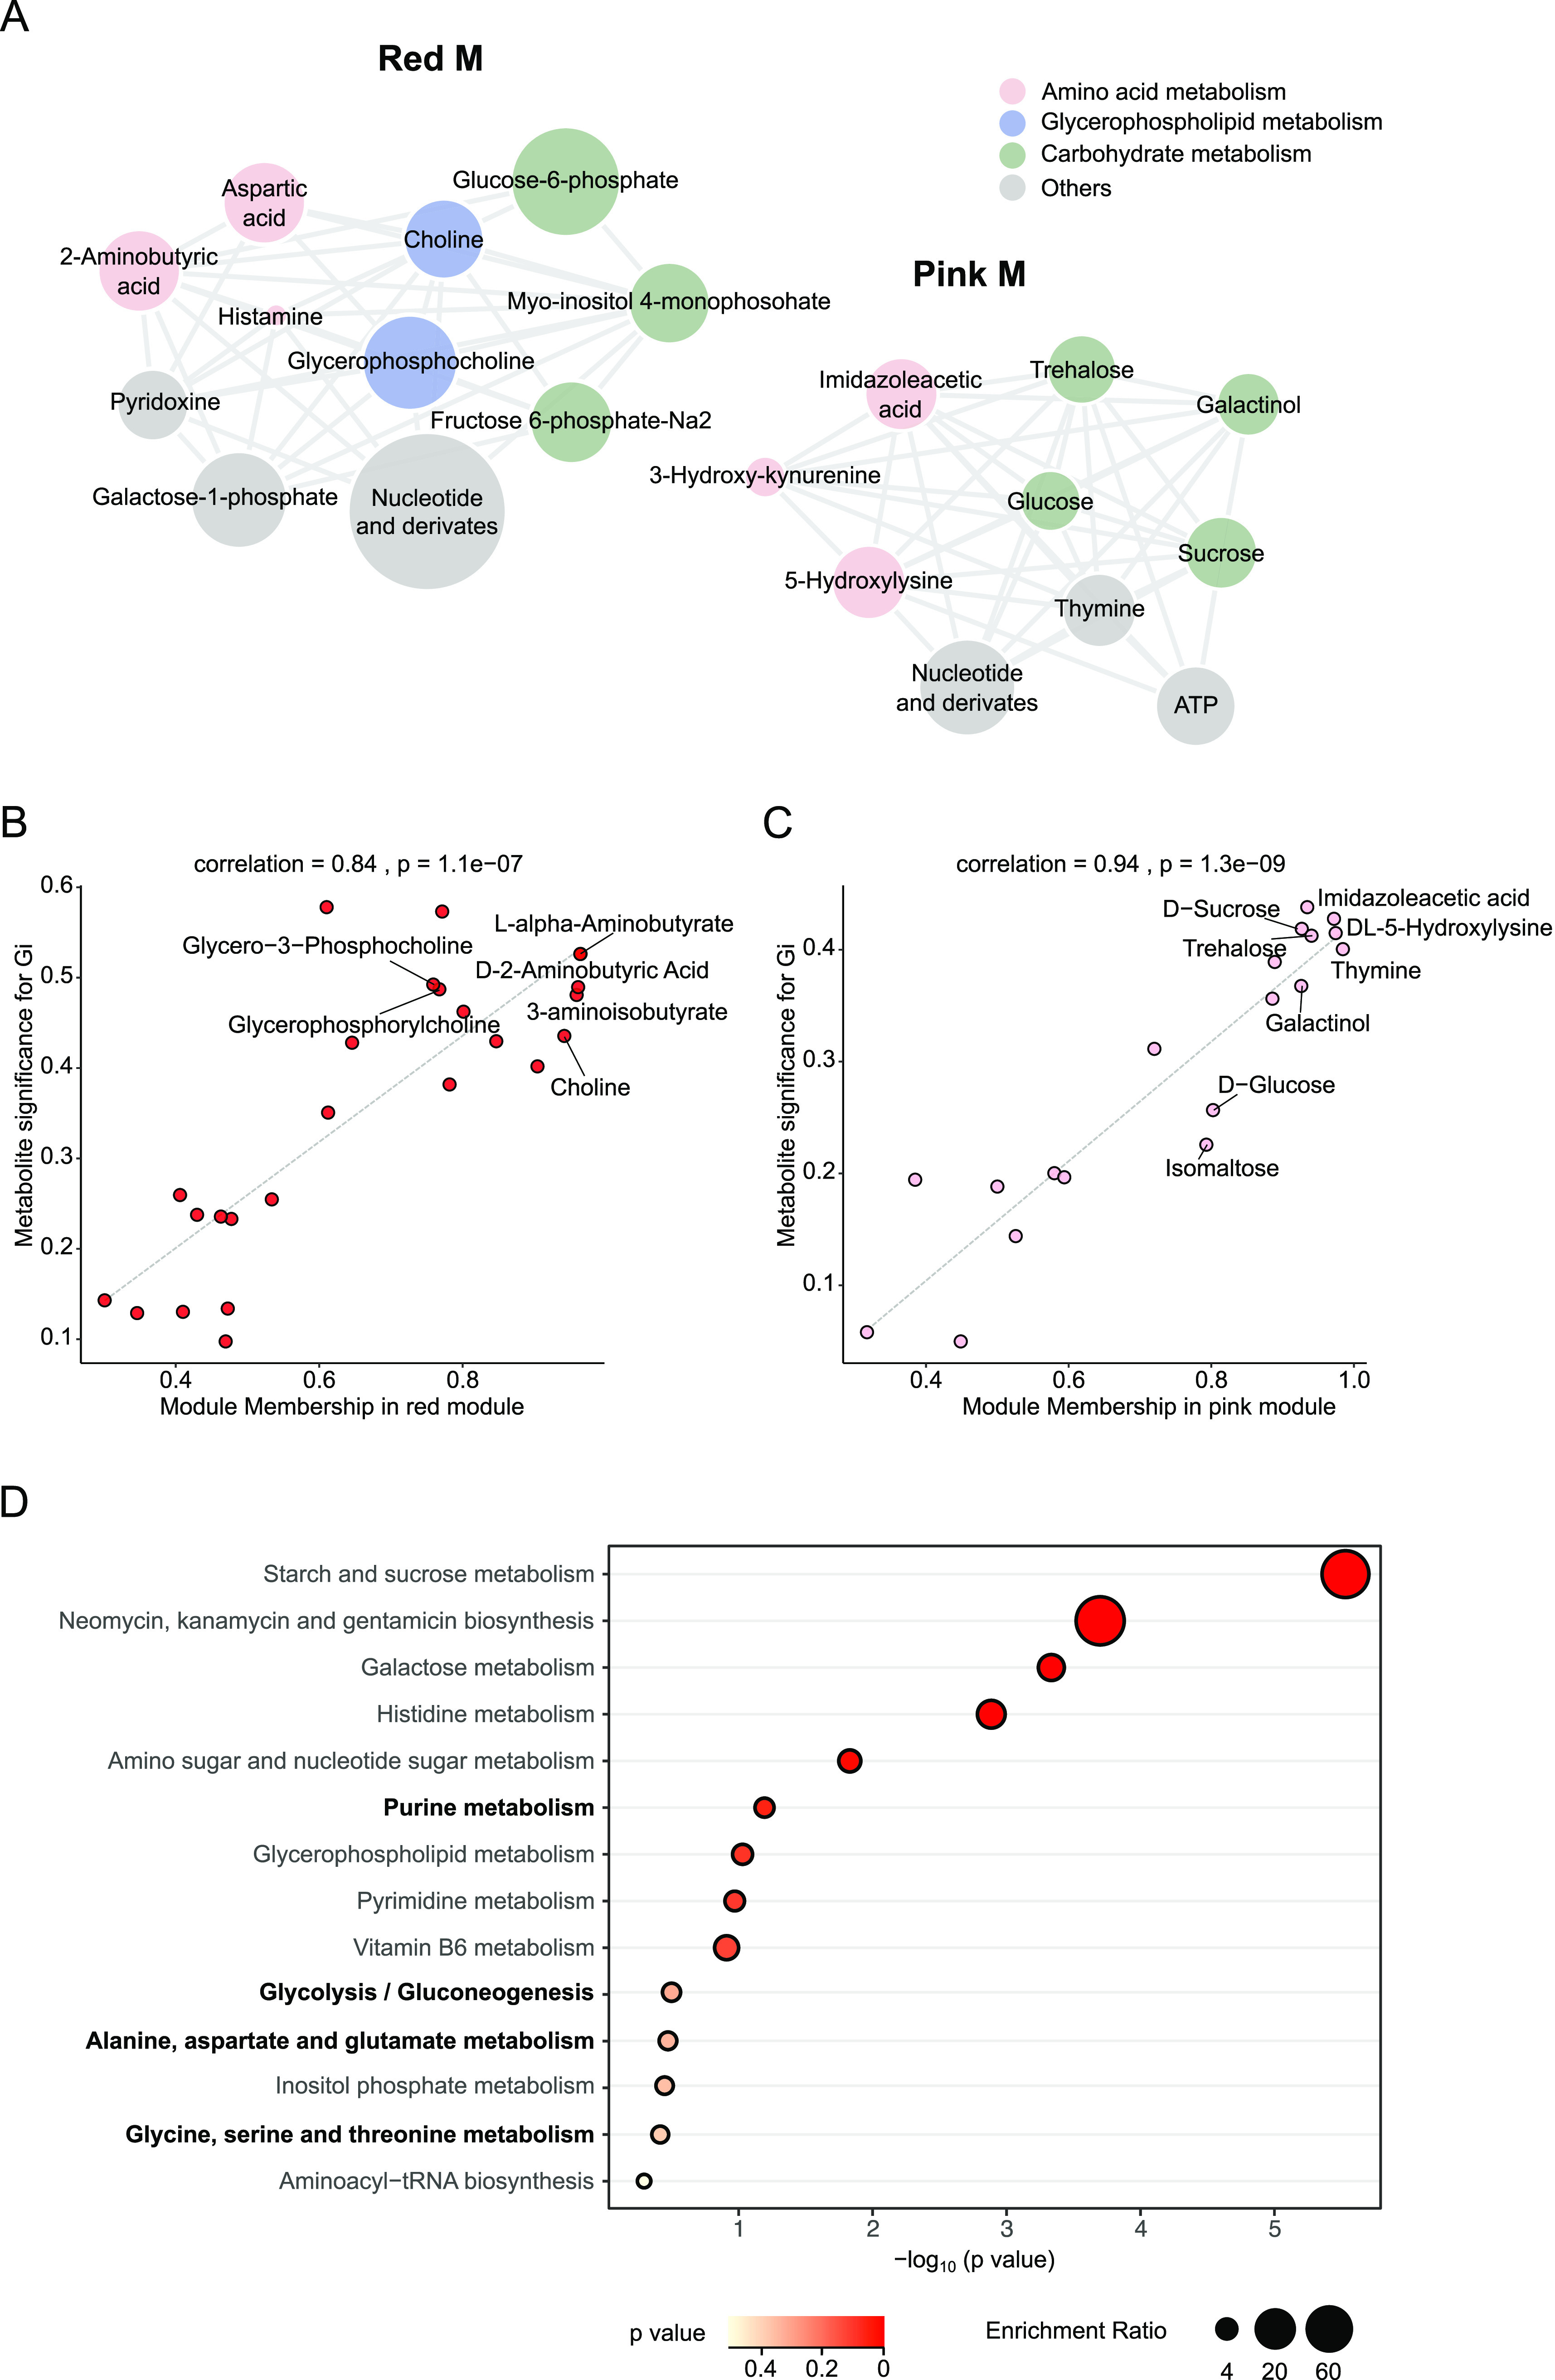
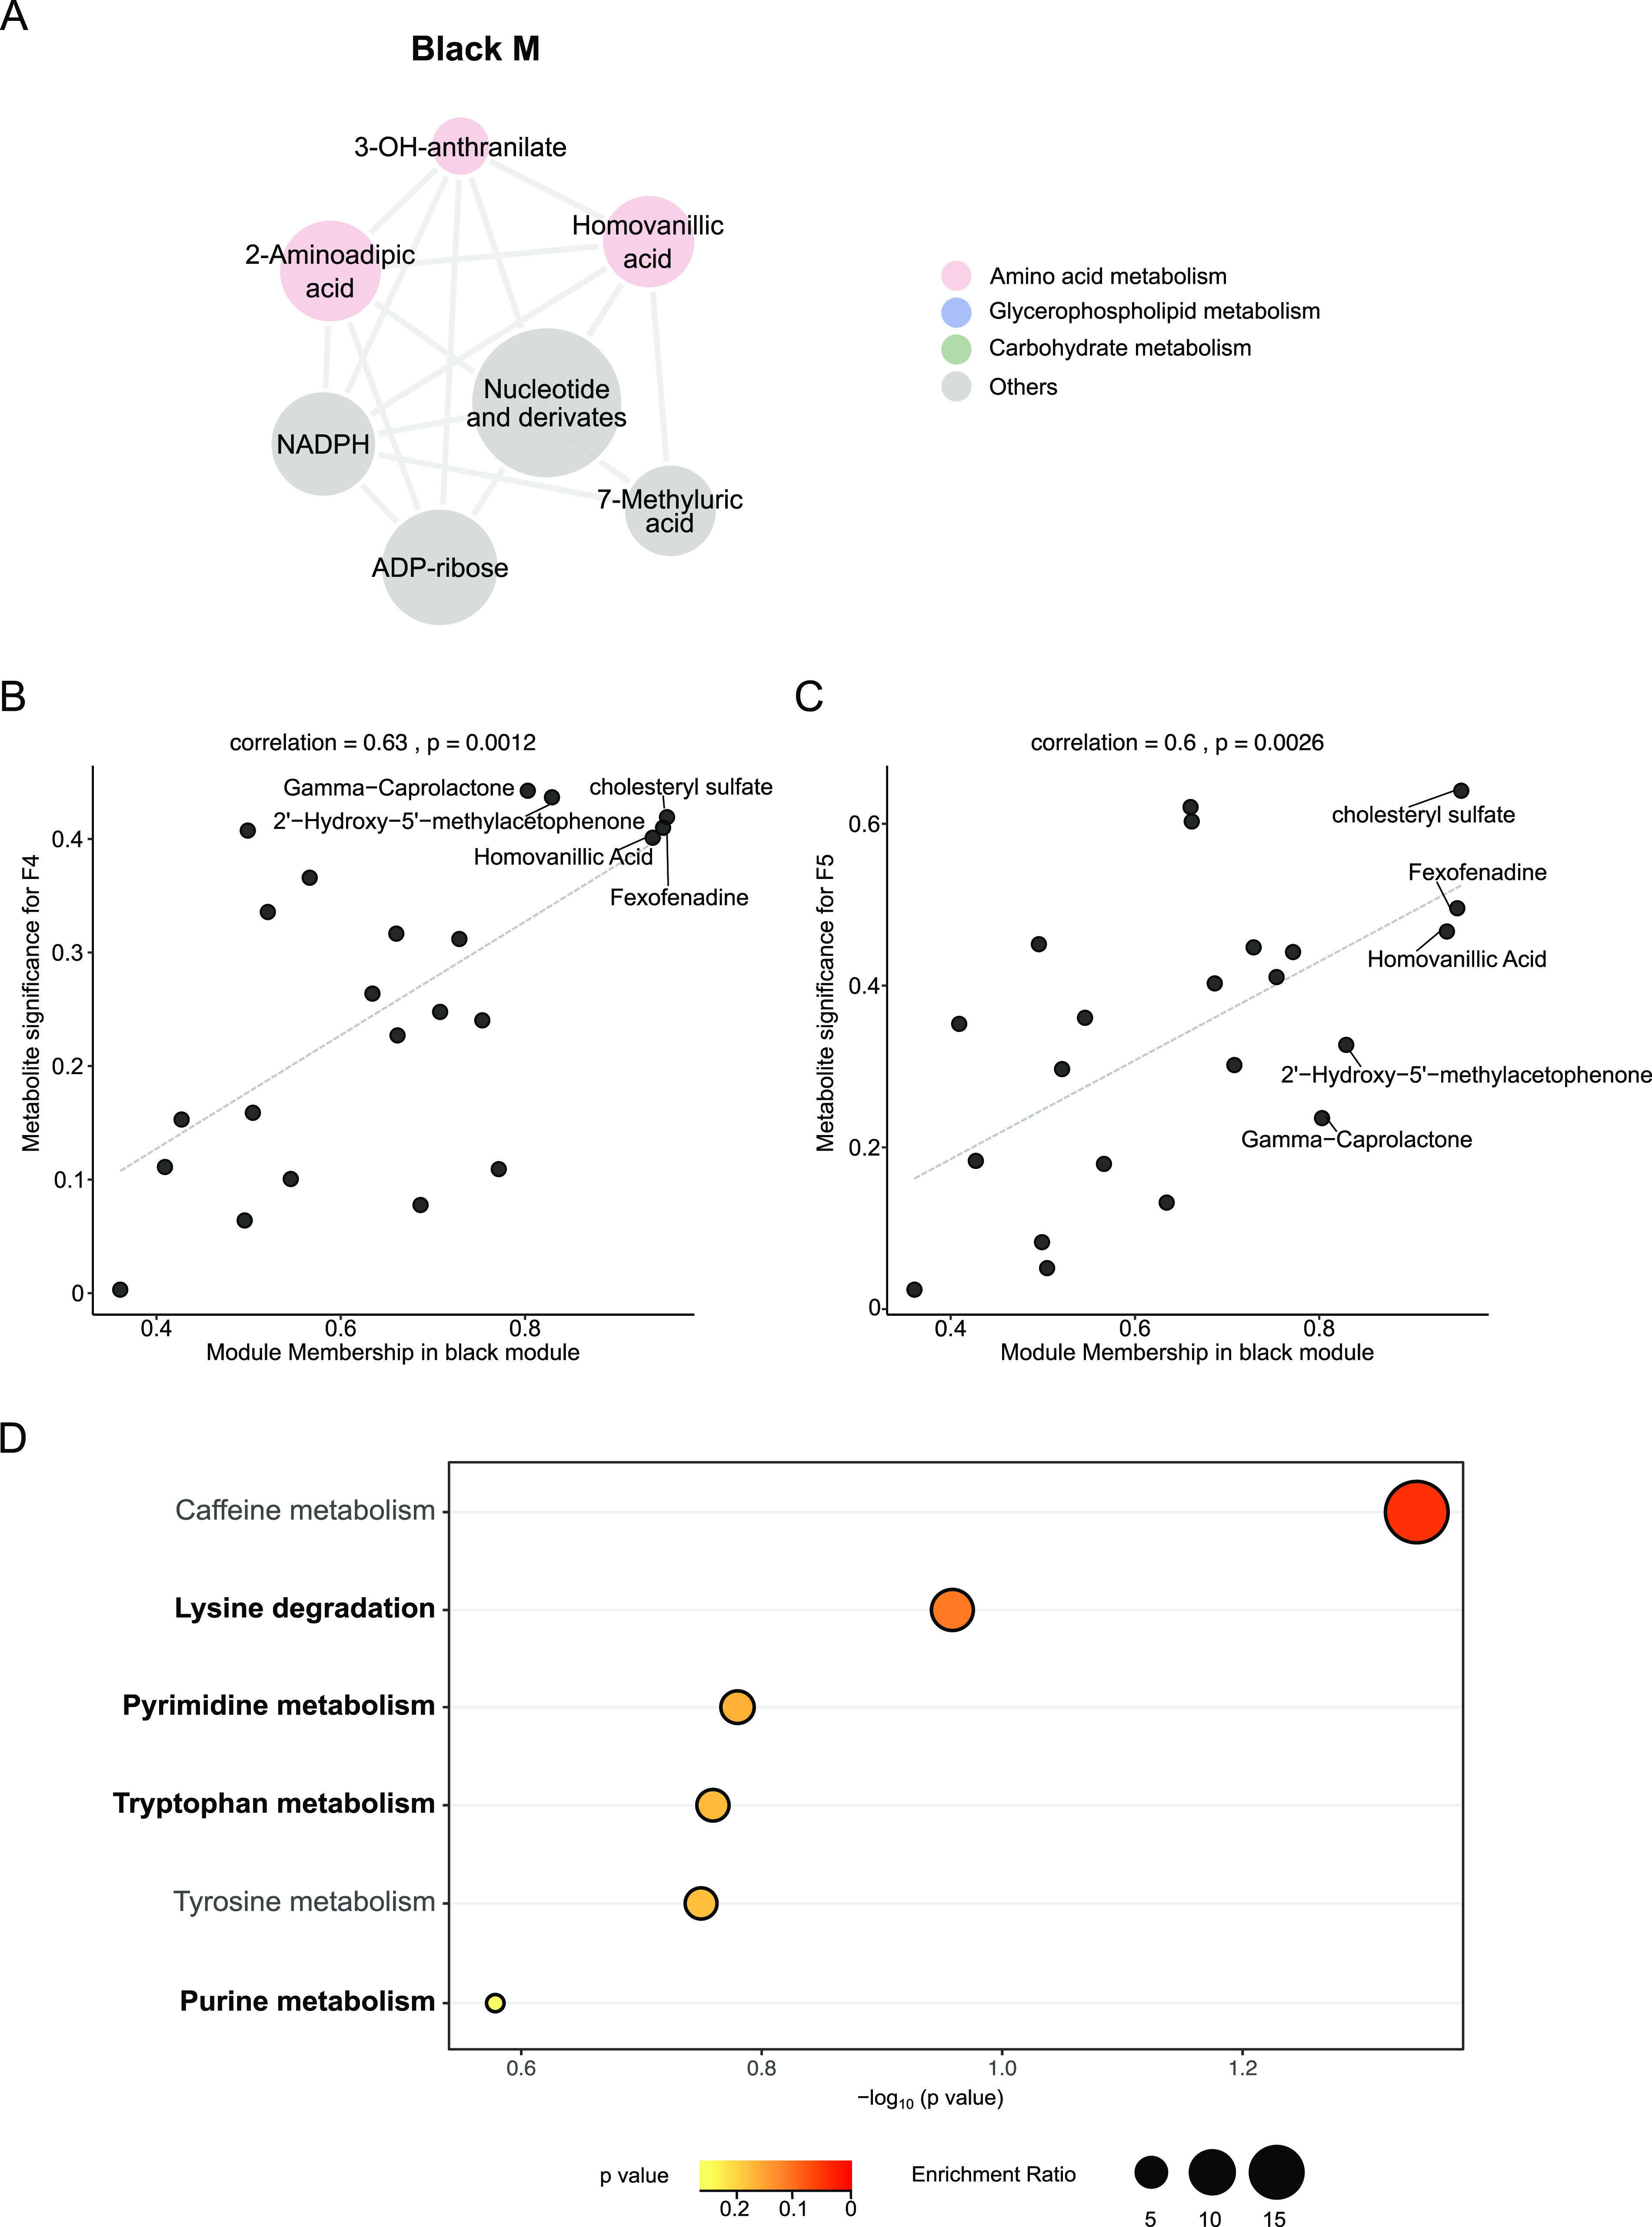
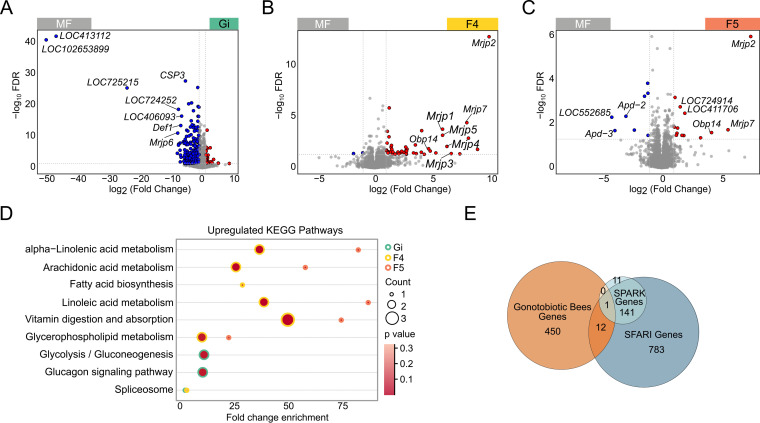
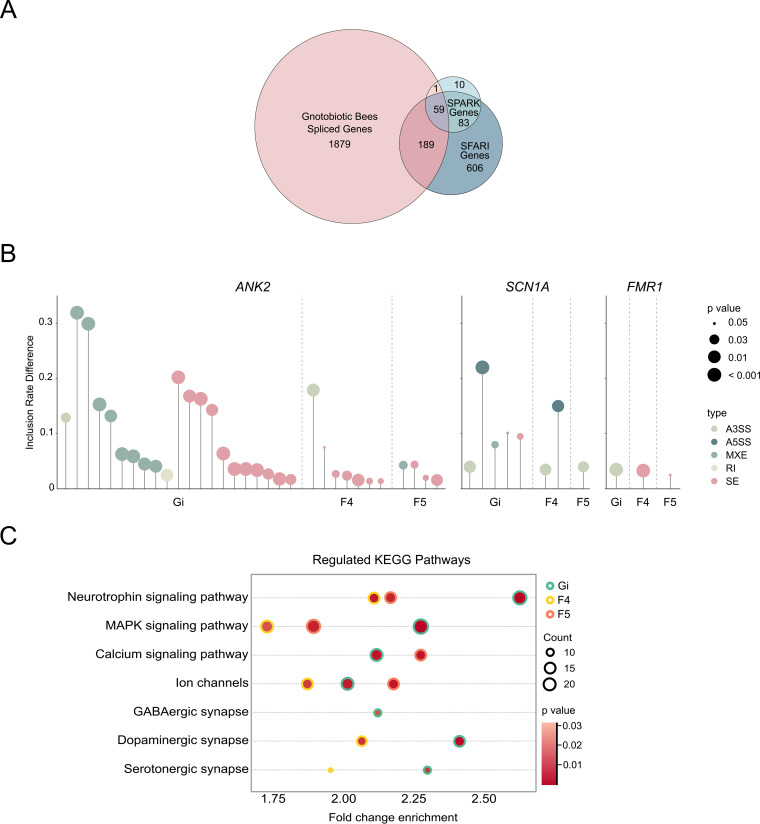
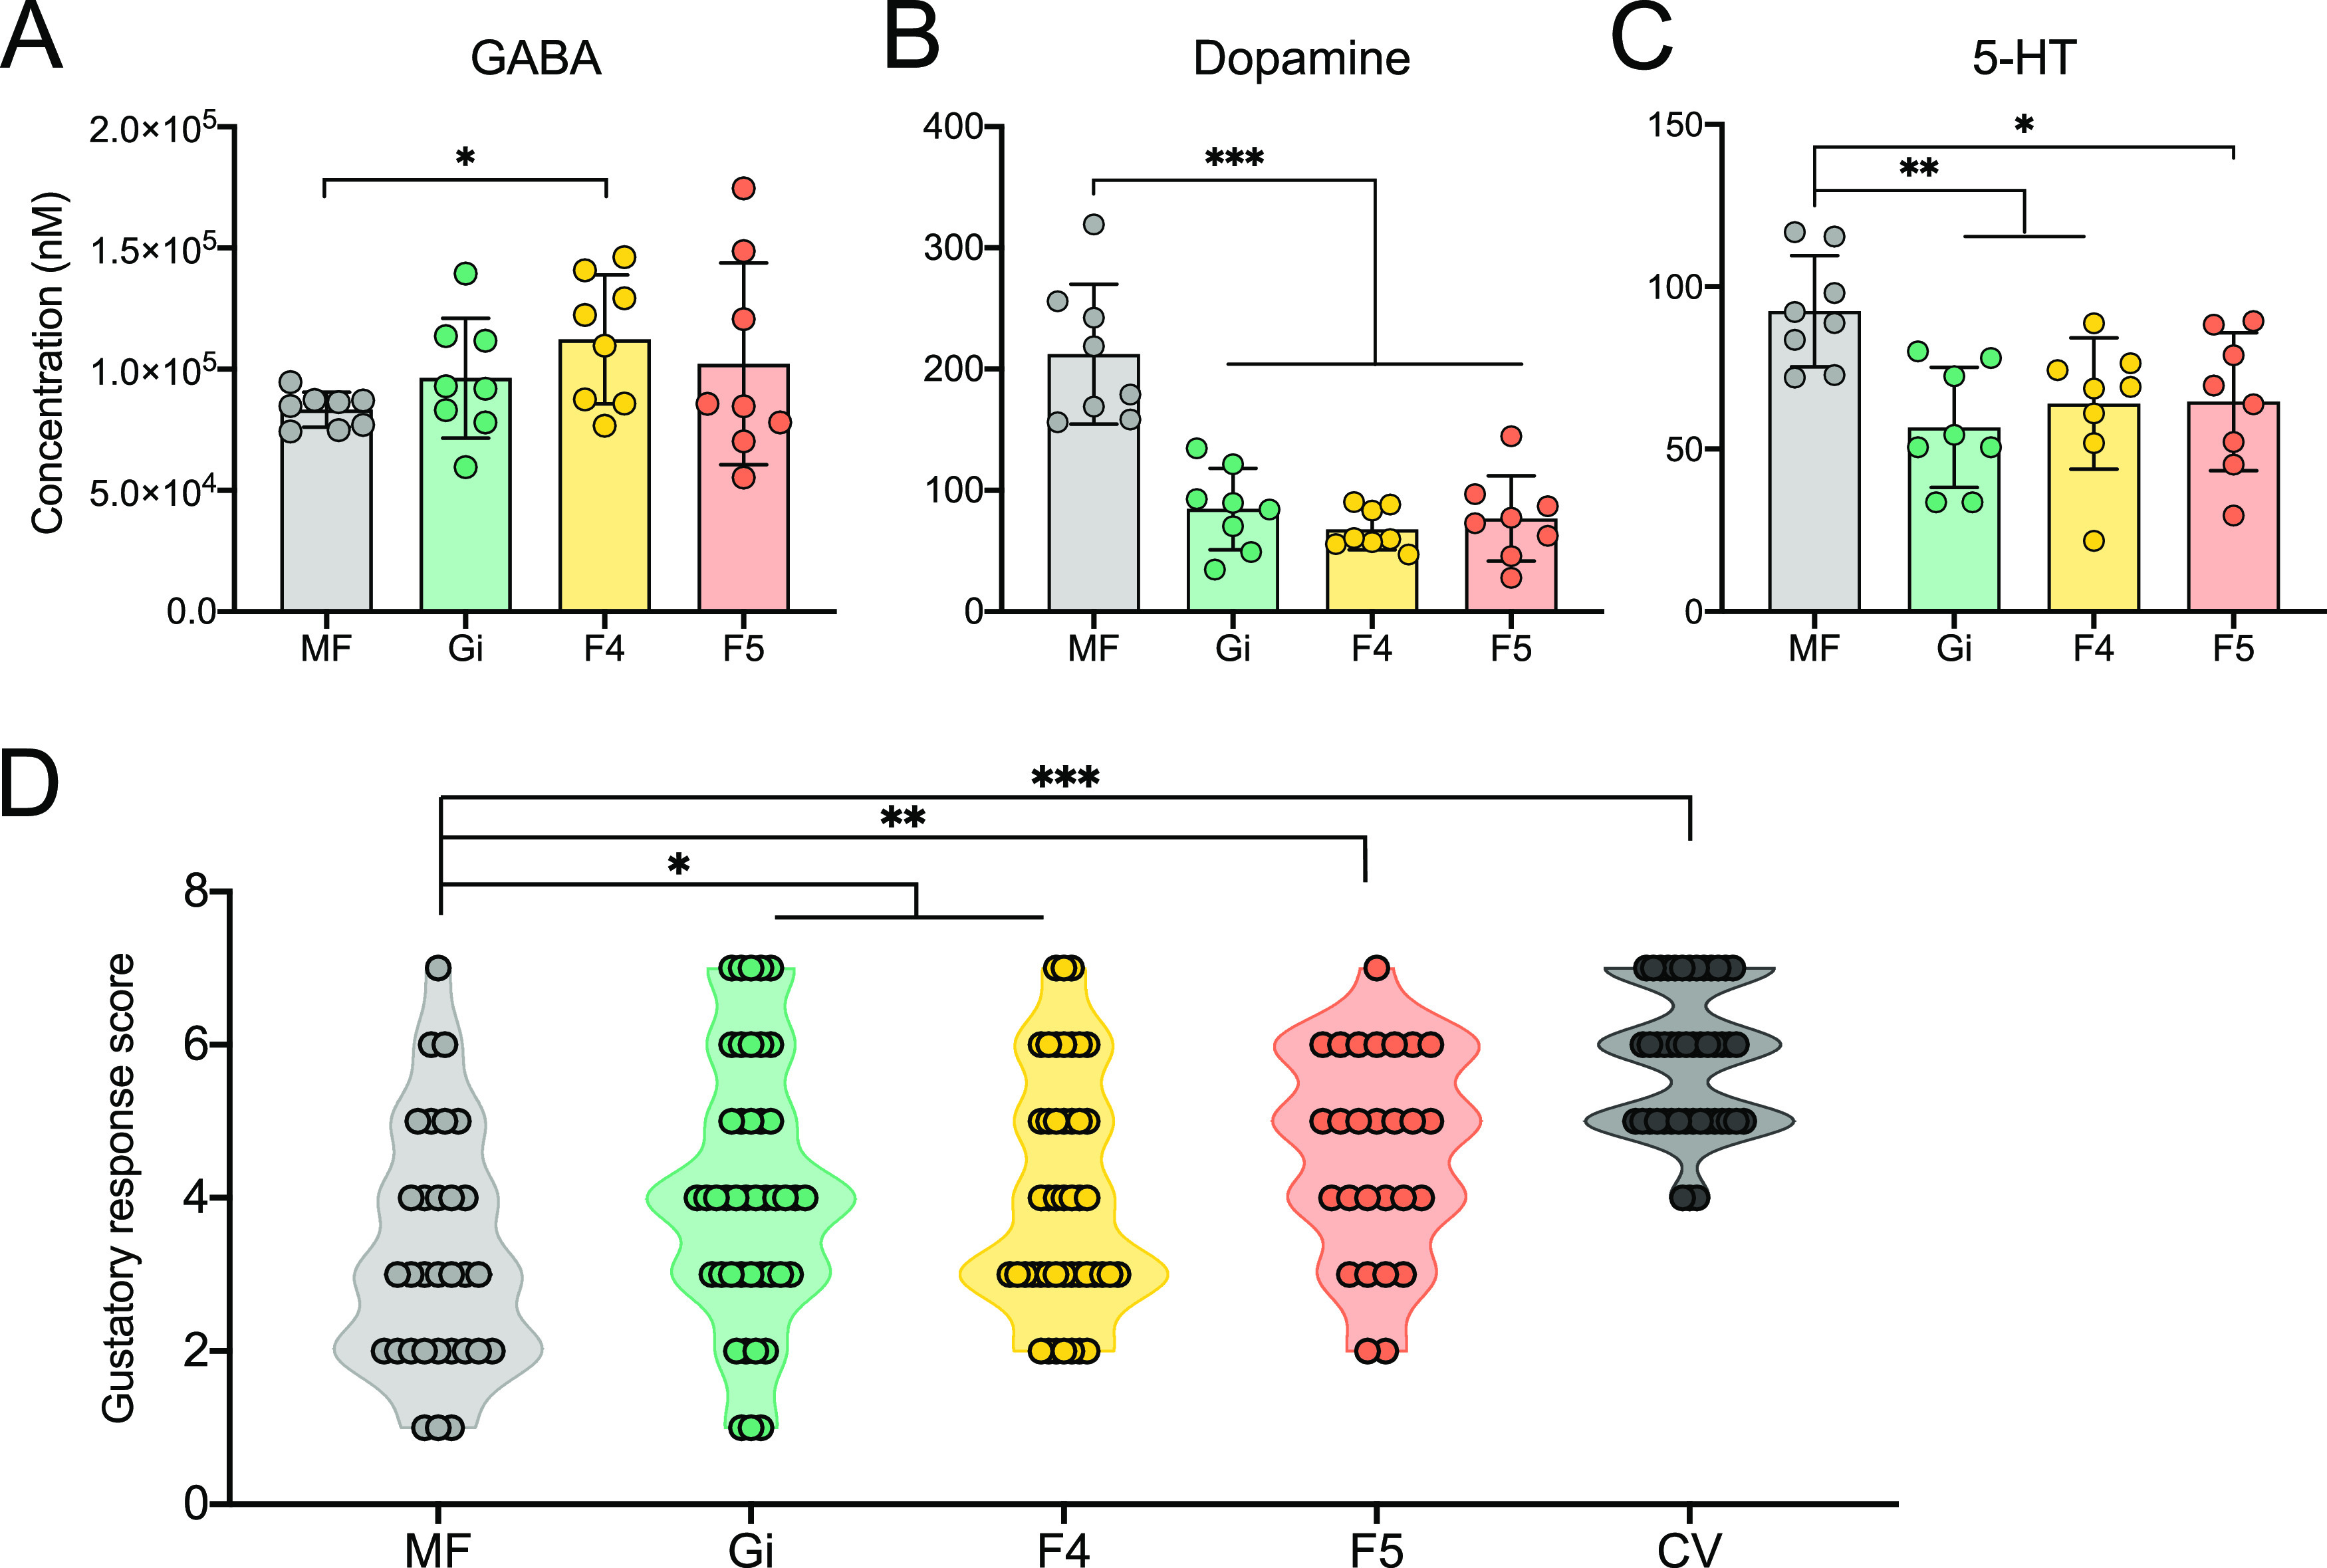
The honeybee possesses a limited number of bacterial phylotypes that play essential roles in host metabolism, hormonal signaling, and feeding behavior. However, the contribution of individual gut members in shaping honeybee brain profiles remains unclear. By generating gnotobiotic bees which were mono-colonized by a single gut bacterium, we revealed that different species regulated specific modules of metabolites in the hemolymph. Circulating metabolites involved in carbohydrate and glycerophospholipid metabolism pathways were mostly regulated by Gilliamella, while Lactobacillus Firm4 and Firm5 mainly altered amino acid metabolism pathways. We then analyzed the brain transcriptomes of bees mono-colonized with these three bacteria. These showed distinctive gene expression profiles, and genes related to olfactory functions and labor division were upregulated by Lactobacillus. Interestingly, differentially spliced genes in the brains of gnotobiotic bees largely overlapped with those of bees unresponsive to social stimuli. The differentially spliced genes were enriched in pathways involved in neural development and synaptic transmission. We showed that gut bacteria altered neurotransmitter levels in the brain. In particular, dopamine and serotonin, which show inhibitory effects on the sensory sensitivity of bees, were downregulated in bacteria-colonized bees. The proboscis extension response showed that a normal gut microbiota is essential for the taste-related behavior of honeybees, suggesting the contribution of potential interactions among different gut species to the host's physiology. Our findings provide fundamental insights into the diverse functions of gut bacteria which likely contribute to honeybee neurological processes. IMPORTANCE The honeybee possesses a simple and host-restricted gut community that contributes to the metabolic health of its host, while the effects of bacterial symbionts on host neural functions remain elusive. We found that the colonization of specific bee gut bacteria regulates distinct circulating metabolites enriched in carbohydrate, amino acid, and glycerophospholipid metabolic pathways. The brains of bees colonized with different gut members display distinct transcriptomic profiles of genes crucial for bee behaviors and division of labor. Alternative splicing of genes related to disordered bee behaviors is also mediated. The presence of gut bacteria promotes sucrose sensitivity with major neurotransmitters being regulated in the brain. Our findings demonstrate how individual bee gut species affect host behaviors, highlighting the gut-brain connections important for honeybee neurobiological and physiological states.

Keywords: Apis mellifera; behavior; gut-brain axis; metabolism; microbiome.


Conflict of interest statement

The authors declare no conflict of interest.

Figures

FIG 1
FIG 1
Hemolymph metabolome influenced by different honeybee gut community members. (A) Experimental design: newly emerged bees were either kept microbiota-free (MF) or mono-colonized with one bacterial isolate of each of the six species separately. Hemolymph and brain samples were collected for further analysis on day 7. (B) Orthogonal partial least squares discriminant analysis (OPLS-DA) based on all metabolites detected in the hemolymph of bees. Group differences were tested by permutational multivariate analysis of variance (PERMANOVA). (C) Weighted correlation network analysis identified eight modules (M) of metabolites highly correlated with different bee groups. Color names represent metabolite modules assigned by the WGCNA pipeline. Heatmap colors indicate positive/negative Spearman’s correlation coefficients. Correlation coefficients and P values are shown within the squares (yellow font, P < 0.01). Gi, Gilliamella apicola; Bi, Bifidobacterium asteroides; Sn, Snodgrassella alvi; F4, Lactobacillus Firm4; F5, Lactobacillus Firm5; Ba, Bartonella apis.
FIG 2
FIG 2
Hemolymph metabolic profile altered by Gilliamella. (A) Network diagrams of differential metabolites in the red and pink M. Circle colors indicate different classes of metabolites in each module. Circle size is proportional to the total abundance of metabolites in each module. (B to C) Correlation analysis between metabolite-module connectivity (x axis) and metabolites significantly correlated with the Gi group (y axis): (B) red M and (C) pink M. (D) The most significantly enriched KEGG pathways upregulated in the hemolymphs of Gilliamella-inoculated bees.
FIG 3
FIG 3
Hemolymph metabolic profile altered by Lactobacillus Firm4 and Firm5. (A) Network diagram of differential metabolites in the black M. Circle colors indicate different classes of metabolites in each module. Circle size is proportional to the total abundance of metabolites in each module. (B to C) Correlation analysis between metabolite-module connectivity (x axis) and metabolites significantly correlated with different bee groups (y axis): (B) black M with F4 group and (C) black M with F5 group. (D) The most significantly enriched KEGG pathways upregulated in the hemolymph of Lactobacillus Firm4- and Firm5-inoculated bees.
FIG 4
FIG 4
Gut microbiota impacts gene expression in the honeybee brain. (A to C) Volcano plot showing differentially regulated genes. Genes significantly enriched in bacteria-colonized bees are shown in red, and those enriched in MF bees are in blue. (D) KEGG pathways upregulated in the brains of mono-colonized bees based on differentially expressed genes. Fold change enrichment describes the proportion of genes belonging to a KEGG pathway (KO3 level) among differentially expressed genes in brains between MF and mono-colonized bees (FDR < 0.05, |log2-fold change| > 1). (E) Venn diagram of differentially expressed genes in brains between MF and mono-colonized bees (gnotobiotic bee genes; FDR < 0.05, Wald test with Benjamini-Hochberg correction), and their overlap with SPARK and SFARI gene data sets.
FIG 5
FIG 5
Gut microbiota impacts alternative splicing of high-confidence ASD genes in the honeybee brain. (A) Venn diagram of differentially spliced genes in the brains between MF and mono-colonized bees (gnotobiotic bee spliced genes; P < 0.05), and their overlap with SPARK and SFARI gene data sets. (B) Differentially splicing events (P < 0.05) in Ank2 present in both SPARK and SFARI gene data sets. Differential splicing events were identified by rMATS. A3SS, alternative 3′ splice site; A5SS, alternative 5′ splice site; MXE, mutually exclusive exon; RI, retained introns; SE, skipped exon. (C) KEGG pathways regulated in the brains of mono-colonized bees based on differentially spliced genes. Fold change enrichment describes the proportion of genes belonging to a KEGG pathway (KO3 level) among differentially spliced genes in the brains between MF and mono-colonized bees (gnotobiotic bee spliced genes; FDR < 0.05, |log2-fold change| > 1).
FIG 6
FIG 6
Gut microbiota alters the concentration of neurotransmitters in the brain and honeybee behavior. (Ato C) Concentrations of (A) GABA, (B) dopamine, and (C) 5-HT in the brains of MF (n = 8), Gi (n = 8), F4 (n = 8), and F5 (n = 8) bees. (D) Distribution of gustatory response scores of MF bees (n = 31) and bees mono-colonized with different core gut bacteria: Gi (n = 43), F4 (n = 46), F5 (n = 27), and conventional bees (CV, n = 46). Each circle indicates a bee response to the provided sucrose concentration. Differences between bacteria-colonized and MF bees were tested by Mann-Whitney U test (*, P < 0.05; **, P < 0.01; ***, P < 0.001).

References

    1. Menzel R. 2012. The honeybee as a model for understanding the basis of cognition. Nat Rev Neurosci 13:758–768. doi: 10.1038/nrn3357. - DOI - PubMed
    1. Raine NE, Ings TC, Dornhaus A, Selah N, Chittka L. 2006. Adaptation, genetic drift, pleiotropy, and history in the evolution of bee foraging behavior. Adv Stud Behav 36:305–354. doi: 10.1016/S0065-3454(06)36007-X. - DOI
    1. Scheiner R, Abramson CI, Brodschneider R, Crailsheim K, Farina WM, Fuchs S, Grünewald B, Hahshold S, Karrer M, Koeniger G, Koeniger N, Menzel R, Mujagic S, Radspieler G, Schmickl T, Schneider C, Siegel AJ, Szopek M, Thenius R. 2013. Standard methods for behavioural studies of Apis mellifera. J Apicult Res 52:1–58. doi: 10.3896/IBRA.1.52.4.04. - DOI
    1. Amdam GV, Norberg K, Fondrk MK, Page RE. Jr., 2004. Reproductive ground plan may mediate colony-level selection effects on individual foraging behavior in honey bees. Proc Natl Acad Sci USA 101:11350–11355. doi: 10.1073/pnas.0403073101. - DOI - PMC - PubMed
    1. Arien Y, Dag A, Zarchin S, Masci T, Shafir S. 2015. Omega-3 deficiency impairs honey bee learning. Proc Natl Acad Sci USA 112:15761–15766. doi: 10.1073/pnas.1517375112. - DOI - PMC - PubMed

Publication types

LinkOut - more resources