. 2022 Oct;18(10):2443-2458.
doi: 10.1080/15548627.2022.2038999. Epub 2022 Mar 10.

Lamp1 mediates lipid transport, but is dispensable for autophagy in Drosophila

Affiliations

Lamp1 mediates lipid transport, but is dispensable for autophagy in Drosophila

Norin Chaudhry et al. Autophagy. 2022 Oct.

Abstract

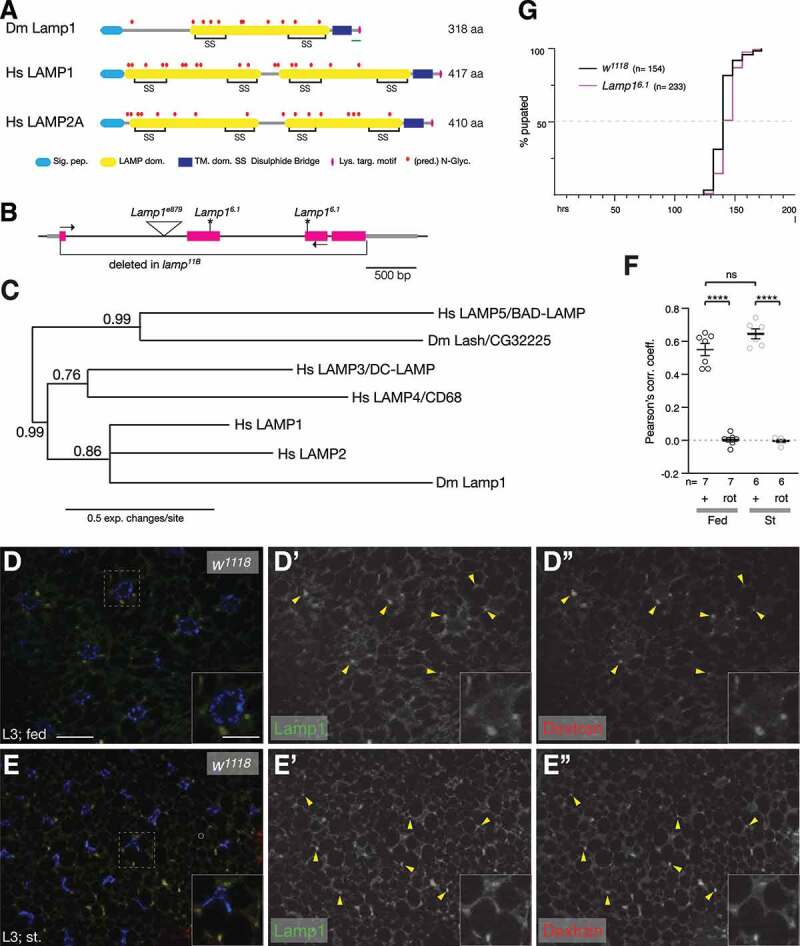
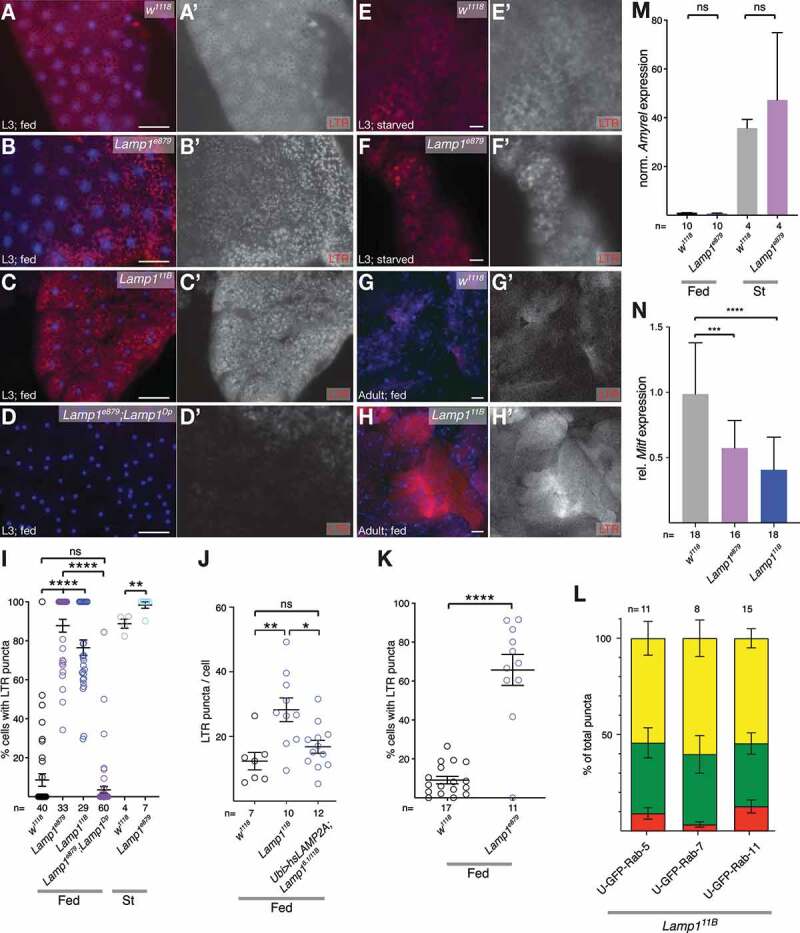
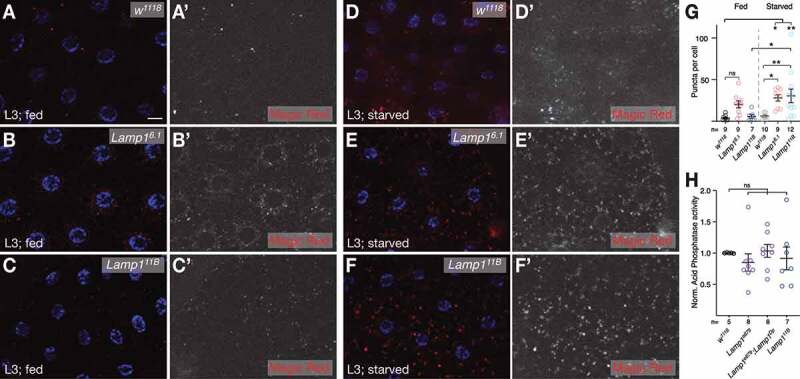
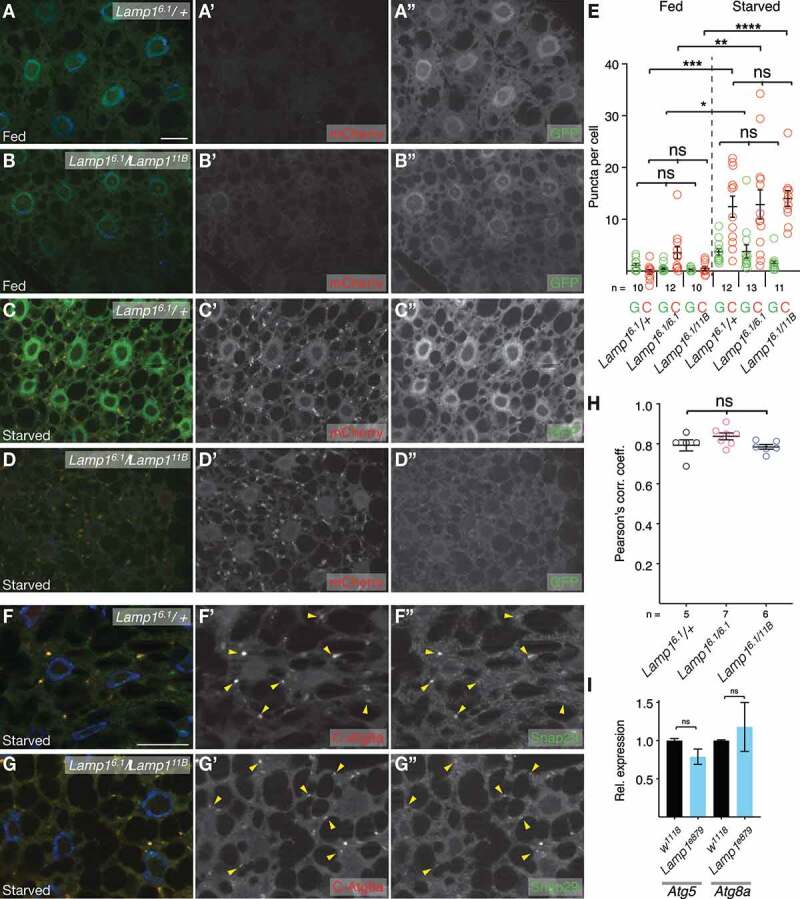
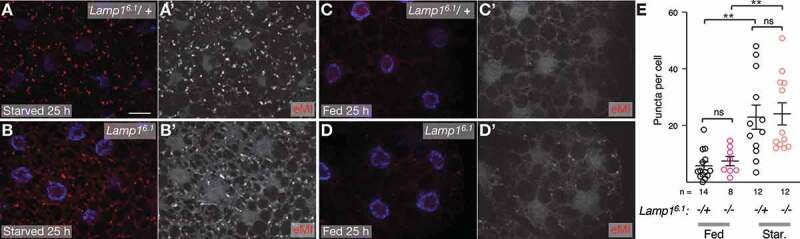
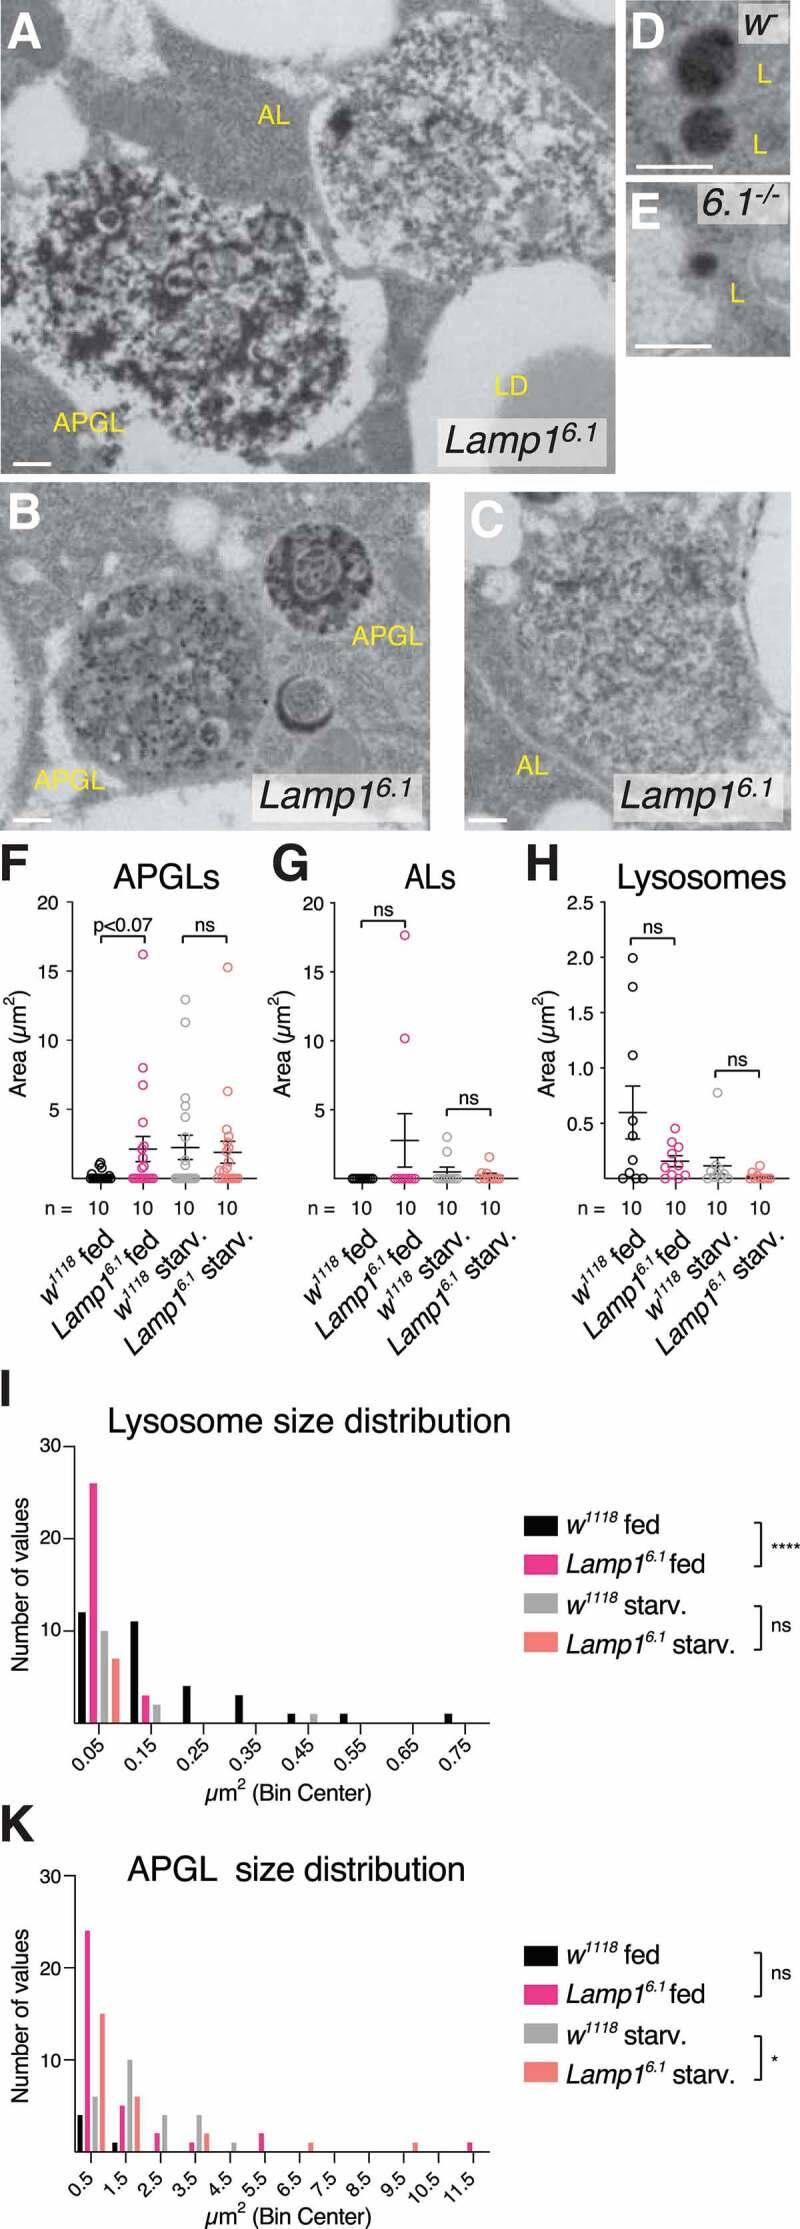
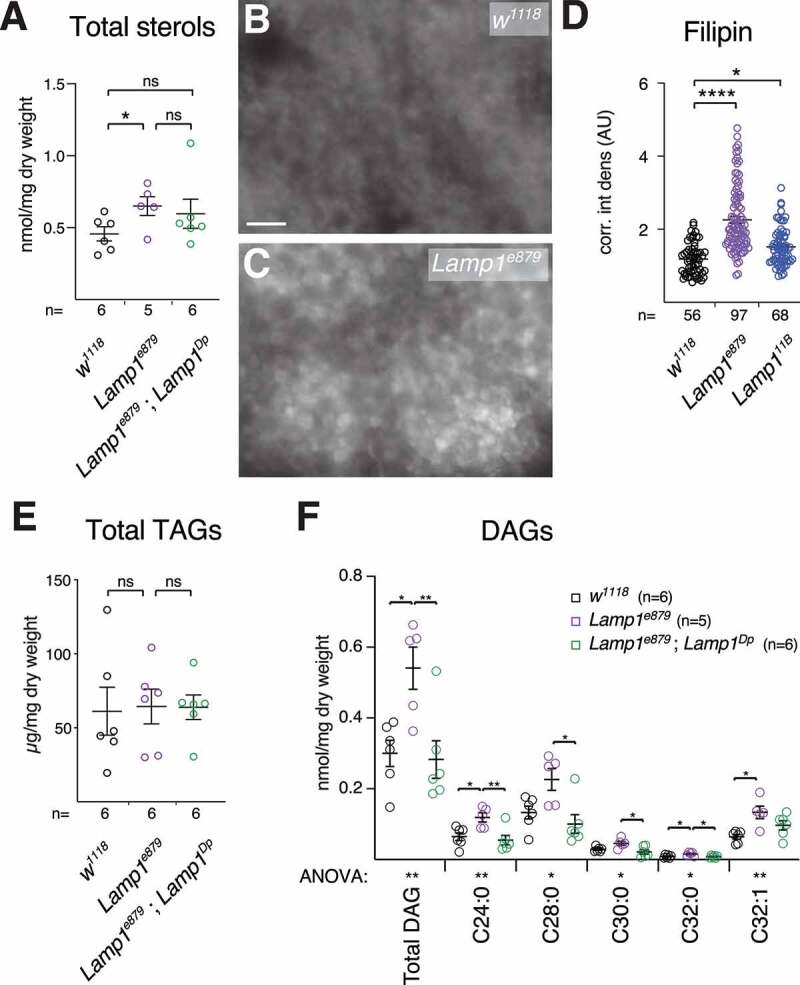
The endolysosomal system not only is an integral part of the cellular catabolic machinery that processes and recycles nutrients for synthesis of biomaterials, but also acts as signaling hub to sense and coordinate the energy state of cells with growth and differentiation. Lysosomal dysfunction adversely influences vesicular transport-dependent macromolecular degradation and thus causes serious problems for human health. In mammalian cells, loss of the lysosome associated membrane proteins LAMP1 and LAMP2 strongly affects autophagy and cholesterol trafficking. Here we show that the previously uncharacterized Drosophila Lamp1 is a bona fide ortholog of vertebrate LAMP1 and LAMP2. Surprisingly and in contrast to lamp1 lamp2 double-mutant mice, Drosophila Lamp1 is not required for viability or autophagy, suggesting that fly and vertebrate LAMP proteins acquired distinct functions, or that autophagy defects in lamp1 lamp2 mutants may have indirect causes. However, Lamp1 deficiency results in an increase in the number of acidic organelles in flies. Furthermore, we find that Lamp1 mutant larvae have defects in lipid metabolism as they show elevated levels of sterols and diacylglycerols (DAGs). Because DAGs are the main lipid species used for transport through the hemolymph (blood) in insects, our results indicate broader functions of Lamp1 in lipid transport. Our findings make Drosophila an ideal model to study the role of LAMP proteins in lipid assimilation without the confounding effects of their storage and without interfering with autophagic processes.Abbreviations: aa: amino acid; AL: autolysosome; AP: autophagosome; APGL: autophagolysosome; AV: autophagic vacuole (i.e. AP and APGL/AL); AVi: early/initial autophagic vacuoles; AVd: late/degradative autophagic vacuoles; Atg: autophagy-related; CMA: chaperone-mediated autophagy; Cnx99A: Calnexin 99A; DAG: diacylglycerol; eMI: endosomal microautophagy; ESCRT: endosomal sorting complexes required for transport; FB: fat body; HDL: high-density lipoprotein; Hrs: Hepatocyte growth factor regulated tyrosine kinase substrate; LAMP: lysosomal associated membrane protein; LD: lipid droplet; LDL: low-density lipoprotein; Lpp: lipophorin; LTP: Lipid transfer particle; LTR: LysoTracker Red; MA: macroautophagy; MCC: Manders colocalization coefficient; MEF: mouse embryonic fibroblast MTORC: mechanistic target of rapamycin kinase complex; PV: parasitophorous vacuole; SNARE: soluble N-ethylmaleimide sensitive factor attachment protein receptor; Snap: Synaptosomal-associated protein; st: starved; TAG: triacylglycerol; TEM: transmission electron microscopy; TFEB/Mitf: transcription factor EB; TM: transmembrane domain; tub: tubulin; UTR: untranslated region.

Keywords: Autophagy; Drosophila; LAMP proteins; lipid transport; lysosome.


Conflict of interest statement

No potential conflict of interest was reported by the author(s).

Figures

Figure 1.
Figure 1.
Lamp1 mutants are viable and have no developmental delay. (A) Schematic comparing Drosophila Lamp1 with human LAMP1 and LAMP2A. Note that Lamp1 has only one lumenal LAMP domain. The green bar indicates the peptide region used to raise the Lamp1 antibody. (B) Schematic of Lamp1 locus with mutant alleles indicated. UTRs are in gray, coding sequence in magenta. Lamp16.1 contains two frame shifts (*) at the positions of both gRNAs used to induce it. Arrows depict location of RT-PCR primers. (C) Bayesian phylogenetic tree of indicated LAMP proteins. Numbers indicate bootstrap values. (D, E) In 3rd instar larval fat body under fed (C) and starved conditions (D), Lamp1 colocalizes with TRITC-Dextran-labeled endolysosomes (examples marked by yellow arrowheads). Single channel images show Lamp1 (D’, E’) and Dextran (D”, E”), respectively. Insets show enlarged section indicated by dotted squares. Nuclei are in blue. Scale bars: 20 µm (10 µm in insets). (F) Pearson’s correlation coefficient for the colocalization of Lamp1 with TRITC-Dextran under indicated conditions. As control, one channel was rotated (rot) by 180°. One-way ANOVAs (Tukey correction) P < 0.0001; ****, P < 0.0001; ns, not significant. (G) Quantification of pupation timing shows that Lamp16.1 mutants have no developmental delay. n indicates total number of pupae scored.
Figure 2.
Figure 2.
Lamp1 mutant fat body cells have strongly increased acidic structures. Compared to w1118 (A), fed 3rd instar FB of Lamp1e879 (B), and Lamp111B (C) show a strong increase of LTR staining, a phenotype that is rescued by a duplication including Lamp1 (D; quantified in I). (E, F) LTR staining is also increased in starved 3rd instar FB of Lamp1e879 mutants (compare E, F; quantified in I). (G, H) A similar increase in the acidic compartment is seen in adult fat body of Lamp111B mutants (compare G, H). Nuclei are in blue; grayscale images show LTR channel; scale bars: 20 µm. (I) Quantification LTR staining in larval fat body of indicated genotypes. One-way ANOVA (Tukey correction) for Fed P < 0.0001; Starved: T-test. (J) Human LAMP2A expressed under the control of Ubiquitin-Gal4 rescues lysotracker staining in Lamp1 mutants. One-way ANOVA (Tukey correction) P < 0.001. (K) Quantification LTR staining in adult fat body of indicated genotypes. T-test. (L) Mean percentages (with SEM) of colocalization of LTR structures with indicated GFP-Rab fusion proteins expressed in the larval FB of Lamp111B mutants. Red: LTR only; Green: GFP-Rab only; Yellow: double-positive structures. (M) Amyrel is normally induced upon starvation in Lamp1e879 mutant larvae (qPCR normalized to RpL32). Two-tailed T-test. (N) Mitf mRNA expression in the larval FB of indicated genotypes normalized to control (w1118). One-way ANOVA (Dunnett correction) P < 0.0001. *P < 0.05; **P < 0.01; *** P < 0.001; **** P < 0.0001; ns, not significant.
Figure 3.
Figure 3.
Lysosomal activity. (A-C) Sites of CtsB activity as measured by Magic Red assay are not significantly increased in FB of fed 3rd instar larvae (compare w1118 in A with Lamp16.1 (B) and Lamp111B (C); quantified in G). In contrast, under starved conditions (D-F), Lamp16.1 (E) and Lamp111B (F) have increased CtsB activity (compare to w1118 in D; quantified in G). Nuclei are in blue; grayscale images show Magic Red channel; scale bar: 20 µm. (G) Quantification of Magic Red puncta in FB of indicated genotypes. One-way ANOVA (Tukey correction) P < 0.001. (H) Normalized Acph-1 activity of lysates enriched for lysosomes of fed 3rd instar larvae of indicated genotypes. One-way ANOVA (Dunnett correction). * P < 0.05; **P < 0.01; ns, not significant.
Figure 4.
Figure 4.
Autophagic flux is normal in FB of Lamp1 mutants. (A,B) Under basal conditions, MA in 3rd instar FB is low and indistinguishable between Lamp16.1 heterozygous control (A), Lamp16.1/Lamp111B (B), and homozygous Lamp16.1 (quantified in E) mutants. (C, D) MA is normally induced by starvation in Lamp16.1 heterozygotes (C), Lamp16.1/Lamp111B (D), and homozygous Lamp16.1 (quantified in E). APs are labeled with GFP and mCherry, while GFP fluorescence is quenched by the acidic pH in autolysosomes, which are thus labeled in red only. (E) Quantification of GFP puncta (APs) and cherry only puncta (APs and APGLs) shows normal MA flux in Lamp1 mutants with no difference to controls. One-way ANOVA (Tukey correction) P < 0.001 (GFP) and P < 0.0001 (cherry only). (F, G) Snap29 (green) recruitment to APs (marked by mCherry-Atg8a; C-Atg8a; red) is normal in FB of Lamp16.1/ Lamp111B transheterozygote mutants and Lamp16.1 mutants (quantified in H; compare to heterozygotes in F; examples of APs are marked by yellow arrowheads). (H) Pearson’s correlation coefficient of colocalization of Snap29 with mCherry-Atg8a of indicated genotypes. One-way ANOVA (Dunnett correction) not significant. Nuclei are in blue; grayscale images show indicated channels; scale bars: 20 µm. (I) Lamp1e879 mutant adults have normal expression of the essential MA genes Atg5 and Atg8 (fed; normalized to RpL32). Two-tailed T-tests. **P < 0.01; ***P < 0.001; **** P < 0.0001; ns, not significant.
Figure 5.
Figure 5.
eMI induced by prolonged starvation is normal in Lamp16.1 mutants (compare starved Lamp16.1 heterozygous control (A) and homozygous Lamp16.1 mutant larval FB (B) with corresponding fed tissue (C, D). Grayscale images show eMI sensor; nuclei are in blue; scale bar 20 µm. (E) quantification of eMI sensor puncta per 3rd instar FB cells of indicated genotypes. One-way ANOVA (Tukey correction) P < 0.0001; ** P < 0.01; ns, not significant.
Figure 6.
Figure 6.
TEM analyses of Lamp1 mutant fat body. (A-E) Examples of autolysosomal structures of Lamp16.1 mutant (A-C) and WT (D) 3rd instar fed larval fat body. APGL: autophagolysosome; AL: autolysosome; L: lysosome; LD: lipid droplet. See also methods for structure definitions. Scale bars: 0.5 µm. Original full images are shown in Fig. S7. (F-H) Quantification of density (area per field of view) of APGLs (F), ALs (G), and lysosomes (H) under indicated conditions. Mann-Whitney tests. (I, K) Size distribution of Lysosomes (I) and APGLs (K) under indicated conditions. Mann-Whitney and Kolmogorov-Smirnov tests. * P < 0.05; **** P < 0.0001; ns: not significant.
Figure 7.
Figure 7.
Lamp1 mutant larvae have altered lipid levels. (A) Sterol levels are increased in Lamp1e879 mutants, an effect that is partially rescued by a duplication including Lamp1 (Dp). Two-tailed T-tests. (B-D) Compared to wildtype (B), Lamp1e879 mutant larvae (C) accumulated unesterified sterols as revealed by filipin staining (quantified in D). One-way Anova (Dunnett) P < 0.0001. (E) Triacylglycerols (TAG) are unaffected. (C) Levels of larval DAGs and their indicated subclasses in Lamp1e879 mutants. Note the rescue by Lamp1Dp. One-way ANOVA (Tukey correction) significance levels are indicated below the X-axis. Unless indicated, changes are not significant (ns). * P < 0.05; ** P < 0.01; **** P < 0.0001.

References

    1. Herb M, Gluschko A, Schramm M.. LC3-associated phagocytosis - The highway to hell for phagocytosed microbes. Semin Cell Dev Biol. 2020. May;101:68–76. - PubMed
    1. Pohl C, Dikic I. Cellular quality control by the ubiquitin-proteasome system and autophagy. Science. 2019. Nov 15;366(6467):818–822. - PubMed
    1. Pryor PR, Luzio JP. Delivery of endocytosed membrane proteins to the lysosome. Biochim Biophys Acta. 2009. Apr;1793(4):615–624. - PubMed
    1. Ballabio A, Bonifacino JS. Lysosomes as dynamic regulators of cell and organismal homeostasis. Nat Rev Mol Cell Biol. 2020. Feb;21(2):101–118. - PubMed
    1. Savini M, Zhao Q, Wang MC. Lysosomes: Signaling hubs for metabolic sensing and longevity. Trends Cell Biol. 2019. Nov;29(11):876–887. - PMC - PubMed

Publication types

MeSH terms

LinkOut - more resources