. 2022 Dec 15;33(1):207-221.
doi: 10.1093/cercor/bhac062.

Control over sampling boosts numerical evidence processing in human decisions from experience

Affiliations

Control over sampling boosts numerical evidence processing in human decisions from experience

Stefan Appelhoff et al. Cereb Cortex. .

Abstract

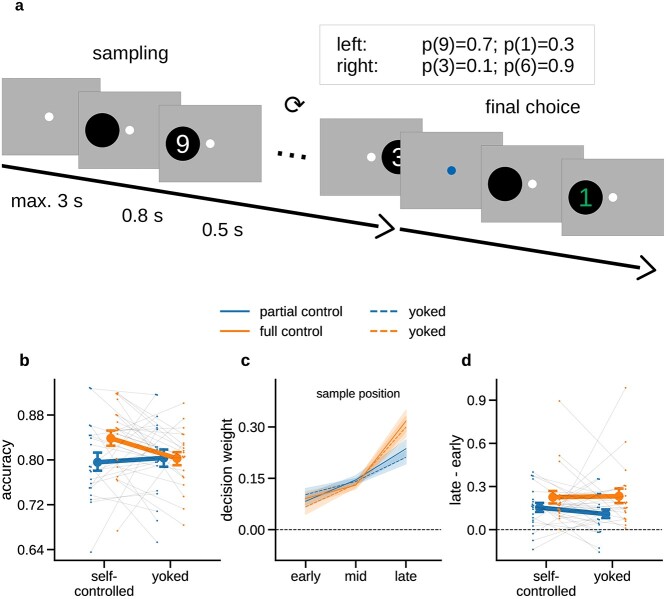
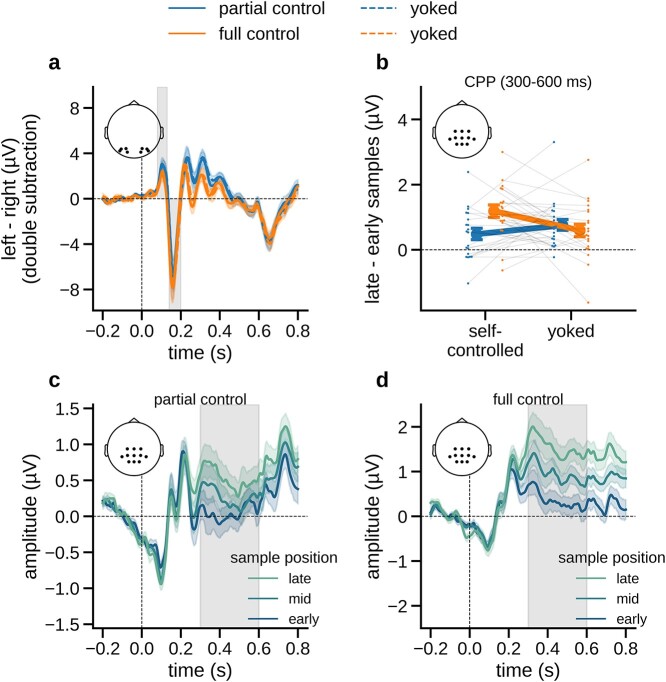
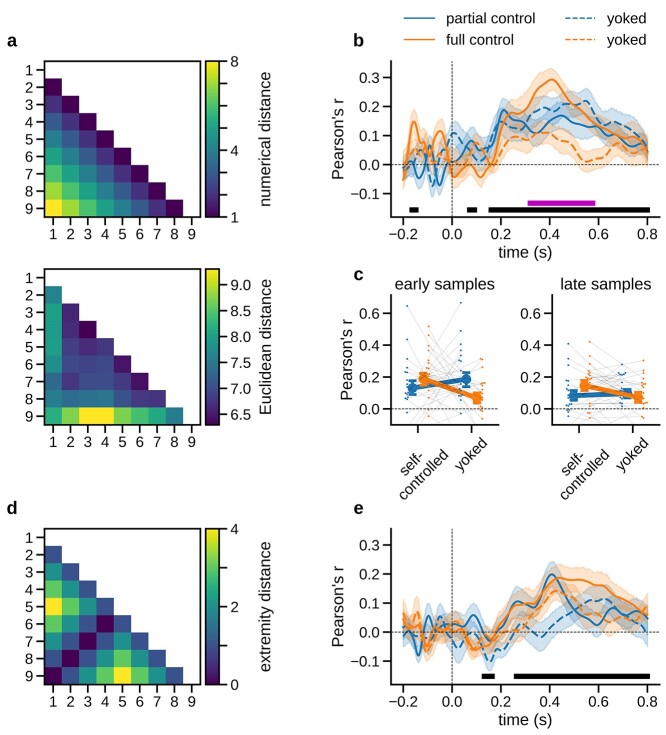
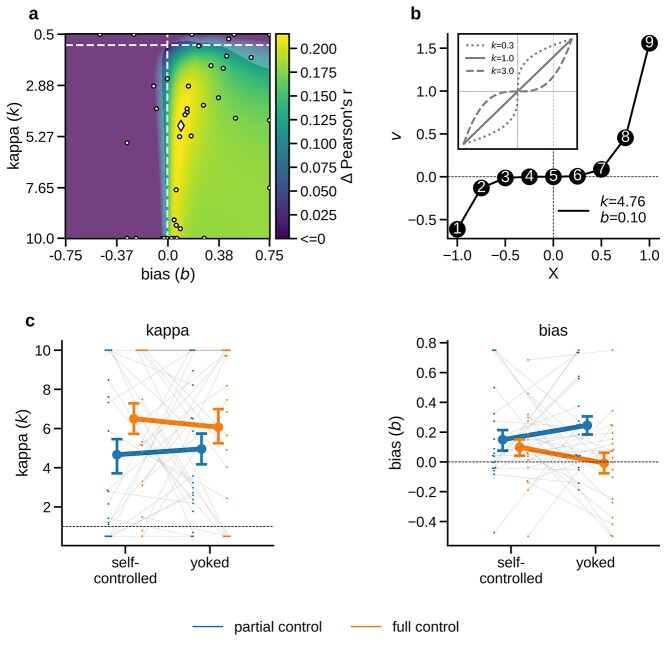
When acquiring information about choice alternatives, decision makers may have varying levels of control over which and how much information they sample before making a choice. How does control over information acquisition affect the quality of sample-based decisions? Here, combining variants of a numerical sampling task with neural recordings, we show that control over when to stop sampling can enhance (i) behavioral choice accuracy, (ii) the build-up of parietal decision signals, and (iii) the encoding of numerical sample information in multivariate electroencephalogram patterns. None of these effects were observed when participants could only control which alternatives to sample, but not when to stop sampling. Furthermore, levels of control had no effect on early sensory signals or on the extent to which sample information leaked from memory. The results indicate that freedom to stop sampling can amplify decisional evidence processing from the outset of information acquisition and lead to more accurate choices.

Keywords: active sampling; decision-making; electroencephalography; information search; number processing.


Figures

Fig. 1
Fig. 1
Experimental task and behavioral results. a) Schematic illustration of an example trial. Participants were asked to decide which of 2 choice options (left or right) would yield a larger numerical outcome. Before committing to a choice, participants could draw up to 19 samples (full control group) or were required to draw a fixed number of 12 samples (partial control group). Samples are shown as white digits; the final choice outcome is shown in green. The inset table shows the outcome values and probabilities for the 2 choice options in the example trial. In yoked baseline conditions, participants judged replays of previously recorded sampling streams. b) Mean accuracy (proportion of times the option with the higher mean of samples was chosen) in each condition. c) Decision weights (see Materials and Methods) of samples occurring early, mid, or late in the sampling sequence, for each sampling condition. d) Difference in decision weight between late and early samples. Higher values indicate that late samples had a stronger relative influence on choice than early samples (“recency” effect). Error indicators in all panels show SE.
Fig. 2
Fig. 2
Univariate EEG results with ERPs time-locked to number sample onset. a) Early visual ERPs (left − right stimuli, right channels subtracted from left channels) in each sampling condition. Gray shadings indicate time windows of the P1 and N1 components, respectively (80–130 ms and 140–200 ms). b) The difference in centro-parietal (CPP) amplitudes between samples occurring late versus early in the trial (see panels c and d), plotted separately for each sampling condition (including yoked). c) The “ramping up” of CPP amplitudes (0.3–0.6 s) over early, mid, and late samples in the partial control condition. Gray shadings indicate the time window from which average amplitudes were extracted in panel b. d) Same as c, for the full control condition. Error indicators in all panels show SE.
Fig. 3
Fig. 3
RSA results. a) Upper: Model RDM reflecting the pairwise numerical distance between sample values. Lower: Grand mean ERP-RDM averaged across participants and sampling conditions in a representative time window between 300 and 600 ms after sample onset. b) Time course of numerical distance effects in multivariate ERP patterns, plotted separately for each sampling condition. Black bar indicates time windows of significant numerical distance encoding (collapsed across sampling conditions). Purple bar indicates the time window of significant differences between sampling conditions (interaction effect, see Results). c) Mean numerical distance effects by condition. Left: First half of samples in each choice trial. Right: Second half. d) Model RDM reflecting the sample values’ extremity in terms of their absolute distance from the midpoint of the sample range (i.e. 5). e) Time course of extremity encoding in multivariate ERPs, plotted separately for each sampling condition. All error bars and shadings show SE.
Fig. 4
Fig. 4
Neurometric distortions. a) Grand mean neurometric map, combined across all task conditions. Color scale indicates increase of encoding strength in multivariate ERPs (formula image, averaged over distance- and extremity models) as a function of nonlinear distortions of numerical value (formula image: compression; formula image: anti-compression, formula image: bias). Dashed lines indicate linear (formula image) and unbiased (formula image) models. Parts of the map that are not overlaid with an opaque mask contain values with a significant increase relative to unbiased linear encoding (P < 0.001, corrected using false discovery rate). White markers show maxima (diamond: mean; dots, individual participants). b) Neurometric function, parameterized according to the maximum mean correlation identified in a. Inset plots illustrate exemplary compressive (formula image < 1), linear (formula image = 1), and anti-compressive (formula image > 1) distortions. c) Neurometric parameter estimates in the individual sampling conditions, left: exponent (formula image); right: bias (formula image); see Methods and Results for details. Error bars show SE.

References

    1. Anderson NH. Test of a model for number-averaging behavior. Psychon Sci. 1964:1:191–192.
    1. Ansari D, Garcia N, Lucas E, Hamon K, Dhital B. Neural correlates of symbolic number processing in children and adults. Neuroreport. 2005:16:1769–1773. - PubMed
    1. Appelhoff S, Sanderson M, Brooks TL, Vliet M v, Quentin R, Holdgraf C, Chaumon M, Mikulan E, Tavabi K, Höchenberger R, et al. MNE-BIDS: organizing electrophysiological data into the BIDS format and facilitating their analysis. J Open Source Softw. 2019:4:1896. - PMC - PubMed
    1. Chambon V, Théro H, Vidal M, Vandendriessche H, Haggard P, Palminteri S. Information about action outcomes differentially affects learning from self-determined versus imposed choices. Nat Hum Behav. 2020:4:1–13. - PubMed
    1. Cheadle S, Wyart V, Tsetsos K, Myers N, de Gardelle V, Herce Castañón S, Summerfield C. Adaptive gain control during human perceptual choice. Neuron. 2014:81:1429–1441. - PMC - PubMed

Publication types