. 2022 Mar 15;149(6):dev199637.
doi: 10.1242/dev.199637. Epub 2022 Mar 17.

A constitutively expressed fluorescent ubiquitination-based cell-cycle indicator (FUCCI) in axolotls for studying tissue regeneration

Affiliations

A constitutively expressed fluorescent ubiquitination-based cell-cycle indicator (FUCCI) in axolotls for studying tissue regeneration

Timothy J Duerr et al. Development. .

Abstract

Regulation of cell cycle progression is essential for cell proliferation during regeneration following injury. After appendage amputation, the axolotl (Ambystoma mexicanum) regenerates missing structures through an accumulation of proliferating cells known as the blastema. To study cell division during blastema growth, we generated a transgenic line of axolotls that ubiquitously expresses a bicistronic version of the fluorescent ubiquitination-based cell-cycle indicator (FUCCI). We demonstrate near-ubiquitous FUCCI expression in developing and adult tissues, and validate these expression patterns with DNA synthesis and mitosis phase markers. We demonstrate the utility of FUCCI for live and whole-mount imaging, showing the predominantly local contribution of cells during limb and tail regeneration. We also show that spinal cord amputation results in increased proliferation at least 5 mm from the site of injury. Finally, we use multimodal staining to provide cell type information for cycling cells by combining fluorescence in situ hybridization, EdU click-chemistry and immunohistochemistry on a single FUCCI tissue section. This new line of animals will be useful for studying cell cycle dynamics using in situ endpoint assays and in vivo imaging in developing and regenerating animals.

Keywords: Axolotl; Cell cycle; FUCCI; Regeneration.


Conflict of interest statement

Competing interests The authors declare no competing or financial interests.

Figures
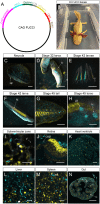
Fig. 1.
Fig. 1.
FUCCI probes are expressed in developing and adult homeostatic tissue. (A) Plasmid map for the CAG-FUCCI construct. (B) A sexually mature, F0 FUCCI female that was crossed with white d/d males to generate the F1 clutch used in the study. (C) Stage 17 neurula expressing FUCCI probes. NF, neural fold. Scale bar: 500 µm. (D) Stage 32 larva. S, somite. Scale bar: 1 mm. (E) Six stage 42 larvae with negative, ubiquitous and variable expression patterns. Scale bar: 5 mm. (F) Individual stage 42 larva. M, myomeres. Scale bar: 1 mm. (G) Posterior tail tip of a stage 45 larva. Scale bar: 500 µm. (H) Torso of a stage 45 larva. LB, limb bud; H, heart. Scale bar: 500 µm. (I) Subventricular zone of the adult brain. V, ventricle. Scale bar: 50 µm. (J) Adult retina. CMZ, ciliary marginal zone. Scale bar: 100 µm. (K) Adult heart ventricle. Scale bar: 100 µm. (L) Adult liver. Scale bar: 50 µm. (M) Adult spleen. Scale bar: 50 µm. (N) Adult gut. C, crypt. Scale bar: 200 µm. Individual channels for I-N are available with EdU staining in Fig. S1. Organs from I-N were harvested from 10-12 cm animals aged 9 months.
Fig. 2.
Fig. 2.
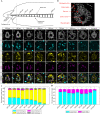
Validation of FUCCI expression with EdU and pHH3. (A) Schematic of the cell cycle with expected staining patterns of EdU and pHH3. EdU may label cells in early G2 as a result of a 3 h chase and pHH3 weakens during late M phase. Letters at the outer edge of the schematic represent the stage in the cell cycle of cells from D-M. (B) Characterization of EdU+ cells in 14 dpa regenerating spinal cords (n=9). (C) Characterization of pHH3+ cells in 10 dpa regenerating limb blastemas (n=3). (D-L″″) Individual cells from EdU-pulsed spinal cords at every cell cycle stage. Scale bars: 5 µm. (M-M″″) Individual cell in M stage from a limb blastema stained for pHH3. Scale bar: 5 µm. Tissue from B-M″″ was harvested from 8-10 cm animals aged 6 months.
Fig. 3.
Fig. 3.
Continuous live imaging of FUCCI tissue. (A-E) A 2-h time-lapse shown in five 30-min intervals of a dividing epithelial cell from a stage 32 larva. P, pigment cell; MS, mitotic spindle; C, cytokinesis; D1, daughter cell 1; D2, daughter cell 2. Scale bar: 25 µm. (F-I) Four frames from the 60 h live image that depict a regenerating tail ∼30 min after amputation (F), after wound healing (G), during blastema formation (H) and during blastema growth (I). The red vertical dashed line represents the amputation plane. B, blastema; M, myomeres. Scale bar: 50 µm. (J-M) Tracks depicting cell migration in F-I. Each line represents the path a cell took 20 frames before the current frame and 20 frames after. (N,O) Charts depicting mAG raw integrated density/area (N) or mCherry raw integrated density/area (O) for seven frames from the 60 h live image. Measurements were obtained by dividing the AP axis of the regenerating tail into boxes with a width of 30 µm (Fig. S4). The vertical dashed line represents the amputation plane.
Fig. 4.
Fig. 4.
Multimodal imaging of FUCCI tissue for cell-type characterization and identification of cycling cells. (A) Schematic of the staining timeline used for multimodal imaging in a homeostatic spinal cord. (B) Round one of imaging for endogenous FUCCI signal and Shh RNA with V3.HCR-FISH. Scale bar: 50 µm. (C) Round one of imaging after photobleaching. The red square in the panel represents the area photobleached. (D) Round two of imaging for Pax7 and B3Tub RNA with V3.HCR-FISH. The intense signal in the white matter is autofluorescence. (E) Round three of imaging for EdU labeled cells with click-chemistry. (F) Round four of imaging for B3TUB protein with IHC. (G) Endogenous FUCCI signal in the spinal cord. (H) Pax7, B3Tub RNA and Shh V3.HCR-FISH signal from rounds one and two. (I) mAG expression and EdU labeling from rounds one and three. (J) B3Tub RNA and B3TUB protein from rounds two and four. DAPI image used for B-J was obtained in round one. Tissue was harvested ∼1 cm from the end of the tail from an 8 cm animal aged 6 months.
Fig. 5.
Fig. 5.
FUCCI visualization and quantification during limb regeneration. (A-G) Bright-field images of uninjured (A) and regenerating FUCCI limb amputated through the wrist at 1, 3, 5, 7, 10 and 14 dpa (B-G) (n=5 2 cm animals aged 2 months). Scale bars: 500 µm. (A′-G′) mAG and mCherry fluorescence of limbs from A-G. (H-N) 3D whole-mount images of FUCCI limbs obtained by light-sheet fluorescence microscopy. Scale bars: 600 µm in each axis.
Fig. 6.
Fig. 6.
Limb denervation arrests blastema cells in G1 phase. (A-B‴) Individual channels for innervated limbs (A-A‴) and limbs denervated 48 h earlier (B-B‴). Scale bar: 2.0 mm. (C,D) Scatter plots of mAG versus mCherry fluorescent blastema cells from innervated (C) and denervated (D) FUCCI limbs (n=11, 15-18 cm animals aged 1 year). Gates were established as described in the Materials and Methods. (E,F) Tables depicting the percentage of blastema cells within each gate out of the total number of blastema cells.
Fig. 7.
Fig. 7.
Spinal cord amputation induces a proliferative response 5 mm from the amputation plane at 14 dpa. (A) Schematic of the experiment. (B) Cell types of the spinal cord. Scale bar: 25 µm. (C-K″″) Individual channels for spinal cord cross-sections pulsed with EdU (n=4 for regenerating spinal cords, n=5 for uninjured spinal cords, 8-10 cm animals aged 6 months). Scale bars: 25 µm for C-J″″; 50 µm for K-K″″. (L) Total cell quantification across the regenerating AP axis. (M) mAG+ cell characterization across the regenerating AP axis. Data are mean±s.e.m.

References

    1. Abe, T., Sakaue-Sawano, A., Kiyonari, H., Shioi, G., Inoue, K.-I., Horiuchi, T., Nakao, K., Miyawaki, A., Aizawa, S. and Fujimori, T. (2013). Visualization of cell cycle in mouse embryos with Fucci2 reporter directed by Rosa26 promoter. Development 140, 237-246. 10.1242/dev.084111 - DOI - PubMed
    1. Alvarez, R., Jr, Wang, B. J., Quijada, P. J., Avitabile, D., Ho, T., Shaitrit, M., Chavarria, M., Firouzi, F., Ebeid, D., Monsanto, M. M.et al. (2019). Cardiomyocyte cell cycle dynamics and proliferation revealed through cardiac-specific transgenesis of fluorescent ubiquitinated cell cycle indicator (FUCCI). J. Mol. Cell. Cardiol. 127, 154-164. 10.1016/j.yjmcc.2018.12.007 - DOI - PMC - PubMed
    1. Bouldin, C. M. and Kimelman, D. (2014). Dual fucci: a new transgenic line for studying the cell cycle from embryos to adults. Zebrafish 11, 182-183. 10.1089/zeb.2014.0986 - DOI - PMC - PubMed
    1. Butler, E. G. (1933). The effects of X-radiation on the regeneration of the fore limb of Amblystoma larvae. J. Exp. Zool. 65, 271-315. 10.1002/jez.1400650302 - DOI
    1. Chen, C.-H., Puliafito, A., Cox, B. D., Primo, L., Fang, Y., Di Talia, S. and Poss, K. D. (2016). Multicolor cell barcoding technology for long-term surveillance of epithelial regeneration in Zebrafish. Dev. Cell 36, 668-680. 10.1016/j.devcel.2016.02.017 - DOI - PMC - PubMed

Publication types