. 2022 Sep 13;226(5):766-777.
doi: 10.1093/infdis/jiac091.

Contribution of Coronavirus-Specific Immunoglobulin G Responses to Complement Overactivation in Patients with Severe Coronavirus Disease 2019

Affiliations

Contribution of Coronavirus-Specific Immunoglobulin G Responses to Complement Overactivation in Patients with Severe Coronavirus Disease 2019

Priscila M S Castanha et al. J Infect Dis. .

Abstract

Background: Excessive complement activation has been implicated in the pathogenesis of coronavirus disease 2019 (COVID-19), but the mechanisms leading to this response remain unclear.

Methods: We measured plasma levels of key complement markers, severe acute respiratory syndrome coronavirus 2 (SARS-CoV-2) RNA and antibodies against SARS-CoV-2 and seasonal human common cold coronaviruses (CCCs) in hospitalized patients with COVID-19 of moderate (n = 18) and critical severity (n = 37) and in healthy controls (n = 10).

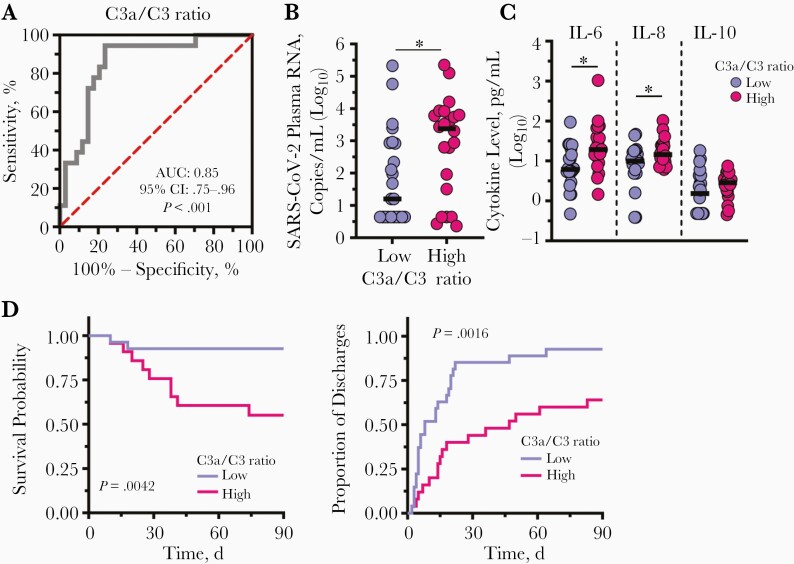
Results: We confirmed that complement activation is systemically increased in patients with COVID-19 and is associated with a worse disease outcome. We showed that plasma levels of C1q and circulating immune complexes were markedly increased in patients with severe COVID-19 and correlated with higher immunoglobulin (Ig) G titers, greater complement activation, and higher disease severity score. Additional analyses showed that the classical pathway was the main arm responsible for augmented complement activation in severe patients. In addition, we demonstrated that a rapid IgG response to SARS-CoV-2 and an anamnestic IgG response to the nucleoprotein of the CCCs were strongly correlated with circulating immune complex levels, complement activation, and disease severity.

Conclusions: These findings indicate that early, nonneutralizing IgG responses may play a key role in complement overactivation in severe COVID-19. Our work underscores the urgent need to develop therapeutic strategies to modify complement overactivation in patients with COVID-19.

Keywords: COVID-19; SARS-CoV-2; and antibodies; classical pathway; common cold coronaviruses; complement system.


Conflict of interest statement

Potential conflicts of interest. U. B. N. reports grants from the National Science Foundation, and Texas A&M Institute of Data Science, and book royalties from Springer, un­related to the current work. J. M. reports grants from the National Institutes of Health (NIH), USAID, Gilead Sciences, and Janssen Pharmaceuticals; serves or has served as a consultant for Gilead Sciences, Accelevir Diagnostics, and Xi’an Yufan Biotechnologies; owns share options in Co-Crystal Pharmaceuticals and Infectious Diseases Connect; and is a shareholder of Abound Bio. His holdings in Co-Crystal Pharmaceuticals, Infectious Diseases Connect, and Abound Bio are unrelated to the current work. A. M. reports grants from the National Heart, Lung, and Blood Institute and the National Institute of Allergy and Infectious Diseases, NIH during the conduct of the study; B. J. M. reports grants from Bayer Pharmaceuticals, the Translational Breast Cancer Research Consortium, and the UPMC Learning While Doing Program, during the conduct of the study; consulting fees from Boehringer Ingelheim, the VeraMedica Institute; and the Patient-Centered Outcomes Research Institute for the ACCOMPLISH Trial, outside the submitted work. F. S. reports grants from the National Institute of General Medical Sciences, NIH, during the conduct of the study. B. J. C. M. reports grants from NIH and Gilead Sciences during the conduct of the study. D. B. reports leadership roles as president and board chair of Epistemix, director of the Magee Women’s Research Institute, and member of the Allegheny County Board of Health, unrelated to the current work, and is also a shareholder of Epistemix, unrelated to the current work. All other authors report no potential conflicts. All authors have submitted the ICMJE Form for Disclosure of Potential Conflicts of Interest. Conflicts that the editors consider relevant to the content of the manuscript have been disclosed.

Figures

Figure 1.
Figure 1.
Markers of complement activation are increased in patients with coronavirus disease 2019 (COVID-19) and are associated with disease severity. Plasma levels of various markers of complement activation were quantified in critically ill patients hospitalized in intensive care units (ICU patients; n = 37) and moderately ill patients hospitalized in dedicated COVID-19 wards (non-ICU patients; n = 18). Plasma samples from healthy controls (HCs; n = 10) were included as a reference population for comparisons. Scatterplots show the differences between HCs and non-ICU and ICU patients in the following plasma levels and ratios: C3, C3a, and C3a/C3 (A); C5, C5a, and C5a/C5 ratio (B); and soluble C5b-9 (sC5b-9) (C). Each symbol in the scatterplots represents an individual patient, and horizontal lines represent medians. Statistical significance was determined using Kruskal-Wallis 1-way analysis of variance (#P < .05; ##P < .01; ###P < .001; ####P < .0001) or the Mann-Whitney U test (*P < .05; **P < .01; ***P < .001; ****P < .0001).
Figure 2.
Figure 2.
Relationship between complement activation, viral RNA levels, and clinical laboratory markers of inflammation. A, Receiver operating characteristic curve (ROC) analysis for C3a/C3 ratio as a predictor for coronavirus disease 2019 (COVID-19) severity. A C3a/C3 ratio threshold ≥4.5 log10 provided a sensitivity of 94.4% and a specificity of 7.06%. Abbreviations: AUC area under the ROC curve; CI, confidence interval. B, C, Scatterplots of the differences in severe acute respiratory syndrome coronavirus 2 (SARS-CoV-2) plasma RNA (B) and inflammatory cytokine (C) levels between patients classified as having low (C3a/C3 ratio, <4.5 log10) or high (C3a/C3 ratio, ≥4.5 log10) complement activation. Each symbol in the scatterplots represents an individual patient, and horizontal lines represent medians. Abbreviations: IL-6, IL-8, and IL-10, interleukin 6, 8, and 10. *P < .05 (Mann-Whitney U test). D, Kaplan-Meier curves for 90-day survival and time to discharge from hospital admission, stratified by low versus high complement activation.
Figure 3.
Figure 3.
Markers of complement activation by the classical pathway are significantly increased in patients with severe coronavirus disease 2019 (COVID-19). Plasma levels of markers of complement initiation and regulatory proteins unique to each individual arm (alternative, lectin, and classical pathways) of the complement system were quantified in critically ill patients hospitalized in intensive care units (ICU patients; n = 37) and moderately ill patients hospitalized in dedicated COVID-19 wards (non-ICU patients; n = 18). Plasma samples from healthy controls (HCs; n = 10) were included as a reference population for comparisons. A–C, Scatterplots of the differences in plasma levels of markers of the alternative pathway, including factor D, Bb, factor H, and factor H–factor D ratio (A); functional mannose-binding lectin (MBL) of the lectin pathway (B); and markers of the classical pathway, (C) including total human C1q, circulating immune complexes (CICs) binding to C1q (CIC-C1q), and C1 inhibitor (C). D, Scatterplots of the differences in CIC-C1q between patients classified as having low (C3a/C3 ratio, <4.5 log10) or high (C3a/C3 ratio, ≥4.5 log10) complement activation. Each symbol in the scatterplots represents an individual patient, and horizontal lines represent medians. Statistical significance was determined using Kruskal-Wallis 1-way analysis of variance (###P < .001; ####P < .0001) or the Mann-Whitney U test (*P < .05; **P < .01; ***P < .001).
Figure 4.
Figure 4.
Binding immunoglobulin (Ig) G and IgA, and neutralizing antibody titers against severe acute respiratory syndrome coronavirus 2 (SARS-CoV-2) are markedly increased in patients with severe coronavirus disease 2019. A–C, Scatterplots of the differences in plasma titers of binding IgG and IgA against the spike protein and the nucleoprotein (NP) of SARS-CoV-2 between intensive care unit (ICU) and non-ICU patients, regardless of time from illness onset (A) and stratified by days after symptom onset (B, C). D, Titers of neutralizing antibodies estimated by plaque reduction neutralization test (PRNT), regardless of time from illness onset and stratified by days after symptom onset. Each symbol in the scatterplots represents an individual patient, and horizontal lines represent medians. *P < .05; **P < .01; ***P < .001 (Mann-Whitney U test).
Figure 5.
Figure 5.
Binding immunoglobulin (Ig) G and IgA, and neutralizing antibody titers against severe acute respiratory syndrome coronavirus 2 (SARS-CoV-2) are associated with complement activation in patients with severe coronavirus disease 2019 (COVID-19). A, Degree of correlation between plasma levels of circulating immune complexes (CIC-C1q) and binding IgG against the spike and nucleoprotein (NP) and neutralizing antibody titers, assessed using the Spearman rank correlation coefficient test. B, Scatterplots of the differences in IgG/IgA ratios between intensive care unit (ICU) and non-ICU patients with COVID-19. Abbreviation: PRNT, plaque reduction neutralization test. C, Scatterplots of binding titers of IgG against spike protein and NP, neutralizing antibody titers, and binding titers of IgA against spike protein and NP, stratified by the C3a/C3 ratio as low (C3a/C3 ratio, <4.5 log10) or high (C3a/C3 ratio, ≥4.5 log10) complement activation. Each symbol in the scatterplots represents an individual patient, and horizontal lines represent medians. *P < .05; **P < .01 (Mann-Whitney U test). D, Linear discriminant analysis using all measurements for complement and SARS-CoV-2 antibody, showing a 2-dimensional discriminator using CIC-C1q and the C3a/C3 ratio.
Figure 6.
Figure 6.
Binding immunoglobulin (Ig) G titers against various antigens of the common cold coronaviruses (CCCs) are higher in patients with severe coronavirus disease 2019 (COVID-19) and are also associated with complement activation. A, Scatterplots of the differences in plasma titers of binding IgG against the spike protein and the nucleoprotein (NP) of various CCCs (NL63, 229E, OC43, and HKU1) and the spike protein of severe acute respiratory syndrome coronavirus (SARS-CoV) between intensive care unit (ICU) and non-ICU patients. Plasma samples from patients who were hospitalized in ICU wards with respiratory illness not related to severe acute respiratory syndrome coronavirus (SARS-CoV-2) infection were included as a group for comparisons (non–COVID 19 ICU; n = 20). Scatterplots of the differences in plasma titers of binding IgG against the spike protein of CCCs and of SARS-CoV (B) and against the NP of the CCCs (C), stratified by the C3a/C3 ratio as low (C3a/C3 ratio, <4.5 log10) or high (C3a/C3 ratio, ≥4.5 log10) complement activation. Each symbol in the scatterplots represents an individual patient, and horizontal lines represent medians. Statistical significance was determined using Kruskal-Wallis 1-way analysis of variance (#P < .05; ##P < .01; ###P < .001) and the Mann-Whitney U test (*P < .05; **P < .01; ***P < .001). D, Degree of correlation between plasma levels of circulating immune complexes (CIC-C1q) and IgG titers to CCC NP, assessed using the Spearman rank correlation coefficient test.

References

    1. Holter JC, Pischke SE, Boer de E, et al. . Systemic complement activation is associated with respiratory failure in COVID-19 hospitalized patients. Proc Natl Acad Sci U S A 2020; 117:25018–25. - PMC - PubMed
    1. Fang S, Wang H, Lu L, Jia Y, Xia Z.. Decreased complement C3 levels are associated with poor prognosis in patients with COVID-19: a retrospective cohort study. Int Immunopharmacol 2020; 89:107070. - PMC - PubMed
    1. Ramlall V, Thangaraj PM, Meydan C, et al. . Immune complement and coagulation dysfunction in adverse outcomes of SARS-CoV-2 infection. Nat Med 2020; 26:1609–15. - PMC - PubMed
    1. Zhang J, Wang Z, Wang X, Hu Z, Yang C, Lei P.. Risk factors for mortality of COVID-19 patient based on clinical course: a single center retrospective case-control study. Front Immunol 2021; 12:1–11. - PMC - PubMed
    1. Henry BM, Szergyuk I, Oliveira MHS, et al. . Complement levels at admission as a reflection of coronavirus disease 2019 (COVID-19) severity state. J Med Virol 2021; 93:5515–22. - PMC - PubMed

Publication types