. 2022 Mar 4;14(5):1317.
doi: 10.3390/cancers14051317.

Role of Neural (N)-Cadherin in Breast Cancer Cell Stemness and Dormancy in the Bone Microenvironment

Affiliations

Role of Neural (N)-Cadherin in Breast Cancer Cell Stemness and Dormancy in the Bone Microenvironment

Antonio Maurizi et al. Cancers (Basel). .

Abstract

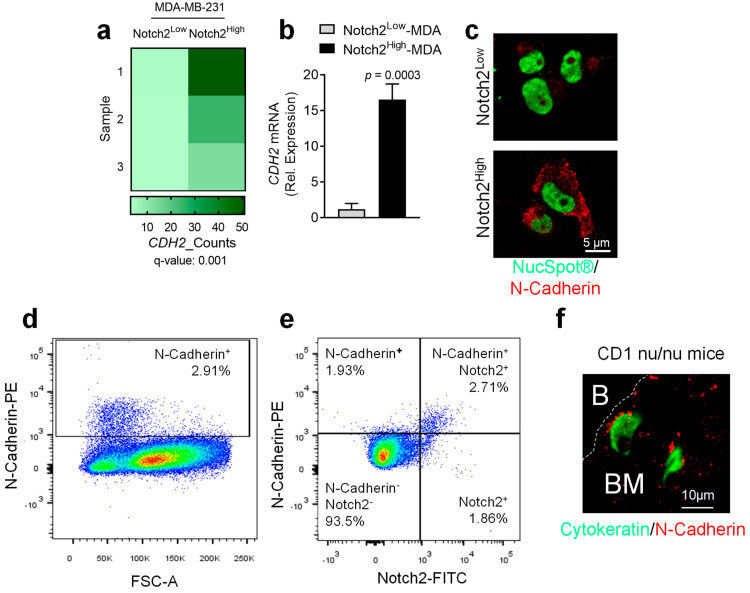
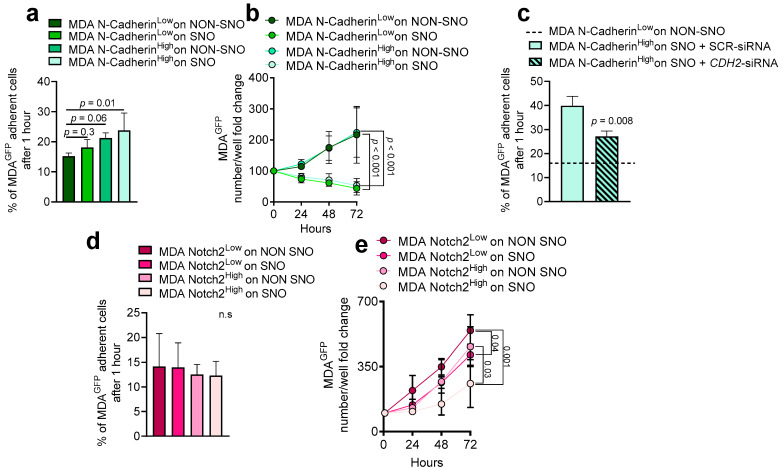
Breast cancer cells that interact with spindle-shaped N-Cadherin+ Osteoblasts (SNOs) are recognised to become dormant through a Notch2-dependent mechanism. We found that Notch2High human BrCa MDA-MB231 (MDA) cells also expressed high level of N-Cadherin. This prompted us to hypothesize that N-Cadherin could have a role in MDA-SNO interaction. Of note, the expression of N-Cadherin in MDA cells reduced tumour incidence and bone osteolysis in BrCa mouse model. Moreover, similarly to Notch2High MDA cells, the N-CadherinHigh MDA cells revealed a high expression of the canonical Haematopoietic Stem cell (HSC) markers, suggesting an HSC mimicry, associated with higher ability to form mammospheres. Interestingly, N-CadherinHigh MDA cells showed greater capacity to adhere to SNOs, while the inhibition of SNO-mediating MDA cell proliferation was unremarkable. To investigate whether these features were shared by mouse BrCa, we used the 4T1 cell line in which N-Cadherin expression was abolished and then rescued. At variance with MDA cells, 4T1 cells expressing N-Cadherin revealed that the latter was associated with a lower expression of the HSC marker, Cxcr4, along with a lower capacity to form mammospheres. Furthermore, the rescue of N-Cadherin expression increased cell-cell adhesion and reduced proliferation of 4T1 cells when they were co-plated with SNOs. In conclusion, we demonstrated that: (i) N-CadherinHigh and Notch2High MDA cells showed similar HSC mimicry and dormancy features; (ii) N-Cadherin mediated BrCa-SNO adhesion; (iii) N-Cadherin had a positive Notch2-dependent role on SNO-induced dormancy and HSC mimicry in MDA cells, and a negative role in 4T1 cell stemness and HSC mimicry.

Keywords: BrCa dormancy; HSC-mimicry; bone microenvironment; cancer stem cells; endosteal niche; osteoblasts.


Conflict of interest statement

The authors declare no potential conflict of interest.

Figures

Figure 1
Figure 1
Analysis of N-Cadherin expression in Notch2High MDA-MB-231 human BrCa cells. Total MDA-MB-231 (MDA) BrCa cells were MACS-sorted into Notch2High and Notch2Low subpopulations and the isolated RNA was subjected to RNA deep sequencing (RNA dSeq) analysis. (a) Heat map showing CDH2 expression in Notch2High and Notch2Low MDA cells. (b) Real-time RT-PCR performed using a specific primer pair for human CDH2. Human GAPDH was used to normalize gene expression. (c) Immunofluorescence staining performed on MACS-sorted Notch2High and Notch2Low MDA subpopulation to evaluate the expression of the N-Cadherin protein (red). NucSpot® reagent was used to stain the nuclei (green). (d,e) Flow cytometry analysis of MDA cells stained with antibodies for N-Cadherin and Notch2. (f) Paraffin-embedded tibia sections harvested from CD1 nu/nu female mice intratibially injected with MDA cells for 4 weeks [12] were double-stained with antibodies for Cytokeratin (green) and N-Cadherin (red). B: bone; BM: bone marrow. (c,e) Scale bars are shown in the pictures. Data are the mean ± SD and pictures are representative of (a) three independent RNA dSeq datasets, (bd) three independent cell cultures or (e) three mice. Statistical analysis: (a) FDR-adjusted p-value, (b) Student’s t-test.
Figure 2
Figure 2
In vivo analysis of N-CadherinHigh in MDA BrCa cells. (a) Four-week old Balb-c nu/nu female mice were intratibially injected with 1 × 10⁴ MDA cells and MACS-sorted into N-CadherinHigh and N-CadherinLow subpopulations. (b) After 4 weeks, mice were sacrificed and tibial osteolytic lesion incidence and (c,d) area were analysed by X-rays while (e) µCT was used to visualize the 3D morphology and (f) to measure the cortical volume in the tibia of the injected-mice. (g) Paraffin-embedded livers isolated from MDA N-CadherinHigh and N-CadherinLow-injected mice stained with haematoxylin and eosin to quantify (h) the multicellular liver metastases area over tissue area (%) and (i) the number of multicellular liver metastases over square millimetres by the ImageJ® software. (j) Four-week old Balb-c nu/nu female mice were intratibially injected with 1 × 10⁴ MDA cells MACS-sorted into N-CadherinHigh and N-CadherinLow subpopulations and sacrificed 3- and (k) 7-days post-injection. (l) Paraffin-embedded tibias were harvested from the injected mice immuno-stained for cytokeratin to visualize the tumour cell in the bone tissue and measure the cell distribution in relation to the endosteum, and (m) the number of cells in the endosteal niche at the indicated time points. Data are the mean ± SD and pictures are representative of 4–6 mice per group. Statistical analysis: (b) χ square analysis, (d,f,h,i,l,m) Student’s t-test, (j,k) Gaussian curve regression fitting and F-test. Scale bars are shown in the pictures.
Figure 3
Figure 3
Role of N-Cadherin and Notch2 in MDA-SNO interaction in vitro. (a) N-CadherinHigh and N-CadherinLow MDAGFP cells were seeded onto MACS-sorted SNOs and NON-SNOs and allowed to attach for 1 h at 37 °C, followed by extensive washing. Number of MDAGFP cells was assessed after 1h of adhesion and (b) after 24–72 h of co-culture. (c) N-CadherinHigh and N-CadherinLow MDAGFP cells, treated with siRNA against the N-Cadherin (CDH2-siRNA) or scrambled (SCR-siRNA), were seeded onto MACS-sorted SNOs and NON-SNOs. The number of MDAGFP cells was assessed after 1h of adhesion. (d) Notch2High and Notch2Low MDAGFP cells were seeded onto MACS-sorted SNOs and NON-SNOs and allowed to attach for 1 h at 37 °C, followed by extensive washing. The number of MDAGFP cells was assessed after 1h of adhesion and (e) after 24–72 h of co-culture. In (b,d) cell number per well was normalized for time 0 (number of cells after 1 h of adhesion). Data are the mean ± SD of 4 independent cell preparations. Statistical analysis: (a,c,d) Student’s t-test, (b,e) Non-linear regression fitting and F-test.
Figure 4
Figure 4
Role of N-Cadherin and Notch2 in 4T1-SNO interaction in vitro. (a) 4T1GFP cells knocked-out for N-Cadherin expression (4T1Cdh2-KO-GFP) were seeded onto MACS-sorted SNOs and NON-SNOs and allowed to attach for 1 h at 37 °C, followed by extensive washing. The number of 4T1GFP cells was assessed after 1h of adhesion and (b) after 24–48 h of co-culture. (c) 4T1GFP cells in which the N-Cadherin expression was rescued (4T1Cdh2-Res-GFP) were seeded onto MACS-sorted SNOs and allowed to attach for 1 h at 37 °C, followed by extensive washing. The number of 4T1GFP cells was assessed after 1h of adhesion and (d) after 24–48 h of co-culture. (e) Notch2High and (f) Notch2Low 4T1Cdh2-KO-GFP and 4T1Cdh2-Res-GFP cells were seeded onto MACS-sorted SNOs and NON-SNOs cultured for 24 h and allowed to attach for 1 h at 37 °C, followed by extensive washing. Number of 4T1GFP cells was assessed after 24–48 h of co-culture. (a,df) Cell number per well was normalized for time 0 (number of cells after 1h of adhesion). Data are the mean ± SD of 4–5 independent cell preparations. Statistical analysis: (a,c) Student’s t-test, (b,df) non-linear regression fitting and F-test.
Figure 5
Figure 5
Effect of N-Cadherin expression on HSC mimicry and stemness of MDA and 4T1 BrCa cells. MDA cells were sorted into N-CadherinHigh and N-CadherinLow subpopulations by MACS. Real-time RT-PCR was used to assess the expression of the indicated (a) HSCs, (b) Stem Cell (SC) and (c) Cancer Stem Cell (CSC) markers. Human GAPDH was used to normalize gene expression. (d) 5-ethynyl-2′-deoxyuridine (EdU) assay was used to assess cell proliferation. (e) Size and (f) number of primary mammospheres obtained from MACS-sorted N-CadherinHigh and N-CadherinLow MDA cells. (g) Size and (h) number of secondary mammospheres obtained after trypsinization and re-plating single cells harvested from the primary MDA mammospheres. (i) Size and (j) number of primary mammospheres obtained from 4T1Cdh2-KO and 4T1Cdh2-Res GFP cells. (k) Size and (l) number of secondary mammospheres obtained after trypsinization and re-plating of single cells harvested from the primary 4T1 mammospheres. (m) Expression of the HSC marker Cxcr4 in 4T1Cdh2-KO and 4T1Cdh2-Res cells. Gene expression was normalised by mouse Gapdh. (n) Real-time array to assess the expression of the canonical mouse stem genes in 4T1Cdh2-KO and 4T1Cdh2-Res cells. The graph shows the genes that were found significantly modulated. The complete list is reported in Supplementary Table S1. (o) Cell proliferation assessed in the 4T1Cdh2-KO and 4T1Cdh2-Res cells by real-time RT-PCR to evaluate the expression of Cyclin D1 and (p) by immunofluorescence using a specific antibody for the Ki67. Data are the mean ± SD of 3–5 independent cell preparations. Statistical analysis: Student’s t-test.
Figure 6
Figure 6
N-Cadherin expression in primary human breast cancers and correlation with survival. (a) Kaplan–Meier plots on 1229 public proteomics from primary breast cancers to correlate N-Cadherin protein expression with patient survival in unselected populations of 300 N-CadherinLow and 573 N-CadherinHigh samples, (b) in oestrogen receptor (ER)-positive of 204 N-CadherinLow and 423 N-CadherinHigh samples, (c) in ER-negative populations of 60 N-CadherinLow and 136 N-CadherinHigh samples, (d) in progesterone receptor (PR)-positive of 215 N-CadherinLow and 317 N-CadherinHigh and (e) progesterone receptor (PR)-negative populations of 103 N-CadherinLow and 185 N-CadherinHigh samples, (f) in HER2-positive populations of 95 N-CadherinLow and 38 N-CadherinHigh samples, (g) in HER2-negative populations of 303 N-CadherinLow and 142 N-CadherinHigh samples and (h) in triple negative populations of 68 N-CadherinLow and 27 N-CadherinHigh samples plotted against time (KMPlot®). (i) Breast cancer tissue array containing 64 primary breast cancer samples was stained for N-Cadherin by immunohistochemistry. The number of the N-Cadherin positive cells was quantified, and the results were stratified according to (j) grade of differentiation, (k) presence of distal metastases, the expression of (l) PR, (m) HER2 or (n) ER receptors and in (o) triple negative primary tumours. Pictures are representative and data in (jo) are the mean ± SD of at least 9 primary tumours per condition. Statistical analysis: (a,h) log-rank test; (jo) Student’s t-test.

Similar articles

Cited by

References

    1. Howlader N., Noone A.M., Krapcho M., Miller D., Brest A., Yu M., Ruhl J., Tatalovich Z., Mariotto A., Lewis D.R., et al. Cancer Statistics Review, 1975-2018-SEER Statistics. [(accessed on 4 October 2021)]; Available online: https://seer.cancer.gov/csr/1975_2018/
    1. Osisami M., Keller E.T. Mechanisms of Metastatic Tumor Dormancy. J. Clin. Med. 2013;2:136–150. doi: 10.3390/jcm2030136. - DOI - PMC - PubMed
    1. Paez D., Labonte M.J., Bohanes P., Zhang W., Benhanim L., Ning Y., Wakatsuki T., Loupakis F., Lenz H.-J. Cancer dormancy: A model of early dissemination and late cancer recurrence. Clin. Cancer Res. 2012;18:645–653. doi: 10.1158/1078-0432.CCR-11-2186. - DOI - PubMed
    1. Banys-Paluchowski M., Reinhardt F., Fehm T. Disseminated Tumor Cells and Dormancy in Breast Cancer Progression. Adv. Exp. Med. Biol. 2020;1220:35–43. doi: 10.1007/978-3-030-35805-1_3. - DOI - PubMed
    1. Naumov G.N., Townson J.L., MacDonald I.C., Wilson S.M., Bramwell V.H.C., Groom A.C., Chambers A.F. Ineffectiveness of doxorubicin treatment on solitary dormant mammary carcinoma cells or late-developing metastases. Breast Cancer Res. Treat. 2003;82:199–206. doi: 10.1023/B:BREA.0000004377.12288.3c. - DOI - PubMed