. 2022 Feb 23;14(5):957.
doi: 10.3390/nu14050957.

Chicory: Understanding the Effects and Effectors of This Functional Food

Affiliations

Chicory: Understanding the Effects and Effectors of This Functional Food

Céline L Pouille et al. Nutrients. .

Abstract

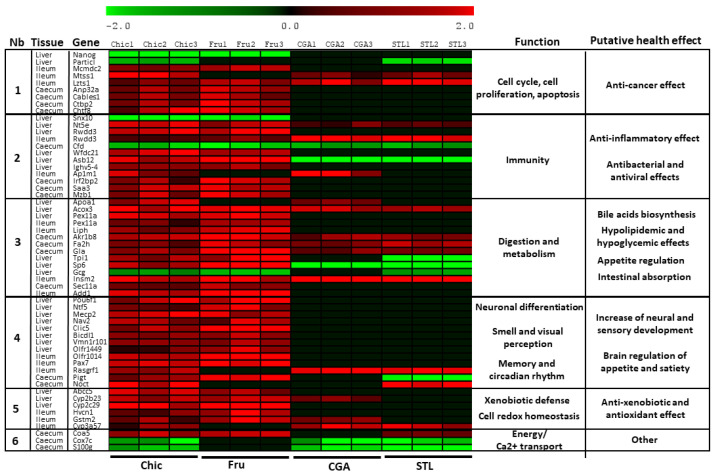
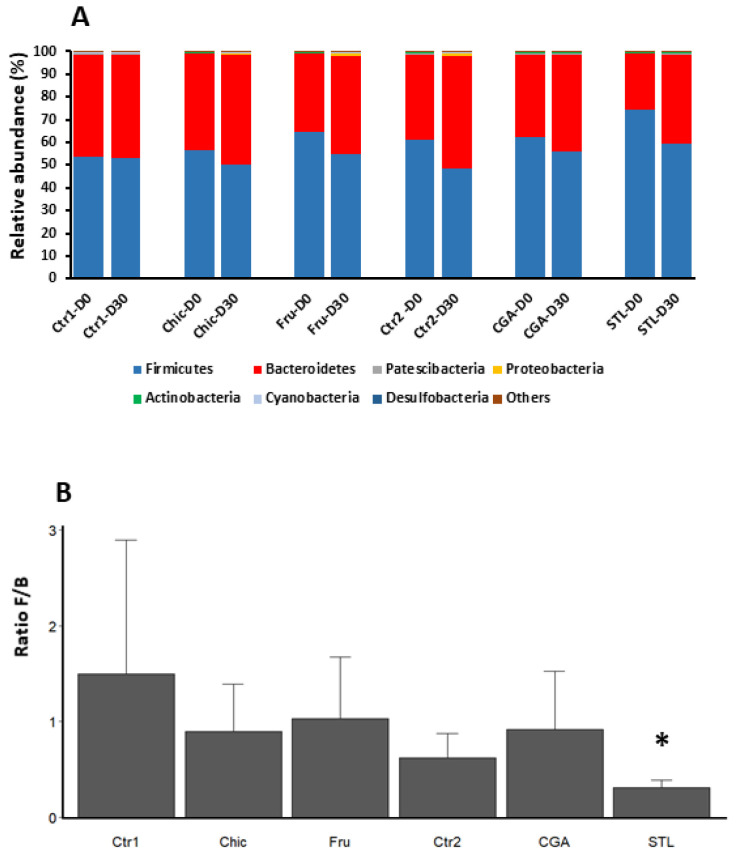
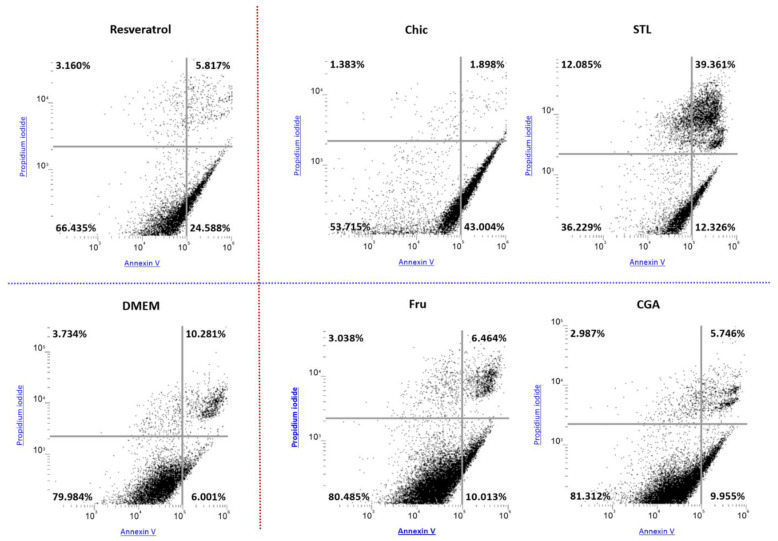
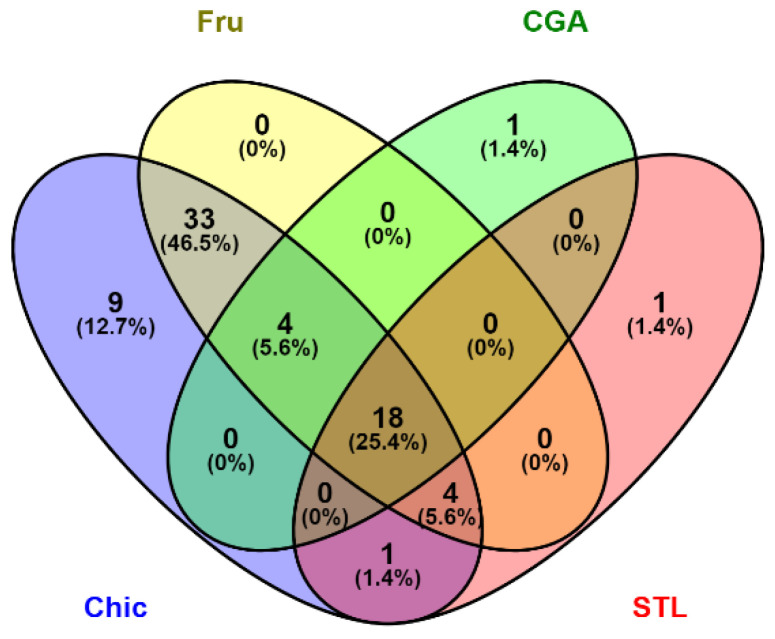
Industrial chicory has been the subject of numerous studies, most of which provide clinical observations on its health effects. Whether it is the roasted root, the flour obtained from the roots or the different classes of molecules that enter into the composition of this plant, understanding the molecular mechanisms of action on the human organism remains incomplete. In this study, we were interested in three molecules or classes of molecules present in chicory root: fructose, chlorogenic acids, and sesquiterpene lactones. We conducted experiments on the murine model and performed a nutrigenomic analysis, a metabolic hormone assay and a gut microbiota analysis, associated with in vitro observations for different responses. We have highlighted a large number of effects of all these classes of molecules that suggest a pro-apoptotic activity, an anti-inflammatory, antimicrobial, antioxidant, hypolipidemic and hypoglycemic effect and also an important role in appetite regulation. A significant prebiotic activity was also identified. Fructose seems to be the most involved in these activities, contributing to approximately 83% of recorded responses, but the other classes of tested molecules have shown a specific role for these different effects, with an estimated contribution of 23-24%.

Keywords: chicory; gut microbiota; hormone assay; in vitro apoptosis; in vitro pro-inflammatory cytokines; transcriptomics.


Conflict of interest statement

The authors declare no conflict of interest.

Figures

Figure 1
Figure 1
Gene expression profiles in hepatic tissue, ileum cells and caecum of mice after different diets. Log2 fold change of gene expression was represented individually for mice (1–3) and gene-related physiological processes and putative health effect are represented on the right part of the graph. Chic—chicory flour diet; Fru—fructose diet; CGA—chlorogenic acids treatment; STL—sesquiterpene lactones treatment.
Figure 2
Figure 2
Leptin (A) and GIP (B) level in mice plasma after 30 days of chicory, fructose, CGA and STL supplemented diet. Control values were pooled together (Ctr). Plasmatic hormone levels were expressed as a ratio of the control level. Statistical analysis was performed using one-way ANOVA and Dunnett’s multiple comparisons test (* p < 0.05; ** p < 0.01 against control).
Figure 3
Figure 3
Microbial diversity in fecal microbiota of mice after chicory (Chic), fructose (Fru), chlorogenic acids (CGA) or sesquiterpene lactones (STL) supplemented diet. (A) Alpha diversity was illustrated by the Shannon index (IS) that indicates a stabilized diversity for all subject groups (p > 0.05). (B) Principal Coordinates Analysis (PCoA) plots (beta-diversity) of affected taxa during different diets. Relative abundance obtained from sequencing the 16s rRNA gene in fecal samples was represented for taxa providing differences during chicory flour diet. Red circle mainly delimits the fructose effect, blue circle delimits the STL effect and green circle the CGA effect.
Figure 4
Figure 4
Changes in bacterial phyla abundance. (A) Relative abundance (%) of phyla in mice microbiota before (D0) and after 30 days (D30) of chicory (Chic), fructose (Fru), chlorogenic acids (CGA) or sesquiterpene lactones (STL) supplemented diet. Relative abundances detected by NGS are expressed as means. Phyla with abundance under 0.1% are grouped in “Others”. (B) Standardized abundance ratio relative to D0 of Firmicutes and Bacteroidetes (Tukey’s test, n = 5/group, * for p < 0.1). Chic—chicory flour; Fru–fructose; CGA—chlorogenic acids; STL—sesquiterpene lactones; Ctr1—control related to Chic and Fru diet; Ctr2—control related to CGA and STL diet.
Figure 5
Figure 5
Relative abundance of main genera in mice fecal microbiota after chicory flour (Chic), fructose (Fru), chlorogenic acids (CGA) or sesquiterpene lactones (STL) diet. (A) Relative abundances of genera (%) are indicated when their values are >0.1%. Genera with a low relative abundance were assigned as “Others”. (B) Heatmap representing the fold change of standardized abundance ratio. Increased abundance compared to control was considered when FC > 1.30 (red squares) and decreased when <0.70 (green squares).
Figure 6
Figure 6
Dot plots illustrating the apoptotic effect of chicory flour and its compounds on HepG2 cells. HepG2 cells were treated for 24 h with chicory decoction (Chic), fructose (Fru), CGA and STL solutions at different concentrations and analyzed using propidium iodide and Annexin V. Representations were selected among the most elevated concentration of each compound (3% for Chic and Fru; 100 µM for CGA and STL). Resveratrol at a concentration of 200 µM was used as a positive control, and DMEM as a negative one. The top left quadrant of each plot represents unviable cells, the top right quadrant represents necrotic cells or cells in late apoptosis. The bottom left quadrant represents viable cells and the bottom right quadrant represents early apoptotic cells. Total apoptotic cells were calculated by adding the top right and bottom right quadrant’s content. Samples illustrated in the top of the figure (Resveratrol, Chic and STL) provided an increased apoptotic effect compared to the other samples.
Figure 7
Figure 7
Apoptosis induction on HepG2 cells. HepG2 cells were treated with various concentrations of a chicory flour decoction (Chic) or D-fructose solution (Fru) (from 0.2% to 3%), and also with chlorogenic acids (CGA) or sesquiterpene lactones (STL) (from 5 µM to 100 µM) for 24 h. Resveratrol at a concentration of 200 µM was used as a positive control and DMEM and DMSO as negative ones. As no significant variations were registered between negative controls, the apoptosis induction in each condition was compared to the DMEM control and expressed as a ratio. Statistical analysis was performed using one-way ANOVA and Dunnett’s multiple comparisons test (**** p < 0.0001; *** p < 0.0005 compared with the DMEM control).
Figure 8
Figure 8
Effects of chicory and its compounds on TNF-α, IL-1β and IL-8 production by human U937 macrophages. U937 were differentiated with PMA before being inflamed with LPS (w/LPS) and put in contact with samples for 2 h. Dexamethasone (dexa) was used as a negative control of inflammation. Efficiency of LPS inflammation was controlled (RPMI w/o LPS) in each test. Cytokine levels were expressed as a ratio of the control (RPMI w/LPS) level. Statistical analysis was performed using one-way ANOVA and Dunnett’s multiple comparisons test (* p < 0.05; ** p < 0.005; **** p < 0.0001 against control). dexa: 20 µM of dexamethasone; chic: 1% of chicory flour decoction; Fru: 1% of D-fructose; CGA: 20 µM of chlorogenic acids mix; STL: 20 µM of sesquiterpene lactone mix.
Figure 9
Figure 9
Antioxidative effects of chicory flour. Superoxide anion inhibition (A) and hydroxyl radical inhibition (B) of chicory flour decoction were observed by contrast with the effect of the negative control (T ED) containing distilled water, and the positive control containing cysteine (T cys). The sample decoction of chicory flour (Chic) was tested at increasing concentrations, ranging from 0.25 to 1 mg of dry matter equivalent per final mL. Statistical analysis for n = 6 independent assays were performed with ANOVA: overall Fisher’s test, p < 0.0001; Tukey’s test, ** p < 0.01, *** p < 0.001, **** p < 0.0001 (A) and Kruskal-Wallis test, p = 0.0017; Dunn’s test, ** p < 0.01 (B).
Figure 10
Figure 10
Venn diagram illustrating an estimation of the most important effects of the chicory and its tested compounds: fructose (Fru), chlorogenic acids (CGA) and sesquiterpene lactones (STL). Number of DEGs was considered in transcriptome analysis, and number of modified taxa in metagenetic analysis. Results of hormone assay were constricted to significant modification as well as for in vitro analyses as significant response was considered 1 and a non-significant one was considered 0. A score was calculated by totaling these events for each diet. The Venn diagram’s platform (http://bioinfogp.cnb.csic.es/tools/venny/index.html accessed on 21 January 2022) was used to cross the data.

References

    1. Perović J., Tumbas Šaponjac V., Kojić J., Krulj J., Moreno D.A., García-Viguera C., Bodroža-Solarov M., Ilić N. Chicory (Cichorium intybus L.) as a food ingredient—Nutritional composition, bioactivity, safety, and health claims: A review. Food Chem. 2021;336:127676. doi: 10.1016/j.foodchem.2020.127676. - DOI - PubMed
    1. Pouille C.L., Jegou D., Dugardin C., Cudennec B., Ravallec R., Hance P., Rambaud C., Hilbert J.L., Lucau-Danila A. Chicory root flour—A functional food with potential multiple health benefits evaluated in a mice model. J. Funct. Foods. 2020;74:104174. doi: 10.1016/j.jff.2020.104174. - DOI
    1. Reimer R.A., Soto-Vaca A., Nicolucci A.C., Mayengbam S., Park H., Madsen K.L., Menon R., Vaughan E.E. Effect of chicory inulin-type fructan–containing snack bars on the human gut microbiota in low dietary fiber consumers in a randomized crossover trial. Am. J. Clin. Nutr. 2020;111:1286–1296. doi: 10.1093/ajcn/nqaa074. - DOI - PubMed
    1. EFSA Panel on Nutrition, Novel Foods and Food Allergens (NDA) Frutalose®, a mixture of fructans obtained from enzymatic hydrolysis of chicory inulin, and normal defecation: Evaluation of a health claim pursuant to Article 13 of Regulation (EC) No 1924/2006. EFSA J. 2021;19:e06775. doi: 10.2903/j.efsa.2021.6775. - DOI - PMC - PubMed
    1. Ferrare K., Bidel L.P., Awwad A., Poucheret P., Cazals G., Lazennec F., Azay-Milhau J., Tournier M., Lajoix A.D., Tousch D. Increase in insulin sensitivity by the association of chicoric acid and chlorogenic acid contained in a natural chicoric acid extract (NCRAE) of chicory (Cichorium intybus L.) for an antidiabetic effect. J. Ethnopharmacol. 2018;215:241–248. doi: 10.1016/j.jep.2017.12.035. - DOI - PubMed