

Reduced Kidney Function Is Associated with Increasing Red Blood Cell Folate Concentration and Changes in Folate Form Distributions (NHANES 2011-2018)
- PMID: 35268029
- PMCID: PMC8912286
- DOI: 10.3390/nu14051054
Reduced Kidney Function Is Associated with Increasing Red Blood Cell Folate Concentration and Changes in Folate Form Distributions (NHANES 2011-2018)
Abstract
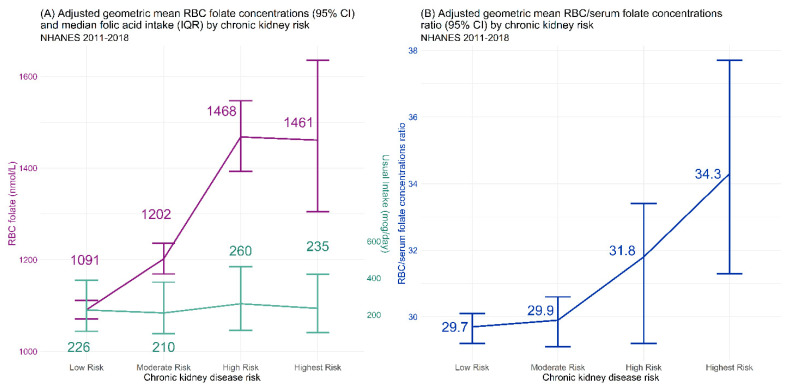
Background: Current studies examining the effects of high concentrations of red blood cell (RBC) or serum folates assume that high folate concentrations are an indicator of high folic acid intakes, often ignoring the contributions of other homeostatic and biological processes, such as kidney function. Objective: The current study examined the relative contributions of declining kidney function, as measured by the risk of chronic kidney disease (CKD), and usual total folic acid intake on the concentrations of RBC folate and serum folate (total as well as individual folate forms). Design: Cross-sectional data from the National Health and Nutrition Examination Survey (NHANES) collected in 2-year cycles were combined from 2011 to 2018. A total of 18,127 participants aged ≥16 years with available folate measures, kidney biomarker data (operationalized as a categorical CKD risk variable describing the risk of progression), and reliable dietary recall data were analyzed. Results: RBC folate concentrations increased as CKD risk increased: low risk, 1089 (95% CI: 1069, 1110) nmol/L; moderate risk, 1189 (95% CI: 1158, 1220) nmol/L; high risk, 1488 (95% CI: 1419, 1561) nmol/L; and highest risk, 1443 (95% CI: 1302, 1598) nmol/L (p < 0.0001). Similarly, serum total folate concentrations increased as CKD risk increased: low risk: 37.1 (95% CI: 26.3, 38.0) nmol/L; moderate risk: 40.2 (95% CI: 38.8, 41.7) nmol/L; high risk: 48.0 (95% CI: 44.3, 52.1) nmol/L; the highest Risk: 42.8 (95% CI: 37.8, 48.4) nmol/L (p < 0.0001). The modeled usual intake of folic acid showed no difference among CKD risk groups, with a population median of 225 (interquartile range: 108−390) µg/day. Conclusion: Both RBC and serum folate concentrations increased with declining kidney function without increased folic acid intake. When analyzing associations between folate concentrations and disease outcomes, researchers may want to consider the confounding role of kidney function.
Keywords: chronic kidney disease; folate concentration; folate metabolism; folic acid.
Conflict of interest statement
The authors have no conflict of interest to disclose.
Figures
References
-
- National Toxicology Program . NTP Monograph: Identifying Research Needs for Assessing Safe Use of High Intakes of Folic Acid. US Department of Health and Human Services; Washington, DC, USA: 2015. pp. 1–51.
-
- Bozack A.K., Hall M.N., Liu X., Ilievski V., Lomax-Luu A.M., Parvez F., Siddique A.B., Shahriar H., Uddin M.N., Islam T., et al. Folic acid supplementation enhances arsenic methylation: Results from a folic acid and creatine supplementation randomized controlled trial in Bangladesh. Am. J. Clin. Nutr. 2019;109:380–391. doi: 10.1093/ajcn/nqy148. - DOI - PMC - PubMed
-
- Kurzius-Spencer M., da Silva V., Thomson C.A., Hartz V., Hsu C.H., Burgess J.L., O’Rourke M.K., Harris R.B. Nutrients in one-carbon metabolism and urinary arsenic methylation in the National Health and Nutrition Examination Survey (NHANES) 2003–2004. Sci. Total Environ. 2017;607–608:381–390. doi: 10.1016/j.scitotenv.2017.07.019. - DOI - PubMed
MeSH terms
Substances
LinkOut - more resources
Full Text Sources
Medical
