Review
. 2022 Mar 1;11(5):1361.
doi: 10.3390/jcm11051361.

Detection of Vulnerable Coronary Plaques Using Invasive and Non-Invasive Imaging Modalities

Affiliations
Review

Detection of Vulnerable Coronary Plaques Using Invasive and Non-Invasive Imaging Modalities

Anna van Veelen et al. J Clin Med. .

Abstract

Acute coronary syndrome (ACS) mostly arises from so-called vulnerable coronary plaques, particularly prone for rupture. Vulnerable plaques comprise a specific type of plaque, called the thin-cap fibroatheroma (TFCA). A TCFA is characterized by a large lipid-rich necrotic core, a thin fibrous cap, inflammation, neovascularization, intraplaque hemorrhage, microcalcifications or spotty calcifications, and positive remodeling. Vulnerable plaques are often not visible during coronary angiography. However, different plaque features can be visualized with the use of intracoronary imaging techniques, such as intravascular ultrasound (IVUS), potentially with the addition of near-infrared spectroscopy (NIRS), or optical coherence tomography (OCT). Non-invasive imaging techniques, such as computed tomography coronary angiography (CTCA), cardiovascular magnetic resonance (CMR) imaging, and nuclear imaging, can be used as an alternative for these invasive imaging techniques. These invasive and non-invasive imaging modalities can be implemented for screening to guide primary or secondary prevention therapies, leading to a more patient-tailored diagnostic and treatment strategy. Systemic pharmaceutical treatment with lipid-lowering or anti-inflammatory medication leads to plaque stabilization and reduction of cardiovascular events. Additionally, ongoing studies are investigating whether modification of vulnerable plaque features with local invasive treatment options leads to plaque stabilization and subsequent cardiovascular risk reduction.

Keywords: intracoronary imaging; non-invasive imaging; thin-cap fibroatheroma; vulnerable plaque.


Conflict of interest statement

The authors declare no conflict of interest.

Figures
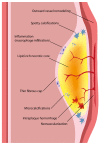
Figure 1
Figure 1
The vulnerable plaque consists of a large lipid-rich necrotic core with a thin fibrous cap (<65 μm). Several plaque features can be present that are associated with increased risk for cardiovascular events, including outward vessel remodeling, microcalcifications and spotty calcifications, hemorrhage, neovascularization, and inflammation. Image adapted from Van Veelen et al. Reviews in Cardiovascular Medicine 2022. CC-BY [4.0] [9].
Figure 2
Figure 2
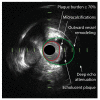
Vulnerable plaque on IVUS. An intravascular ultrasound (IVUS) cross-section of the coronary artery demonstrating the vulnerable plaque features that can be visualized with IVUS. The plaque demonstrates a plaque burden that is greater than 70%, measured as the external elastic membrane (EEM) area (green line) minus the luminal area (red line), divided by the EEM. The plaque appears echolucent, indicating the presence of a large lipid core and deep echo attenuation is visible. Furthermore, microcalcifications and outward vessel remodeling can be observed.
Figure 3
Figure 3
Vulnerable plaque on OCT. A cross-section of the coronary artery with OCT demonstrates a low-signal region, marked with asterisks, corresponding with a lipid-rich plaque. The overlying bright structure corresponds with the fibrous cap (arrowheads). (A) displays a lipid-rich plaque with a thin fibrous cap (i.e., thin-cap fibroatheroma). (B) displays a lipid-rich plaque with thick fibrous tissue overlaying the lipid-rich core. Image obtained from Muramatsu Y. et al., IJC Heart & Vasculature 2019. CC-BY [4.0] [71].
Figure 4
Figure 4
Vulnerable plaque on NIRS-IVUS. (A) displays an intravascular ultrasound (IVUS) image, which demonstrates an echolucent plaque with deep echo attenuation and a large plaque burden of 74%. The red-to-yellow colored ring corresponds with near-infrared spectroscopy (NIRS) data. The ring colors yellow at the site of the soft plaque, indicating that the plaque corresponds with a high probability for lipid core. In (B), the corresponding NIRS chemogram is displayed, where a maximum lipid-core burden index in a segment of 4 mm (maxLCBImm4) is detected of 543 at around 55 mm of the pullback, corresponding with the definition of a lipid-rich plaque (maxLCBImm4 > 400), based on the LRP study [79]. Image adapted from Van Veelen et al. Reviews in Cardiovascular Medicine 2022. CC-BY [4.0] [9].
Figure 5
Figure 5
Vulnerable plaque on CTCA. (A) displays the left anterior descending artery on computed tomography coronary angiography (CTCA) of a patient with stable angina pectoris. A low-attenuation plaque is demonstrated with spotty calcification. (B) displays the intravascular ultrasound (IVUS) images with near-infrared spectroscopy (NIRS) of the same patient, corresponding with the cutline in (A) around the bifurcation. The IVUS image displays an echolucent plaque (*) with deep echo attenuation and small calcium deposits. The NIRS chemogram colors yellow, indicating the presence of a large lipid core. Image obtained from Van Veelen et al. Reviews in Cardiovascular Medicine 2022. CC-BY [4.0] [9].
Figure 6
Figure 6
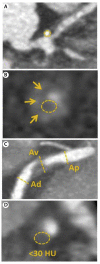
High-risk plaque features on CTCA according to CAD-RADS™: Coronary Artery Disease-Reporting and Data System. (A) demonstrates spotty calcifications; (B) demonstrates the napkin-ring sign, i.e., plaque with low attenuation in the center and a peripheral rim of high attenuation (indicated with arrows); (C) demonstrates positive remodeling, which is present if the ratio of the vessel diameter at the location of the plaque (Av), in relation to the vessel diameter proximally (Ap) and distally from the plaque (Ad) is greater than 1.1; (D) demonstrates a low-attenuation plaque, with Hounsfield Units (HU) of <30. Reprinted from Cury et al. [116], with permission from Elsevier.
Figure 7
Figure 7
Vulnerable plaque on 18F-NaF PET imaging. In (A), coronary angiography demonstrates two non-obstructive lesions in the proximal and mid-right coronary artery in a patient with stable angina. (B) demonstrates the corresponding 18F-NaF PET-CT image, which indicates no uptake of 18F-NaF in lesion I, but an increased uptake in lesion II. (C) and (D) demonstrate the corresponding radiofrequency IVUS images. Lesion I (C) appears to be a lesion consisting of fibrous tissue (green) with confluent calcium (white) with acoustic shadowing. However, the 18F-NaF positive lesion II (D) appears to consist of a large necrotic core (red), with microcalcifications (white), suggestive for a vulnerable plaque. Image adapted from Joshi NV, et al. [139] CC-BY [4.0].
Figure 8
Figure 8
Hybrid imaging in a patient presenting with recurrent non-ST-segment elevation ACS. (A) demonstrates severe in-stent restenosis in the proximal right coronary artery (RCA) with de novo lesion in the mid-RCA; (B) OCT demonstrates plaque rupture in the mid-RCA and (C) severe neointimal hyperplasia in the previously placed stent in the proximal RCA. (D) demonstrates the result of successful revascularization, with remaining diffuse disease in the left coronary artery (E). (F,G) demonstrate the 18F-NaF PET-CT images with high 18F-NaF uptake in the culprit artery, especially in the culprit lesion in the proximal RCA. The left coronary artery demonstrates no uptake of the radioactive tracer. Reprinted from Bing et al. [141], with permission from Elsevier.

References

    1. Sanchis-Gomar F., Perez-Quilis C., Leischik R., Lucia A. Epidemiology of coronary heart disease and acute coronary syndrome. Ann. Transl. Med. 2016;4:256. doi: 10.21037/atm.2016.06.33. - DOI - PMC - PubMed
    1. Kolansky D.M. Acute coronary syndromes: Morbidity, mortality, and pharmacoeconomic burden. Am. J. Manag. Care. 2009;15:S36–S41. - PubMed
    1. Brown B.G., Gallery C.A., Badger R.S., Kennedy J.W., Mathey D., Bolson E.L., Dodge H.T. Incomplete lysis of thrombus in the moderate underlying atherosclerotic lesion during intracoronary infusion of streptokinase for acute myocardial infarction: Quantitative angiographic observations. Circulation. 1986;73:653–661. doi: 10.1161/01.CIR.73.4.653. - DOI - PubMed
    1. Little W.C., Constantinescu M., Applegate R.J., Kutcher M.A., Burrows M.T., Kahl F.R., Santamore W.P. Can coronary angiography predict the site of a subsequent myocardial infarction in patients with mild-to-moderate coronary artery disease? Circulation. 1988;78:1157–1166. doi: 10.1161/01.CIR.78.5.1157. - DOI - PubMed
    1. Muller J.E., Tofler G.H., Stone P.H. Circadian variation and triggers of onset of acute cardiovascular disease. Circulation. 1989;79:733–743. doi: 10.1161/01.CIR.79.4.733. - DOI - PubMed

LinkOut - more resources