. 2022 Feb 24;11(5):791.
doi: 10.3390/cells11050791.

Experimental Arthritis Inhibits Adult Hippocampal Neurogenesis in Mice

Affiliations

Experimental Arthritis Inhibits Adult Hippocampal Neurogenesis in Mice

Kitti Rusznák et al. Cells. .

Abstract

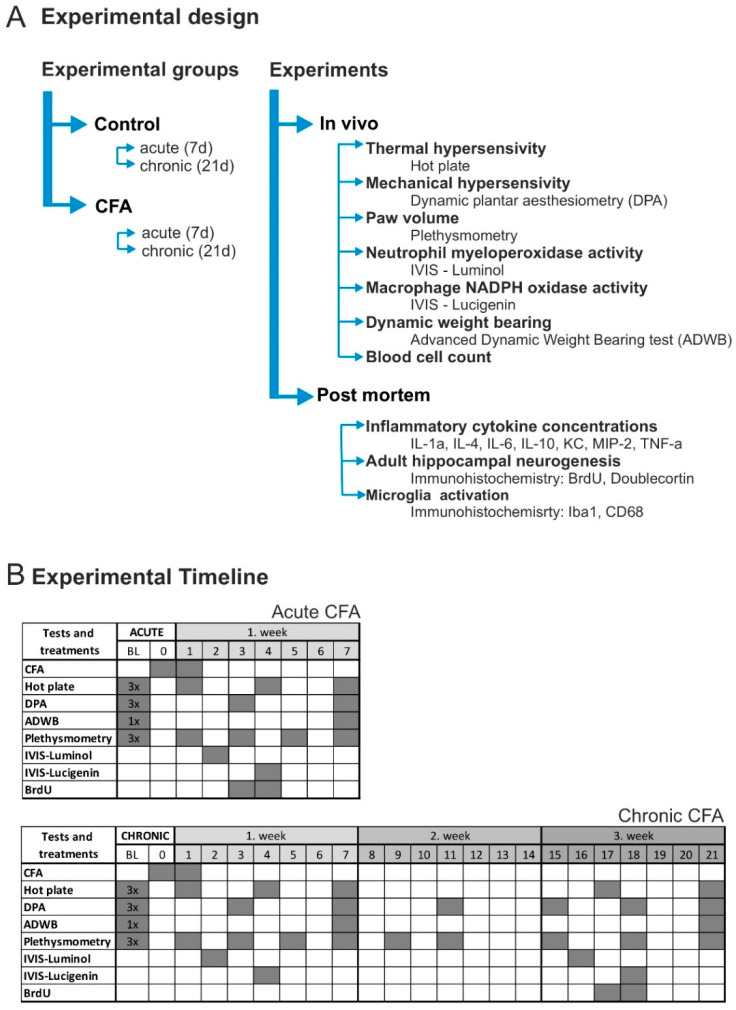
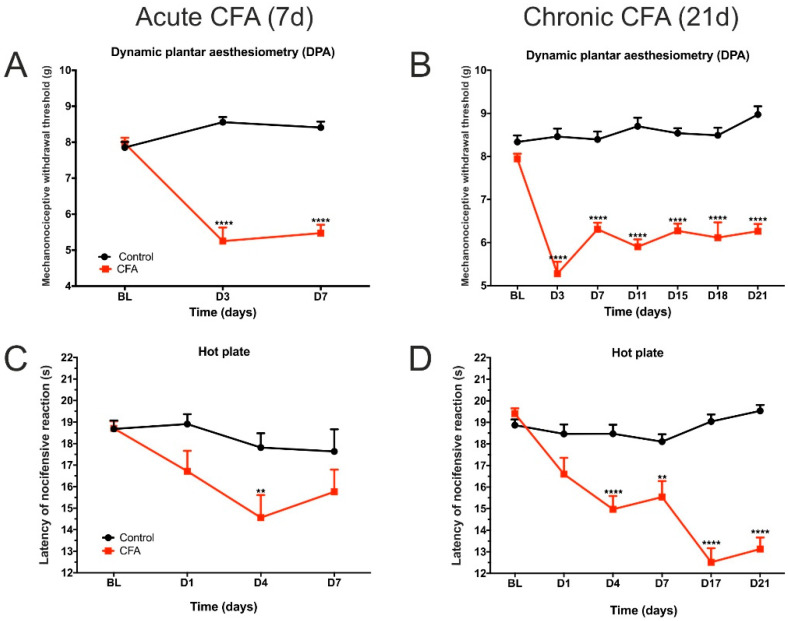
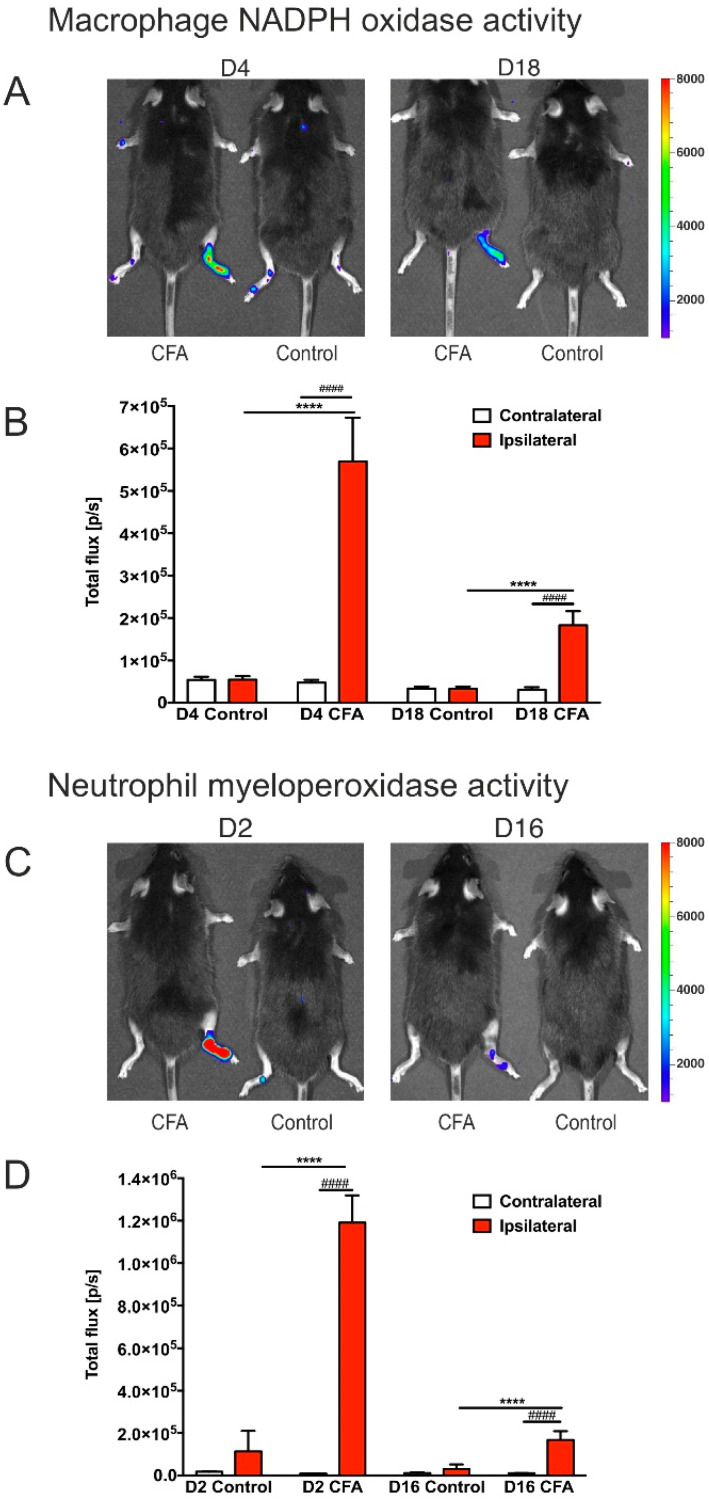
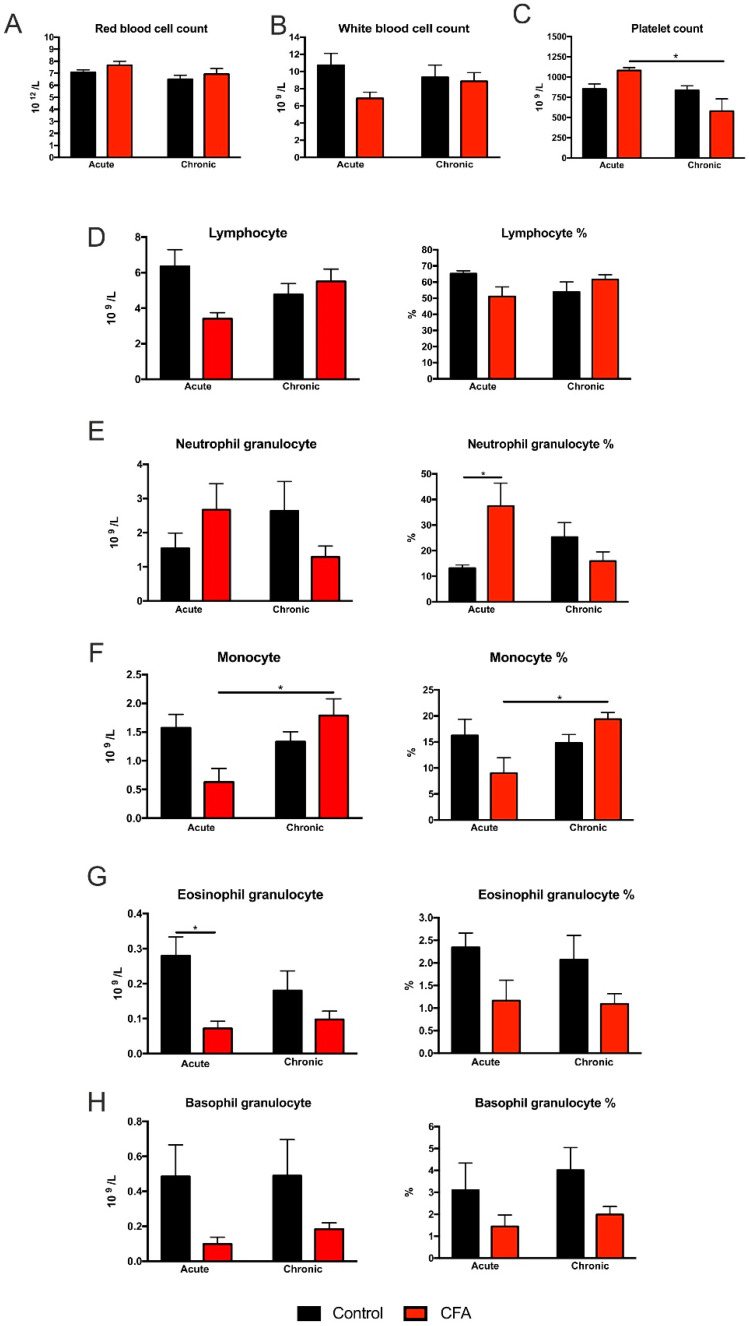
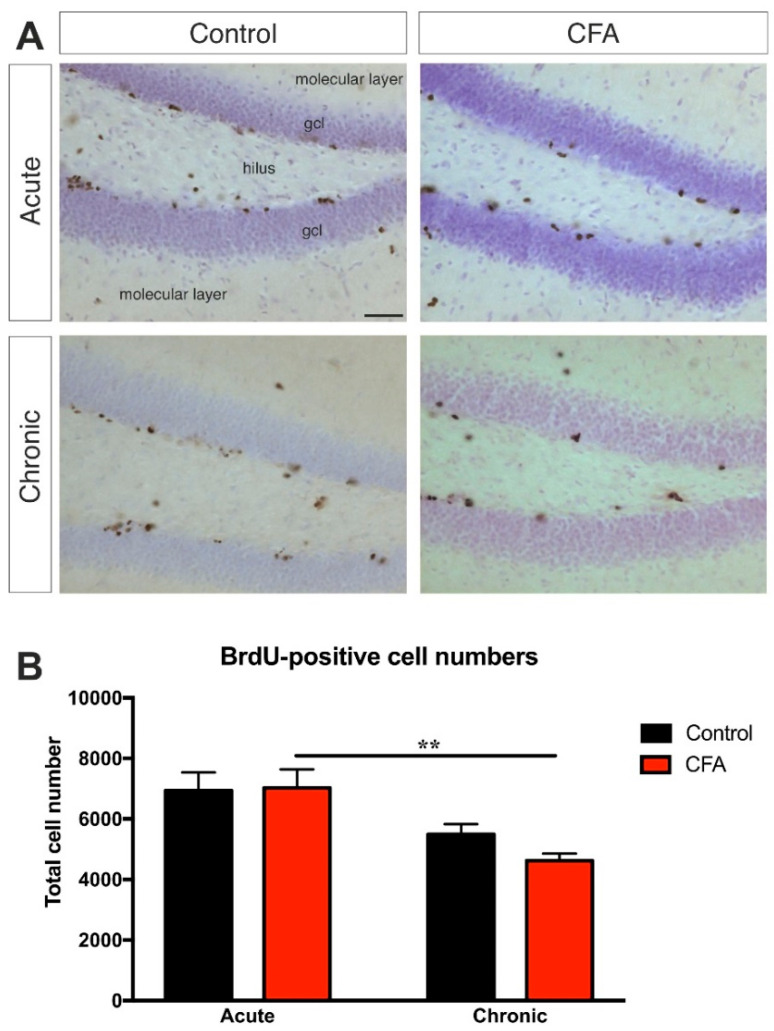
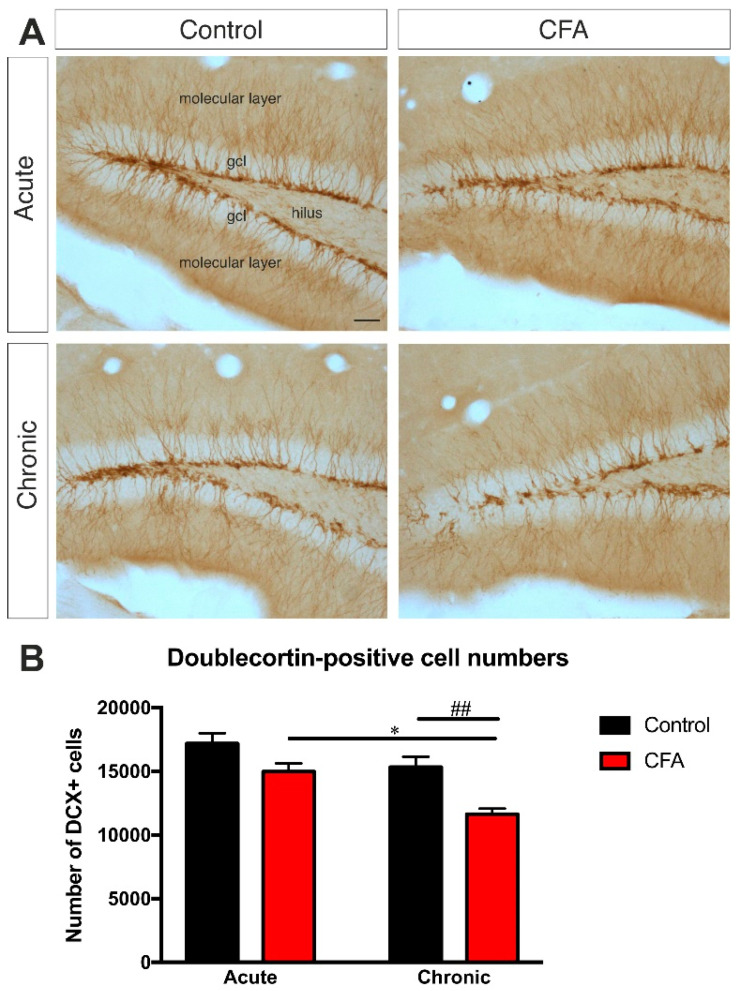
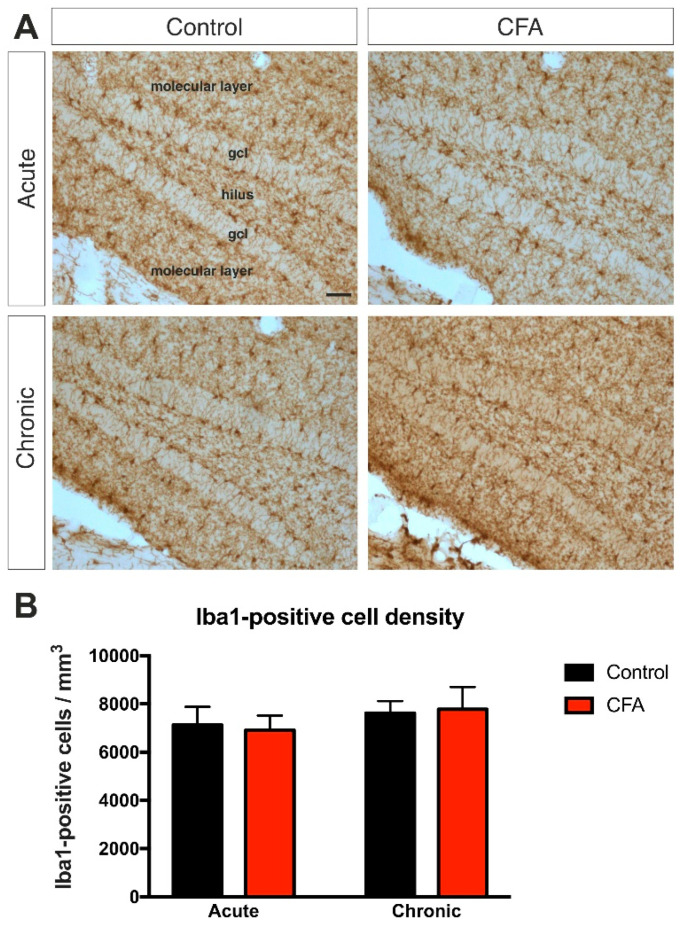
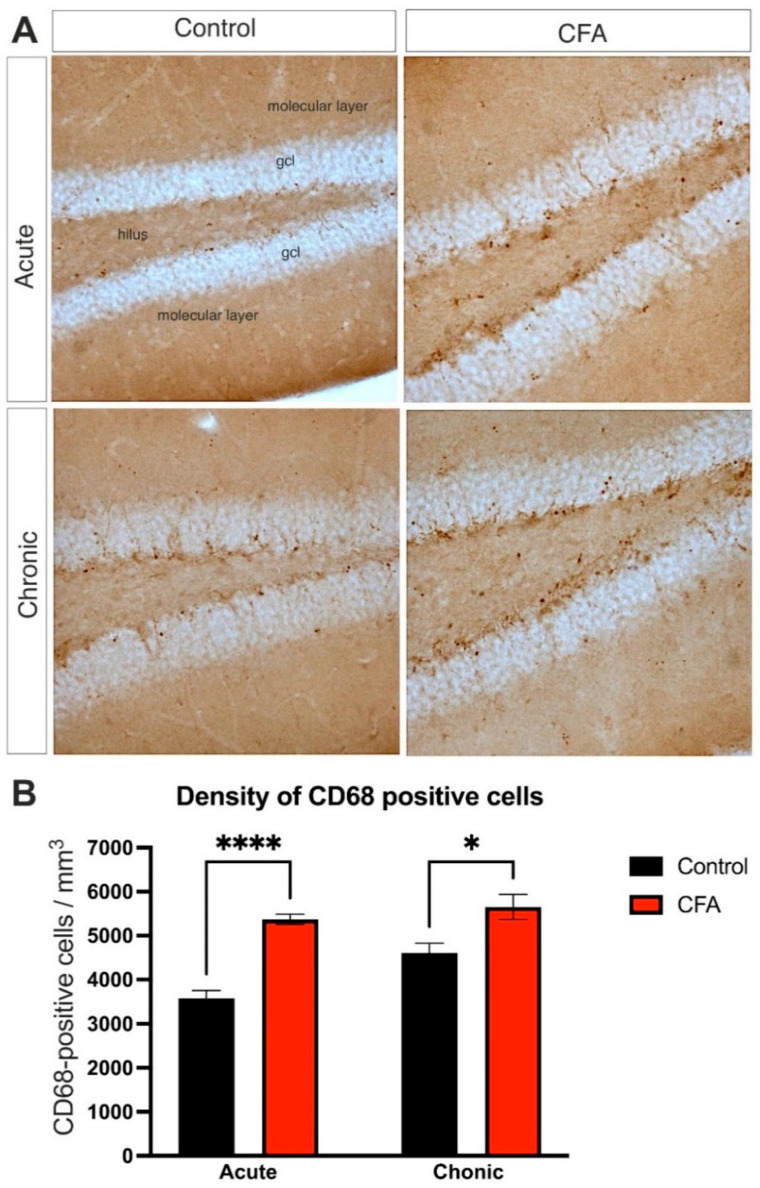
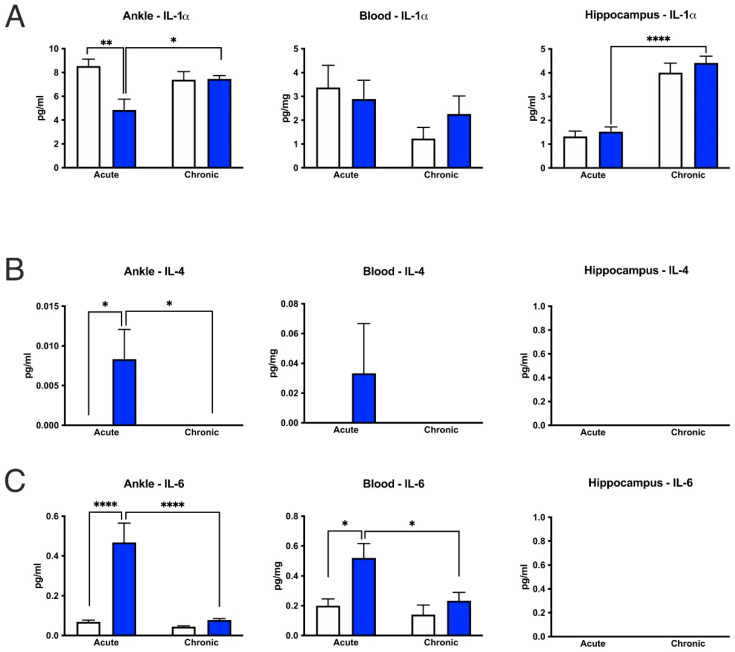
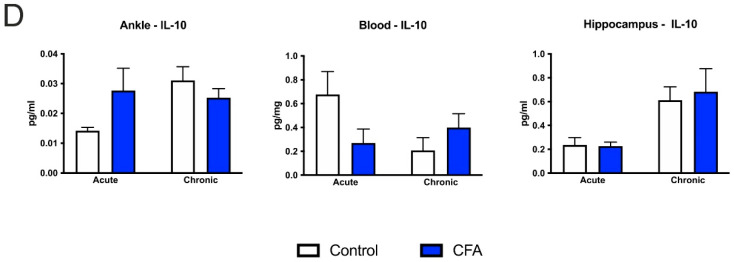
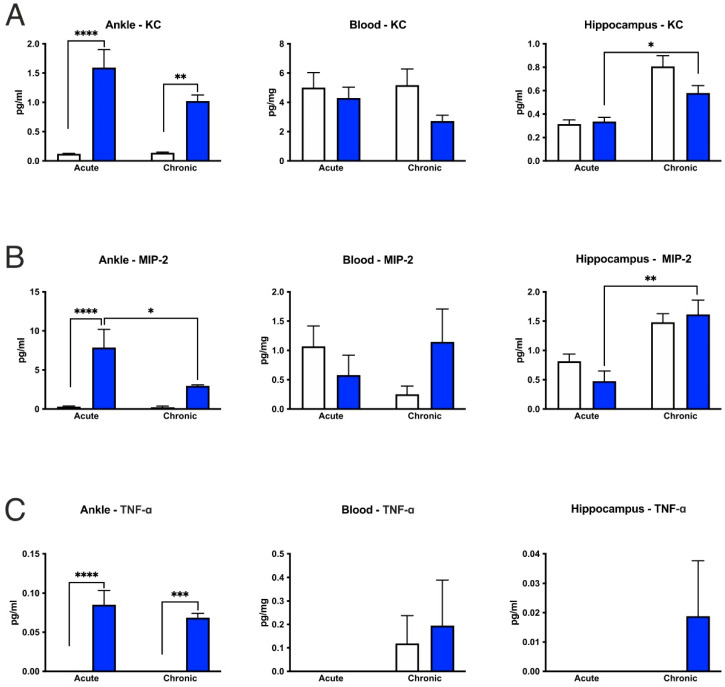
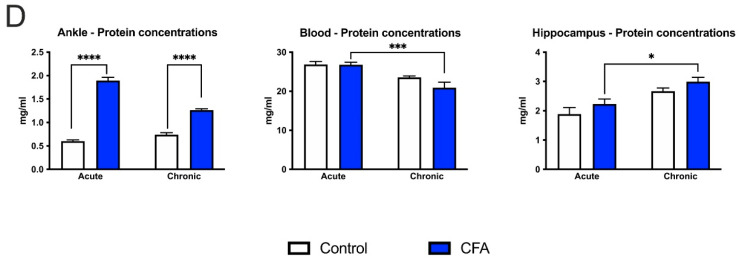
Background: Adult-born neurons of the hippocampal dentate gyrus play a role in specific forms of learning, and disturbed neurogenesis seems to contribute to the development of neuropsychiatric disorders, such as major depression. Neuroinflammation inhibits adult neurogenesis, but the effect of peripheral inflammation on this form of neuroplasticity is ambiguous. Objective: Our aim was to investigate the influence of acute and chronic experimental arthritis on adult hippocampal neurogenesis and to elucidate putative regulatory mechanisms. Methods: Arthritis was triggered by subcutaneous injection of complete Freund's adjuvant (CFA) into the hind paws of adult male mice. The animals were killed either seven days (acute inflammation) or 21 days (chronic inflammation) after the CFA injection. Behavioral tests were used to demonstrate arthritis-related hypersensitivity to painful stimuli. We used in vivo bioluminescence imaging to verify local inflammation. The systemic inflammatory response was assessed by complete blood cell counts and by measurement of the cytokine/chemokine concentrations of TNF-α, IL-1α, IL-4, IL-6, IL-10, KC and MIP-2 in the inflamed hind limbs, peripheral blood and hippocampus to characterize the inflammatory responses in the periphery and in the brain. In the hippocampal dentate gyrus, the total number of newborn neurons was determined with quantitative immunohistochemistry visualizing BrdU- and doublecortin-positive cells. Microglial activation in the dentate gyrus was determined by quantifying the density of Iba1- and CD68-positive cells. Results: Both acute and chronic arthritis resulted in paw edema, mechanical and thermal hyperalgesia. We found phagocytic infiltration and increased levels of TNF-α, IL-4, IL-6, KC and MIP-2 in the inflamed hind paws. Circulating neutrophil granulocytes and IL-6 levels increased in the blood solely during the acute phase. In the dentate gyrus, chronic arthritis reduced the number of doublecortin-positive cells, and we found increased density of CD68-positive macrophages/microglia in both the acute and chronic phases. Cytokine levels, however, were not altered in the hippocampus. Conclusions: Our data suggest that acute peripheral inflammation initiates a cascade of molecular and cellular changes that eventually leads to reduced adult hippocampal neurogenesis, which was detectable only in the chronic inflammatory phase.

Keywords: animal model; cell proliferation; chemokine; chronic inflammation; chronic pain; cytokine; dentate gyrus; hippocampus; microglia; neuroplasticity.


Conflict of interest statement

The authors declare no conflict of interest. The funders had no role in the design of the study; in the collection, analyses or interpretation of data; nor in the writing of the manuscript or the decision to publish the results.

Figures

Figure 1
Figure 1
Experimental design and experimental timeline. (A) Mice were randomly divided into four groups: Acute Control; Chronic Control; Acute CFA and Chronic CFA (n = 20/group). Various behavioral, physiological and histopathological studies were carried out to characterize the consequences of acute and chronic CFA-induced arthritis. (B) The experimental schedules for the Acute CFA- and Chronic CFA-treated animals, as well as their corresponding controls. Behavioral tests, in vivo imaging and treatments were performed on those days which have gray background. Abbreviations: advanced dynamic weight bearing (ADWB); baseline (BL); complete Freund’s adjuvant (CFA); dynamic plantar aesthesiometry (DPA).
Figure 2
Figure 2
Behavioral testing revealed CFA-induced increase in pain sensitivity and edema of the inflamed hind limb. CFA-injected mice had reduced mechanonociceptive withdrawal threshold in acute (A) and chronic (B) inflammatory conditions, as revealed by the dynamic plantar aesthesiometry test. Mice with arthritis had increased thermal hypersensitivity in acute (C) and chronic (D) inflammatory conditions to noxious heat stimuli when tested with the hot plate test. CFA-treated animals developed sustained inflammatory edema both in acute (E) and chronic (F) conditions. Dynamic body weight distribution was also altered. Animals displayed bodyweight imbalance and reduced their bodyweight on the inflamed hind limbs during the acute phase (G), but this bodyweight imbalance was reversed on Day 21 in the Chronic CFA-treated animals (H). Y-axis of (A,B): mechanonociceptive withdrawal threshold. Y-axis of (C,D): latency of nocifensive reaction. Statistical analysis for A-F: two-way repeated measures ANOVA (time × CFA treatment) followed by Sidak’s multiple comparisons post hoc test. * p < 0.05; ** p < 0.01; **** p < 0.0001 versus control values at the same time point. Statistical analysis for G-H: two-way ANOVA (time × CFA treatment) followed by Tukey’s post hoc test. Abbreviations: baseline (BL); complete Freund’s adjuvant (CFA); day(s) (d and D). Red colored lines in B, D and F indicate the CFA-treated animals similarly to A, C, and E.
Figure 2
Figure 2
Behavioral testing revealed CFA-induced increase in pain sensitivity and edema of the inflamed hind limb. CFA-injected mice had reduced mechanonociceptive withdrawal threshold in acute (A) and chronic (B) inflammatory conditions, as revealed by the dynamic plantar aesthesiometry test. Mice with arthritis had increased thermal hypersensitivity in acute (C) and chronic (D) inflammatory conditions to noxious heat stimuli when tested with the hot plate test. CFA-treated animals developed sustained inflammatory edema both in acute (E) and chronic (F) conditions. Dynamic body weight distribution was also altered. Animals displayed bodyweight imbalance and reduced their bodyweight on the inflamed hind limbs during the acute phase (G), but this bodyweight imbalance was reversed on Day 21 in the Chronic CFA-treated animals (H). Y-axis of (A,B): mechanonociceptive withdrawal threshold. Y-axis of (C,D): latency of nocifensive reaction. Statistical analysis for A-F: two-way repeated measures ANOVA (time × CFA treatment) followed by Sidak’s multiple comparisons post hoc test. * p < 0.05; ** p < 0.01; **** p < 0.0001 versus control values at the same time point. Statistical analysis for G-H: two-way ANOVA (time × CFA treatment) followed by Tukey’s post hoc test. Abbreviations: baseline (BL); complete Freund’s adjuvant (CFA); day(s) (d and D). Red colored lines in B, D and F indicate the CFA-treated animals similarly to A, C, and E.
Figure 3
Figure 3
In vivo bioluminescence imaging demonstrating local inflammation, i.e., the presence of reactive oxygen species generated by the inflammatory phagocytes. (A) Images of CFA-injected and control mice. This method detects the macrophage NADPH oxidase activity after injection of lucigenin into the animals. Lucigenin reacts with the macrophage NADPH oxidases and gives a bioluminescence signal. Note the bioluminescence signals of the right hind limbs. (B) Quantitative data of the bioluminescent signals. (C) Bioluminescence signals were evoked by the injection of luminol, which reacts with the myeloperoxidase enzymes of the neutrophil granulocytes. (D) Quantitative data of the bioluminescence signals. The bioluminescence signal was significantly increased both in the acute and chronic phases of the inflammation. Statistical analysis: two-way ANOVA (time × CFA treatment) followed by Tukey’s multiple comparisons post hoc test. **** p < 0.0001 versus the ipsilateral hind limbs of the control mice at the same time points. #### p < 0.0001 versus the contralateral hind limbs of the CFA-injected animals at the same time points. Abbreviations: complete Freund’s adjuvant (CFA); day (D).
Figure 4
Figure 4
Inflammatory arthritis altered specific parameters of the complete blood cell count. Erythrocyte (A) and leukocyte cell numbers (B) were not influenced by the CFA treatment, but platelet numbers decreased in the Chronic CFA-treated animals compared to the acute phase (C). Lymphocyte cell numbers and percentage were not altered (D), but we found a significant increase in the neutrophil granulocyte ratio of the Acute CFA-treated animals (E). We also found a significant difference in monocyte cell numbers and the percentage between the Acute and Chronic CFA-treated animals (F). The total number of eosinophil granulocytes was reduced in the acute CFA-treated animals (G). Two-way ANOVA revealed a significant main effect of CFA-treatment on eosinophil and basophil granulocyte numbers and ratios (G,H). Statistical analysis: two-way ANOVA (time × CFA treatment) followed by Tukey’s multiple comparisons post hoc test. * p < 0.05. Abbreviations: complete Freund’s adjuvant (CFA); percentage (%).
Figure 5
Figure 5
The effect of chronic arthritis on cell proliferation in the dentate gyrus. (A) Representative images demonstrating BrdU-immunopositive cells in the dentate gyrus of control and CFA-treated mice. Scale bar: 50 μm for all images. (B) Results of the systematic cell quantification data. Graphs represent the total number of BrdU-positive cells in both hemispheres combined. Animals in the chronic CFA treatment group had significantly reduced dentate cell proliferation compared to the acute CFA-treated group. Two-way ANOVA (time × CFA treatment) revealed a highly significant time effect but no effect of CFA-treatment, and the results of the post-hoc Tukey’s test is shown on the graph: ** p < 0.01. Abbreviations: 5-bromo-2′-deoxyuridine (BrdU); complete Freund’s adjuvant (CFA); granule cell layer (gcl).
Figure 6
Figure 6
Chronic inflammatory arthritis inhibits adult neurogenesis in the dentate gyrus. (A) Representative images demonstrating doublecortin-immunopositive immature neurons in the dentate gyrus of control and CFA-treated mice. Scale bar: 50 μm for all images. (B) Results of the systematic cell quantification data. Graphs represent the total number of doublecortin-positive cells in the dentate gyrus of both hemispheres combined. Animals in the CFA-induced chronic arthritis group had a significantly reduced number of DCX-positive cell numbers. Statistics: two-way ANOVA (time × CFA treatment) followed by Tukey’s multiple comparisons post hoc test. * p < 0.05 versus the Acute CFA-treated group; ## p < 0.01 versus the Chronic Control group. Abbreviations: complete Freund’s adjuvant (CFA); doublecortin (DCX); granule cell layer (gcl).
Figure 7
Figure 7
Inflammatory arthritis had no effect on the number of Iba1-immunopositive microglia in the dentate gyrus. (A) Representative images demonstrating Iba1-immunopositive microglia in the dentate gyrus of control and CFA-treated mice. Scale bar: 50 μm for all images. (B) Results of the systematic cell quantification data. Graphs represent the density of Iba1-positive cells (Iba1+ cell number/mm3) Statistics: two-way ANOVA (time × CFA treatment) followed by Tukey’s multiple comparisons post hoc test. Abbreviations: complete Freund’s adjuvant (CFA); granule cell layer (gcl); ionized calcium binding adaptor molecule-1 (Iba1).
Figure 8
Figure 8
Inflammatory arthritis increased the number of CD68-immunopositive macrophages/activated microglia in the dentate gyrus. (A): Representative images demonstrating CD68+ microglia and macrophages in the dentate gyrus of control and CFA-treated mice. Magnification 20× for all images. (B): Results of the cell quantification data. Graphs represent the density of CD68-positive cells (CD68+ cell number/mm3). Statistics: two-way ANOVA (time × CFA treatment) followed by Tukey’s multiple comparisons post hoc test. Abbreviations: complete Freund’s adjuvant (CFA); granule cell layer (gcl). * p < 0.05; **** p < 0.0001 versus control values at the same time point.
Figure 9
Figure 9
Cytokine/chemokine concentrations in the CFA-treated hind paws, peripheral blood and hippocampus. (AC) In the hind paws, acute inflammation increased IL-4 and IL-6 concentrations and decreased IL-1α levels. (C) In the peripheral blood, only IL-6 levels increased in response to acute inflammation. In the hippocampus, CFA treatment did not alter any cytokine levels compared to the corresponding control groups. (D) IL-10 concentrations were not altered in any tissue by the CFA-treatment. On some graphs, there are no bars, which means that those cytokine concentrations were below the detection levels. Statistics: two-way ANOVA (CFA treatment × time) followed by Tukey’s multiple comparisons post hoc test. * p < 0.05; ** p < 0.01; **** p < 0.0001. Abbreviations: complete Freund’s adjuvant (CFA); interleukin-1-alpha (IL-1α); interleukin-4 (IL-4); interleukin-6 (IL-6); interleukin-10 (IL-10).
Figure 9
Figure 9
Cytokine/chemokine concentrations in the CFA-treated hind paws, peripheral blood and hippocampus. (AC) In the hind paws, acute inflammation increased IL-4 and IL-6 concentrations and decreased IL-1α levels. (C) In the peripheral blood, only IL-6 levels increased in response to acute inflammation. In the hippocampus, CFA treatment did not alter any cytokine levels compared to the corresponding control groups. (D) IL-10 concentrations were not altered in any tissue by the CFA-treatment. On some graphs, there are no bars, which means that those cytokine concentrations were below the detection levels. Statistics: two-way ANOVA (CFA treatment × time) followed by Tukey’s multiple comparisons post hoc test. * p < 0.05; ** p < 0.01; **** p < 0.0001. Abbreviations: complete Freund’s adjuvant (CFA); interleukin-1-alpha (IL-1α); interleukin-4 (IL-4); interleukin-6 (IL-6); interleukin-10 (IL-10).
Figure 10
Figure 10
Cytokine/chemokine and total protein concentrations in the CFA-treated hind paws, peripheral blood and hippocampus. (AC) In the hind paws, acute inflammation increased cytokine concentrations of KC, MIP-2 and TNF-α, whereas chronic arthritis increased KC and TNF-α levels. In the peripheral blood, we found no change in these cytokine levels. In the hippocampus, CFA treatment did not alter any cytokine levels compared to the corresponding control groups. (D) Both acute and chronic inflammation increased total protein concentrations in the joints, and a similar trend was present in the hippocampus. On some graphs, there are no bars, which means that those cytokine concentrations were below the detection levels. Statistics: two-way ANOVA (CFA treatment × time) followed by Tukey’s multiple comparisons post hoc test. * p < 0.05; ** p < 0.01; *** p < 0.001; **** p < 0.0001. Abbreviations: complete Freund’s adjuvant (CFA); keratinocyte-derived chemokine (KC); macrophage inflammatory protein-2 (MIP-2); tumor necrosis factor alpha (TNF-α).
Figure 10
Figure 10
Cytokine/chemokine and total protein concentrations in the CFA-treated hind paws, peripheral blood and hippocampus. (AC) In the hind paws, acute inflammation increased cytokine concentrations of KC, MIP-2 and TNF-α, whereas chronic arthritis increased KC and TNF-α levels. In the peripheral blood, we found no change in these cytokine levels. In the hippocampus, CFA treatment did not alter any cytokine levels compared to the corresponding control groups. (D) Both acute and chronic inflammation increased total protein concentrations in the joints, and a similar trend was present in the hippocampus. On some graphs, there are no bars, which means that those cytokine concentrations were below the detection levels. Statistics: two-way ANOVA (CFA treatment × time) followed by Tukey’s multiple comparisons post hoc test. * p < 0.05; ** p < 0.01; *** p < 0.001; **** p < 0.0001. Abbreviations: complete Freund’s adjuvant (CFA); keratinocyte-derived chemokine (KC); macrophage inflammatory protein-2 (MIP-2); tumor necrosis factor alpha (TNF-α).

Similar articles

Cited by

References

    1. Boldrini M., Fulmore C.A., Tartt A.N., Simeon L.R., Pavlova I., Poposka V., Rosoklija G.B., Stankov A., Arango V., Dwork A.J., et al. Human Hippocampal Neurogenesis Persists throughout Aging. Cell Stem Cell. 2018;22:589–599.e5. doi: 10.1016/j.stem.2018.03.015. - DOI - PMC - PubMed
    1. Spalding K.L., Bergmann O., Alkass K., Bernard S., Salehpour M., Huttner H.B., Boström E., Westerlund I., Vial C., Buchholz B.A., et al. Dynamics of hippocampal neurogenesis in adult humans. Cell. 2013;153:1219–1227. doi: 10.1016/j.cell.2013.05.002. - DOI - PMC - PubMed
    1. Gould E., Reeves A.J., Fallah M., Tanapat P., Gross C.G., Fuchs E. Hippocampal neurogenesis in adult Old World primates. Proc. Natl. Acad. Sci. USA. 1999;96:5263–5267. doi: 10.1073/pnas.96.9.5263. - DOI - PMC - PubMed
    1. Kornack D.R., Rakic P. Continuation of neurogenesis in the hippocampus of the adult macaque monkey. Proc. Natl. Acad. Sci. USA. 1999;96:5768–5773. doi: 10.1073/pnas.96.10.5768. - DOI - PMC - PubMed
    1. Kuhn H.G., Dickinson-Anson H., Gage F.H. Neurogenesis in the dentate gyrus of the adult rat: Age-related decrease of neuronal progenitor proliferation. J. Neurosci. 1996;16:2027–2033. doi: 10.1523/JNEUROSCI.16-06-02027.1996. - DOI - PMC - PubMed

Publication types

LinkOut - more resources