. 2022 Feb 25;11(5):807.
doi: 10.3390/cells11050807.

CRISPR/Cas9-Mediated Models of Retinitis Pigmentosa Reveal Differential Proliferative Response of Müller Cells between Xenopus laevis and Xenopus tropicalis

Affiliations

CRISPR/Cas9-Mediated Models of Retinitis Pigmentosa Reveal Differential Proliferative Response of Müller Cells between Xenopus laevis and Xenopus tropicalis

Karine Parain et al. Cells. .

Abstract

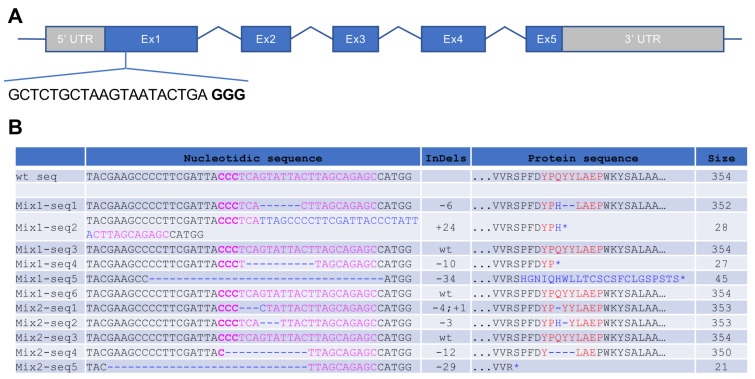
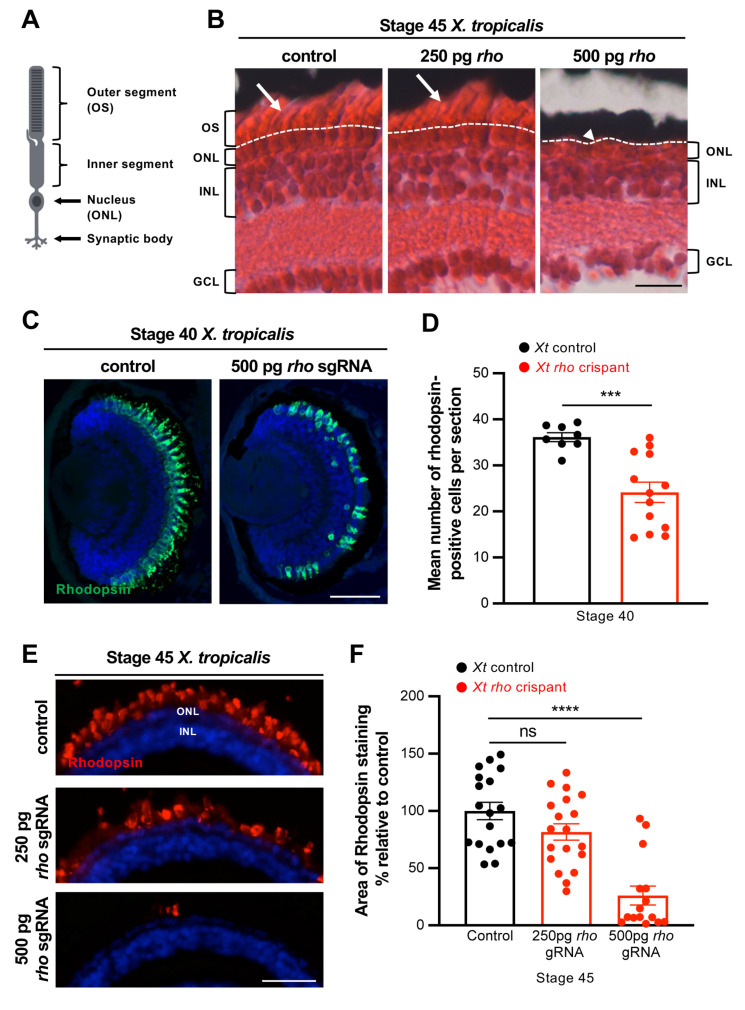
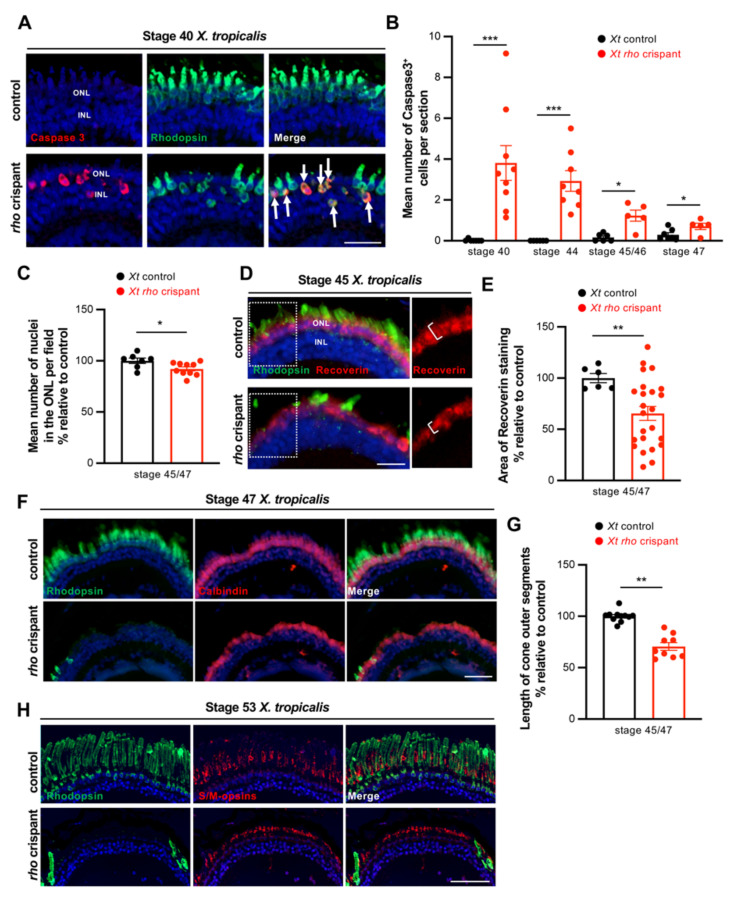
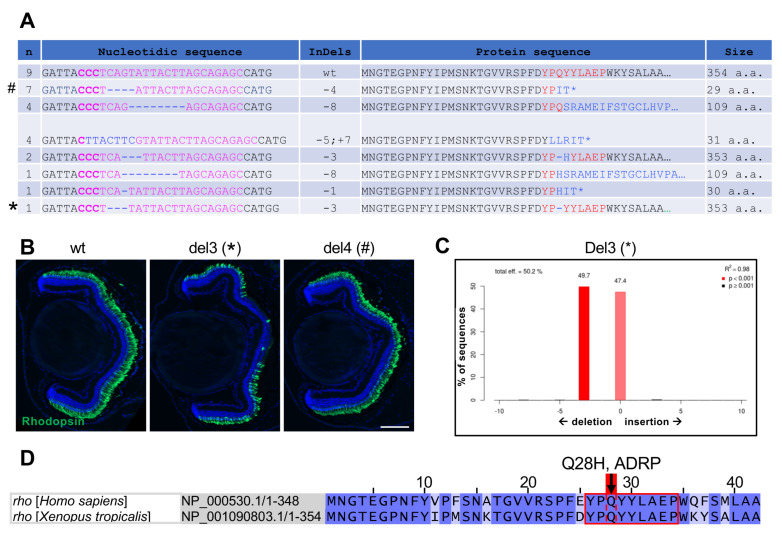
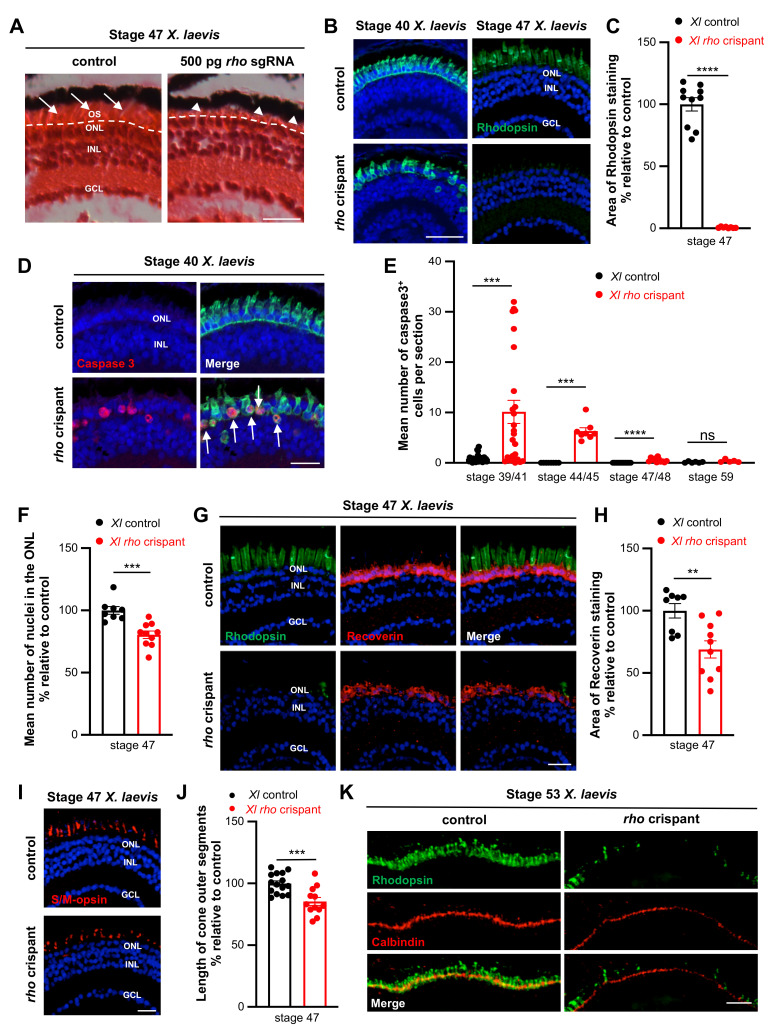
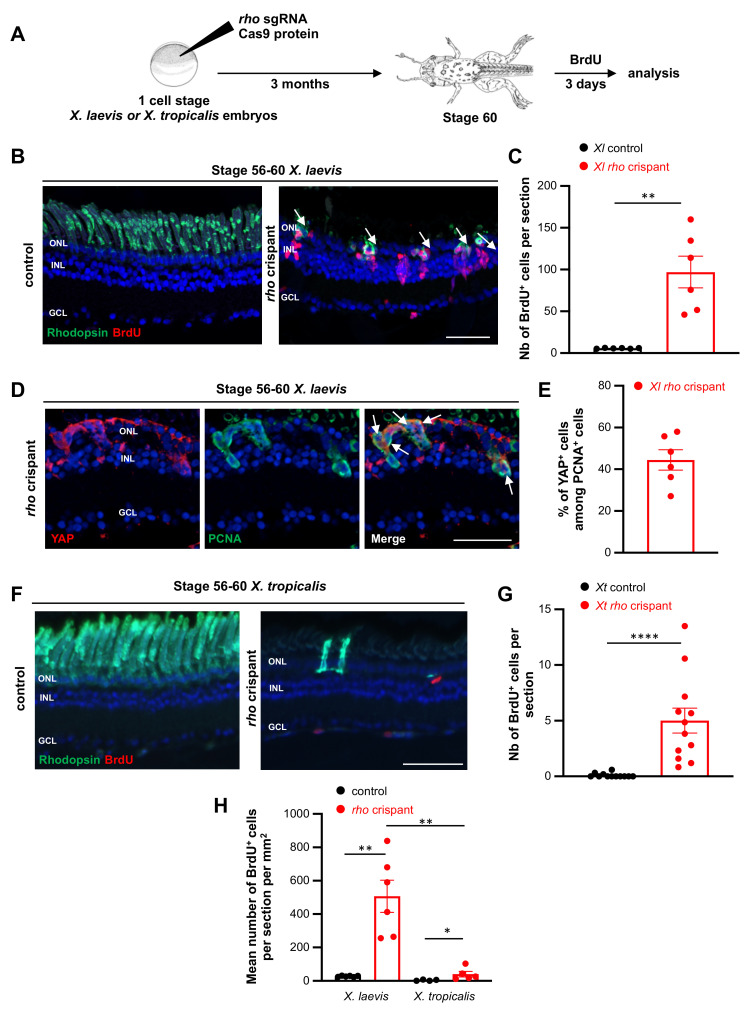
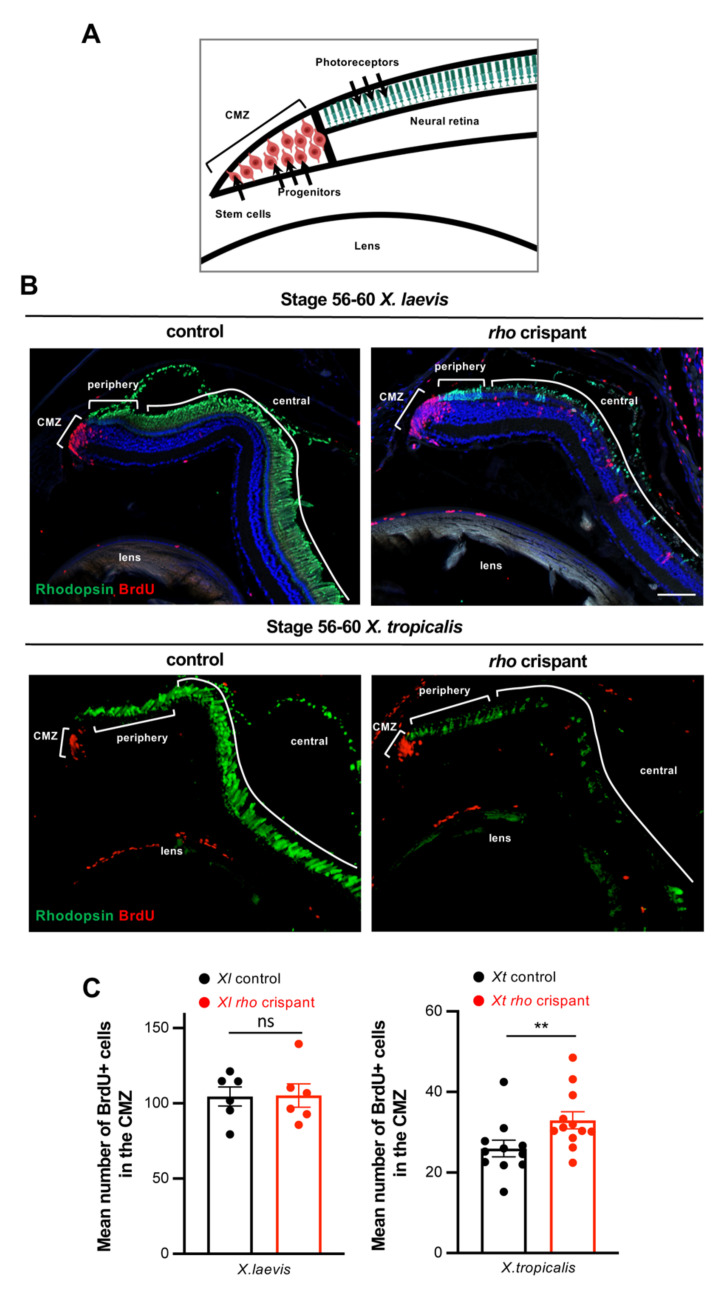
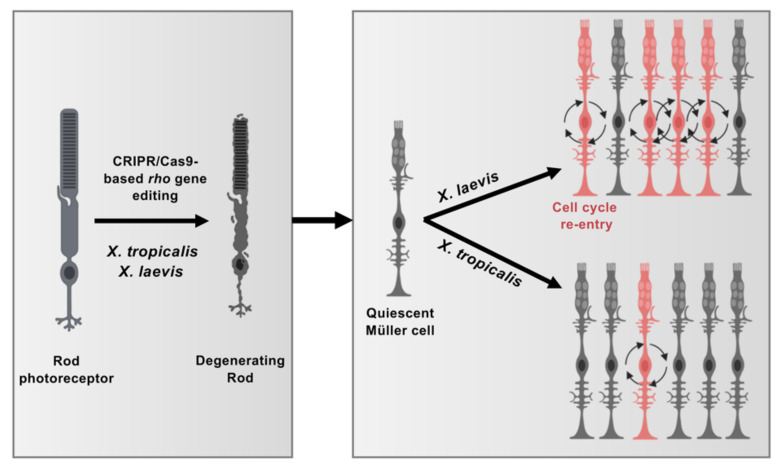
Retinitis pigmentosa is an inherited retinal dystrophy that ultimately leads to blindness due to the progressive degeneration of rod photoreceptors and the subsequent non-cell autonomous death of cones. Rhodopsin is the most frequently mutated gene in this disease. We here developed rhodopsin gene editing-based models of retinitis pigmentosa in two Xenopus species, Xenopus laevis and Xenopus tropicalis, by using CRISPR/Cas9 technology. In both of them, loss of rhodopsin function results in massive rod cell degeneration characterized by progressive shortening of outer segments and occasional cell death. This is followed by cone morphology deterioration. Despite these apparently similar degenerative environments, we found that Müller glial cells behave differently in Xenopus laevis and Xenopus tropicalis. While a significant proportion of Müller cells re-enter into the cell cycle in Xenopus laevis, their proliferation remains extremely limited in Xenopus tropicalis. This work thus reveals divergent responses to retinal injury in closely related species. These models should help in the future to deepen our understanding of the mechanisms that have shaped regeneration during evolution, with tremendous differences across vertebrates.

Keywords: CRISPR/Cas9; Müller cells; photoreceptors; retina; rhodopsin.


Conflict of interest statement

The authors declare no conflict of interest.

Figures

Figure 1
Figure 1
Genomic analysis of X. tropicalis rho crispants. (A) Schematic of the Xenopus tropicalis rho gene. The depicted sequence corresponds to the CRISPR RNA targeting exon 1 and to the protospacer adjacent motif (PAM; indicated in bold). (B) Sequences obtained from individual clones of PCR products amplified from genomic DNA. Two mixtures (Mix1, 2) of 5 X. tropicalis F0 embryos injected with 500 pg of rho sgRNA and 600 pg of cas9 mRNA were used. For each clone, the targeted sequence is shown in pink, with PAM in bold, while indels are in blue. The right column indicates the corresponding protein sequence and its size (number of amino acids).
Figure 2
Figure 2
Rod degeneration in X. tropicalis rho crispants. (A) Schematic representation of a rod photoreceptor. (B) Hematoxylin and Eosin staining on retinal sections from stage 45 control and rho crispant X. tropicalis tadpoles. The dotted line delineates the border between the outer nuclear layer and photoreceptor outer segments (arrows). The arrowhead indicates the absence of outer segments. (CF) Immunofluorescence analysis of Rhodopsin expression on retinal sections from stage 40 (C,D) and stage 45 (E,F) control and crispant X. tropicalis tadpoles. Rhodopsin labels the rod outer segments. The number of Rhodopsin-positive cells and the area of Rhodopsin staining are quantified in (D,F), respectively. In (C,E), cell nuclei are counterstained with Hoechst (blue). In graphs, data are represented as mean ± SEM and each point represents one retina. *** p < 0.001; **** p < 0.0001; ns: non-significant (Mann–Whitney tests). GCL: ganglion cell layer, INL: inner nuclear layer, ONL: outer nuclear layer, OS: outer segment. Scale bars: 25 µm in (B,E) and 50 µm in (C).
Figure 3
Figure 3
Rod cell death and cone defects in X. tropicalis rho crispants. (A) Typical retinal sections from stage 40 control and crispant X. tropicalis embryos, immunostained for cleaved Caspase 3 and Rhodopsin. Arrows point to double positive cells. (B) Quantification of Caspase 3-positive cells from stage 40 to stage 47. (C) Quantification of ONL nuclei on retinal sections from stage 45/47 control and crispant X. tropicalis tadpoles. Nuclei were counted in one standard square field per section. (D,E) Immunofluorescence analysis of Recoverin expression on retinal sections from stage 45 control and crispant X. tropicalis tadpoles. Sections were co-stained for Rhodopsin for comparison. Panels on the right show the regions delineated with the dotted white boxes and highlight the decreased thickness of Recoverin staining in crispants (brackets). The total area of Recoverin staining is quantified in (E). (F) Typical retinal sections from stage 47 control and crispant X. tropicalis tadpoles, immunostained for Rhodopsin and Calbindin (a marker of cone photoreceptors). (G) Quantification of cone outer segment length. (H) Retinal sections from stage 53 control and crispant X. tropicalis tadpoles, immunostained for Rhodopsin and S/M-opsin (a marker of cone photoreceptors). Note the continuous but thinner staining in the outer nuclear layer of crispant tadpoles. In (A,D,F,H), cell nuclei are counterstained with Hoechst (blue). In graphs, data are represented as mean ± SEM, and each point represents one retina. * p < 0.05; ** p < 0.01; *** p < 0.001 (Mann–Whitney tests). Scale bar: 25 µm in (A,D) and 50 µm in (F,H).
Figure 4
Figure 4
Characterization of F1 X. tropicalis rho mutants. (A) Genomic sequences retrieved from F1 X. tropicalis rho mutants. The left column indicates the number of tadpoles harbouring the corresponding sequence. The targeted region is shown in pink with PAM in bold, while indels are in blue. The right column indicates the resulting protein sequence and its size (number of amino acids). (B) Immunofluorescence analysis of Rhodopsin expression on retinal sections from stage 45 wild-type and F1 individuals. Del3 and del4 tadpoles bear the sequences depicted in A with * (leading to lack of glutamine 28) and # (leading to a truncated protein), respectively. Cell nuclei are counterstained with Hoechst (blue). (C) TIDE analysis of the del3 rho mutant showing the presence of a wild-type and a mutated allele. (D) Illustration of Homo sapiens and X. tropicalis Rhodopsin protein sequences (amino acids 1 to 42). The region targeted by the rho sgRNA (red square) is conserved between the two species and includes glutamine 28, whose mutation Q28H was found in patients with autosomal dominant retinitis pigmentosa (ADRP). Scale bar: 100 µm.
Figure 5
Figure 5
Rod degeneration and cone defects in X. laevis rho crispants. (A) Hematoxylin and Eosin staining on retinal sections from stage 47 control and rho crispant X. laevis tadpoles. The dotted line delineates the border between the outer nuclear layer and photoreceptor outer segments (arrows). Arrowheads point to shortened outer segments. (B,C) Immunofluorescence analysis of Rhodopsin expression on retinal sections from control and crispant X. laevis tadpoles at stage 40 or 47. The area of Rhodopsin staining at stage 47 is quantified in (C). (D) Typical retinal sections from stage 40 control and crispant X. laevis embryos, immunostained for cleaved Caspase 3 and Rhodopsin. Arrows point to double positive cells. (E) Quantification of Caspase 3-positive cells from stage 39/41 to stage 59. (F) Quantification of ONL nuclei on retinal sections from stage 47 control and crispant X. laevis tadpoles. Nuclei were counted in one standard rectangle field per section. (G,H) Immunofluorescence analysis of Recoverin expression on retinal sections from stage 47 control and crispant X. laevis tadpoles. Sections were co-stained for Rhodopsin for comparison. The area of Recoverin staining is quantified in (H). (I,J) Immunofluorescence analysis of S/M-opsin expression on stage 47 control and crispant X. laevis tadpoles. The length of S/M opsin-labelled outer segments is quantified in (J). (K) Typical retinal sections from stage 53 control and crispant X. laevis tadpoles, immunostained for calbindin. Note the continuous but thinner staining in the outer nuclear layer of crispant tadpoles. In (B,D,G,I), cell nuclei are counterstained with Hoechst (blue). In graphs, data are represented as mean ± SEM and each point represents one retina. ** p < 0.01; *** p < 0.001; **** p < 0.0001; ns: non-significant (Mann–Whitney tests). GCL: ganglion cell layer, INL: inner nuclear layer, ONL: outer nuclear layer, OS: outer segment. Scale bar: 25 µm in (A,B,D,H,I) and 50 µm in (K).
Figure 6
Figure 6
Analysis of proliferation in X. tropicalis and X. laevis rho crispants. (A) Timeline diagram of the experimental procedure used in (BH). (B,C) BrdU assay on retinal sections from stage 56–60 control and crispant X. laevis tadpoles. Sections were co-labelled for Rhodopsin. Arrows point to double positive cells. BrdU-positive cells are quantified in (C). (D) Typical sections from stage 56–60 crispant X. laevis tadpoles, immunostained for PCNA (a marker of proliferative cells) and YAP (a marker of Müller cells). Arrows point to double positive cells. (E) Quantification of proliferating Müller cells (YAP- and PCNA-positive). (F,G) BrdU assay on retinal sections from stage 56–60 control and crispant X. tropicalis tadpoles. Sections were co-labelled for Rhodopsin. BrdU-positive cells are quantified in (G). (H) Comparison of BrdU incorporation between X. laevis and X. tropicalis crispants at stage 56–60. The number of BrdU-positive cells was normalized to retinal cell surface. In (B,D,F) cell nuclei are counterstained with Hoechst (blue). In (C,G), counting was performed in the central retina, considering only the inner and outer nuclear layers. In graphs, data are represented as mean ± SEM and each point represents one retina. * p < 0.05; ** p < 0.01; **** p < 0.0001 (Mann–Whitney tests). GCL: ganglion cell layer, INL: inner nuclear layer, ONL: outer nuclear layer. Scale bars: 50 µm in (B,F), 25 µm in (D).
Figure 7
Figure 7
Analysis of proliferative CMZ cells in X. tropicalis and X. laevis rho crispants. (A) Schematic representation of the peripheral part of the retina. Stem cells and progenitors lie at the tip within the ciliary marginal zone (CMZ), while newly produced differentiated cells are found more centrally (only photoreceptors are shown here). (B) Typical retinal sections from stage 60 control and crispant X. laevis and X. tropicalis tadpoles, immunostained for Rhodopsin and BrdU (protocol illustrated in the timeline diagram of Figure 6A). Cell nuclei are counterstained with Hoechst (blue). (C) Quantification of BrdU-labelled cells in the CMZ. In graphs, data are represented as mean ± SEM, and each point represents one retina. ** p < 0.01; ns: non-significant (Mann–Whitney tests). Scale bar: 50 µm.
Figure 8
Figure 8
Model illustrating differences in Müller cell response to injury in X. tropicalis and X. laevis. CRISPR/Cas9-mediated rho editing triggers rod photoreceptor degeneration in both X. tropicalis and X. laevis. Quiescent Müller cells respond to this pathological context by re-entering into cell cycle. While Müller cell proliferation is greatly enhanced in X. laevis, it remains limited in X. tropicalis, suggesting divergent regenerative properties of these closely related species. This figure was created with schemas from ©BioRender—biorender.com accessed on November 2021.

References

    1. Bringmann A., Pannicke T., Grosche J., Francke M., Wiedemann P., Skatchkov S.N., Osborne N.N., Reichenbach A. Müller cells in the healthy and diseased retina. Prog. Retin. Eye Res. 2006;25:397–424. doi: 10.1016/j.preteyeres.2006.05.003. - DOI - PubMed
    1. Wan J., Goldman D. Retina regeneration in zebrafish. Curr. Opin. Genet. Dev. 2016;40:41–47. doi: 10.1016/j.gde.2016.05.009. - DOI - PMC - PubMed
    1. Langhe R., Chesneau A., Colozza G., Hidalgo M., Ail D., Locker M., Perron M. Müller glial cell reactivation in Xenopus models of retinal degeneration. Glia. 2017;65:1333–1349. doi: 10.1002/glia.23165. - DOI - PubMed
    1. Salman A., McClements M.E., MacLaren R.E. Insights on the Regeneration Potential of Müller Glia in the Mammalian Retina. Cells. 2021;10:1957. doi: 10.3390/cells10081957. - DOI - PMC - PubMed
    1. García-García D., Locker M., Perron M. Update on Müller glia regenerative potential for retinal repair. Curr. Opin. Genet. Dev. 2020;64:52–59. doi: 10.1016/j.gde.2020.05.025. - DOI - PubMed

Publication types

MeSH terms

LinkOut - more resources