Review
. 2022 Feb 25;11(5):809.
doi: 10.3390/cells11050809.

Activation of Subcutaneous Mast Cells in Acupuncture Points Triggers Analgesia

Affiliations
Review

Activation of Subcutaneous Mast Cells in Acupuncture Points Triggers Analgesia

Li-Na Wang et al. Cells. .

Abstract

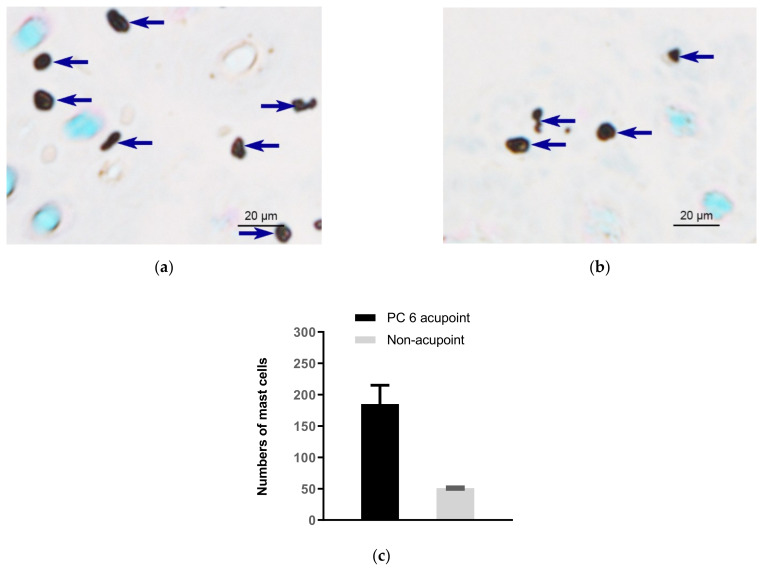
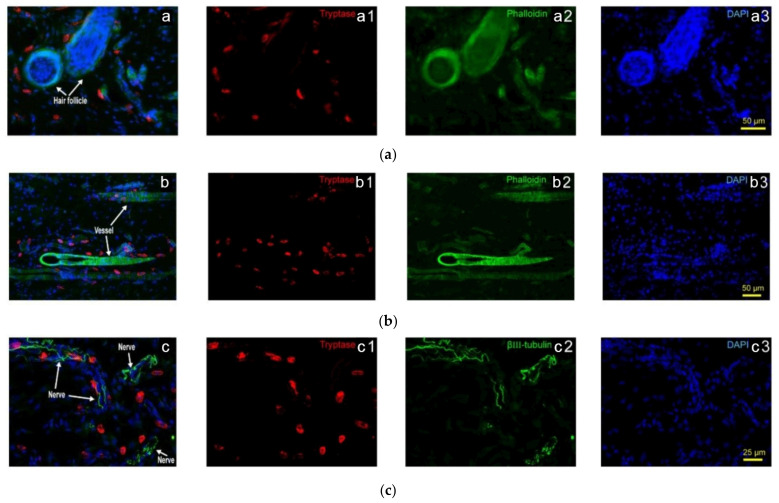
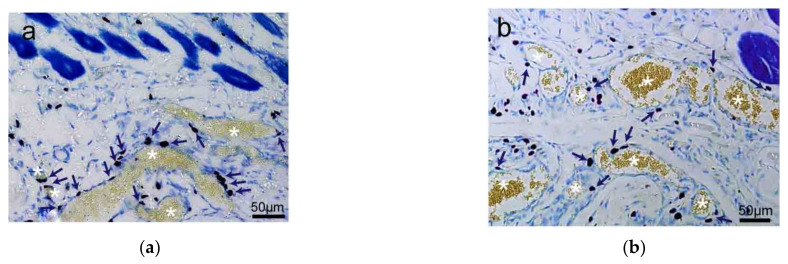
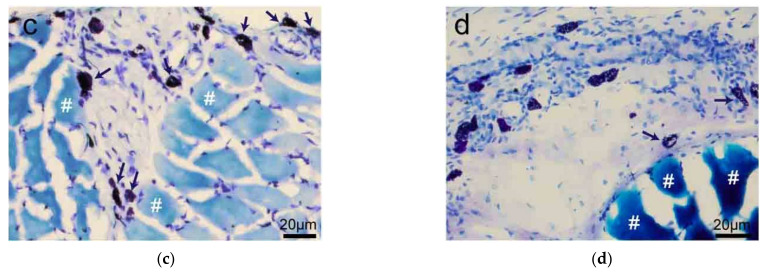
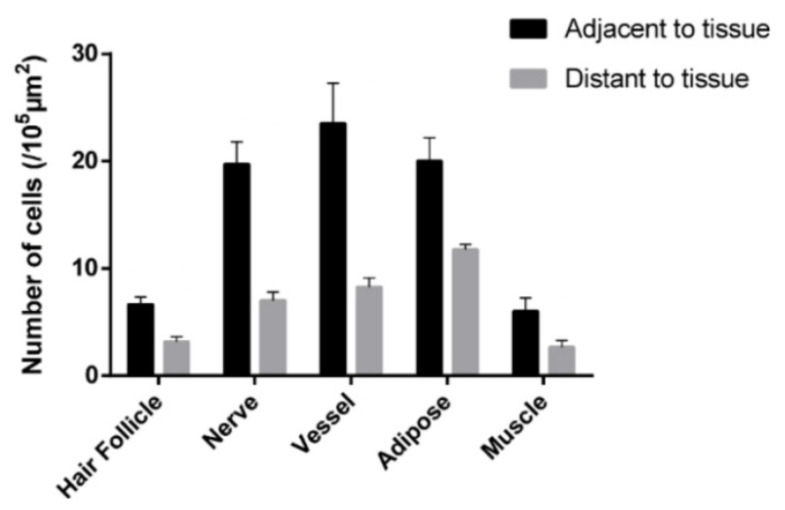
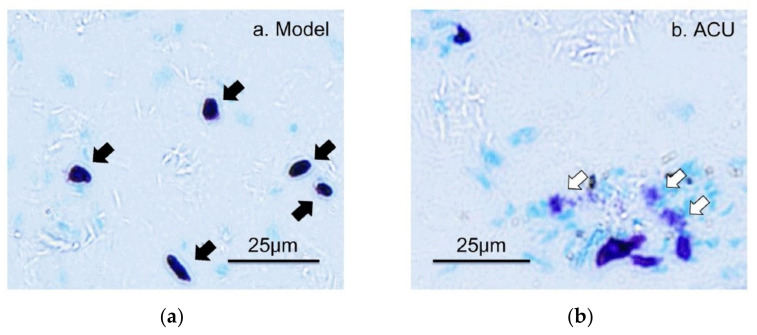
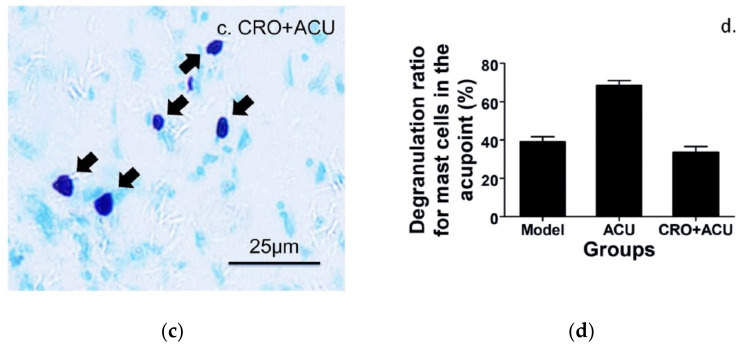
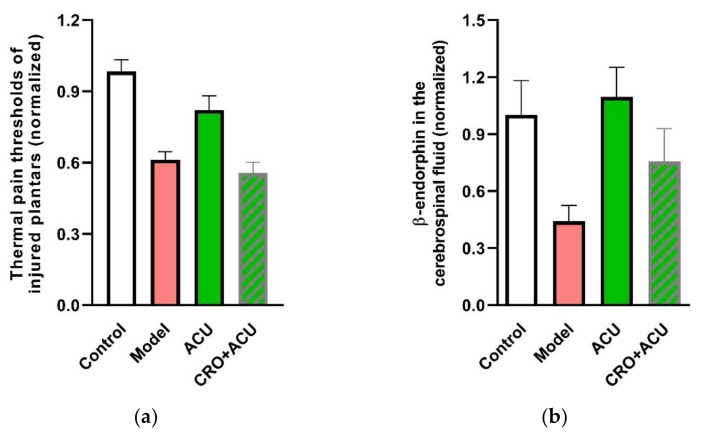
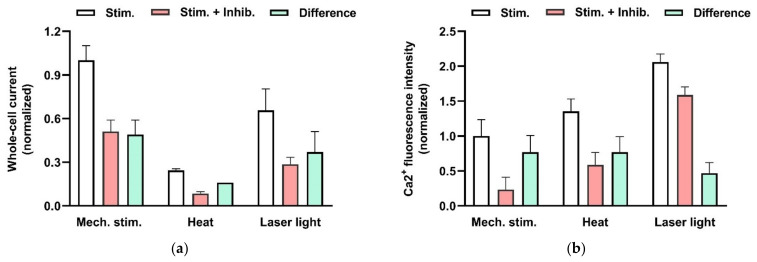
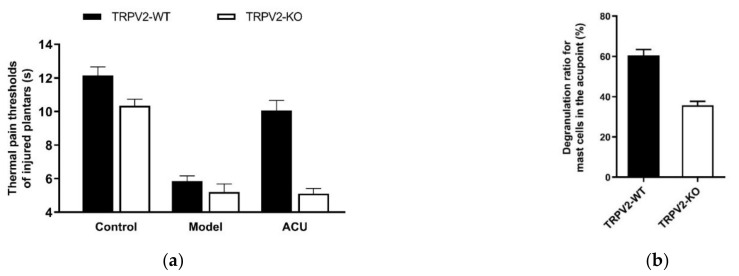
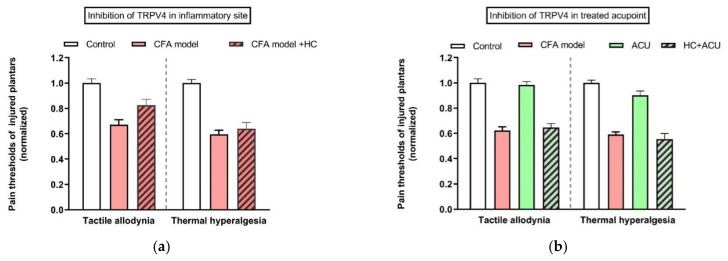
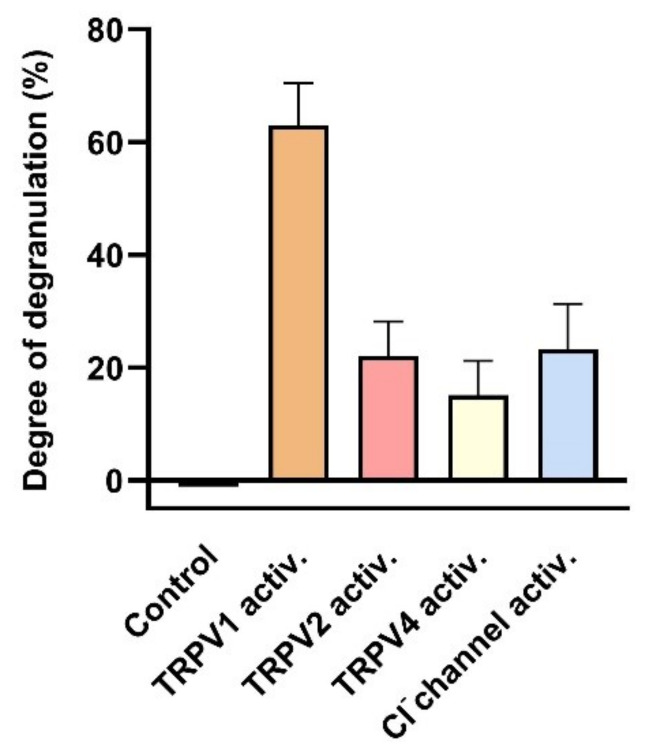
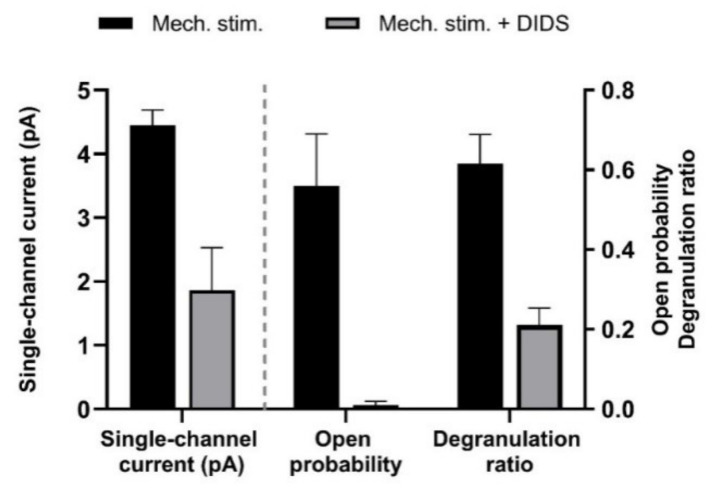
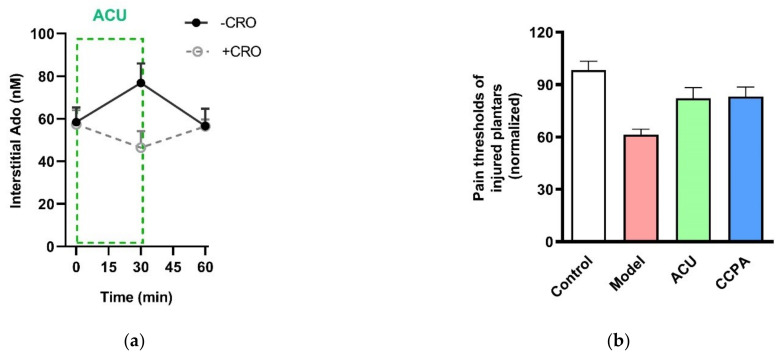
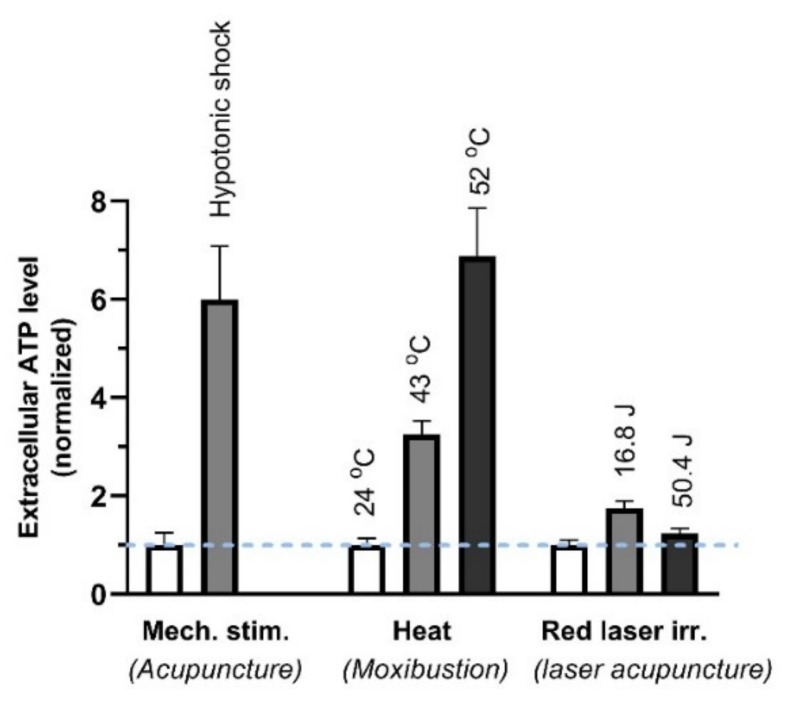
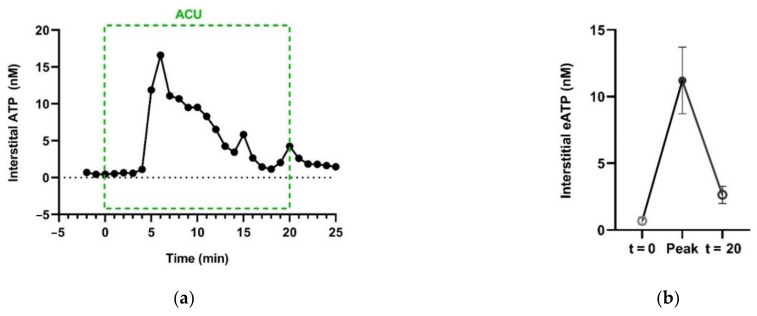
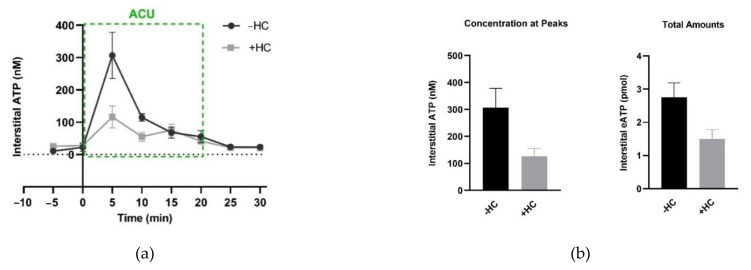
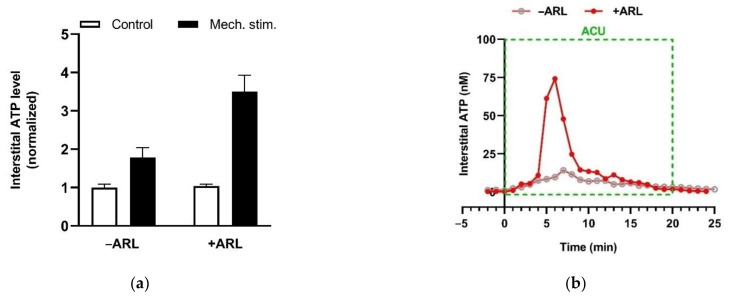
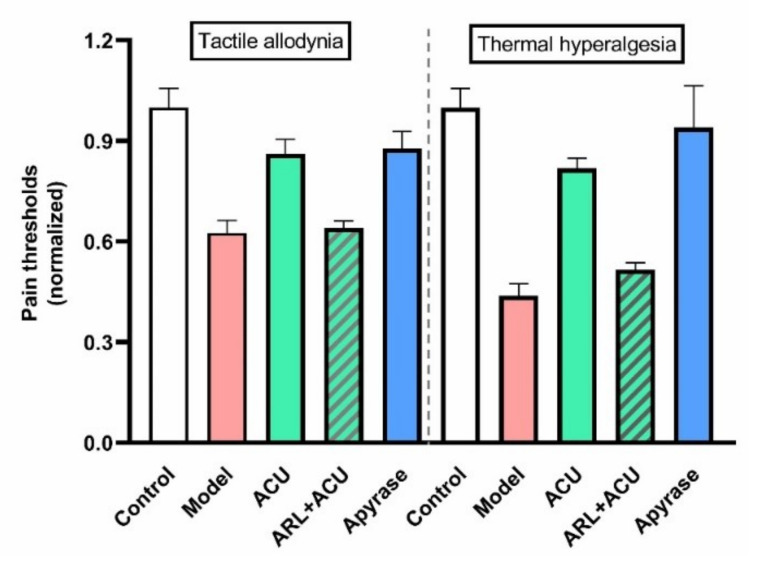
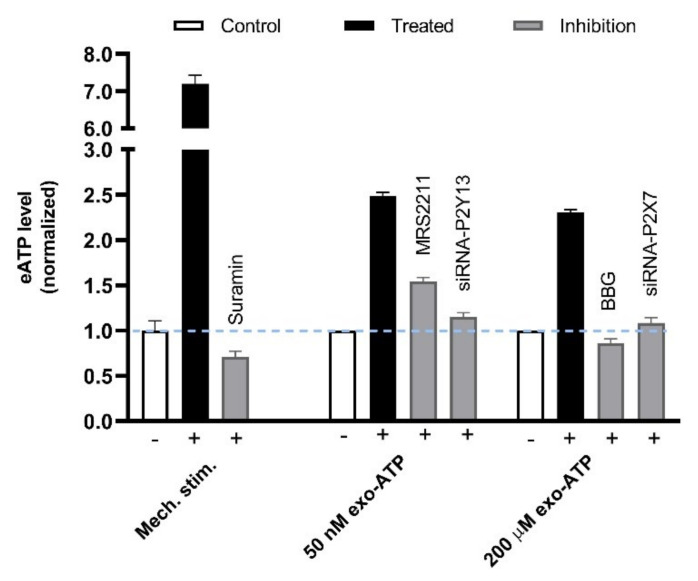
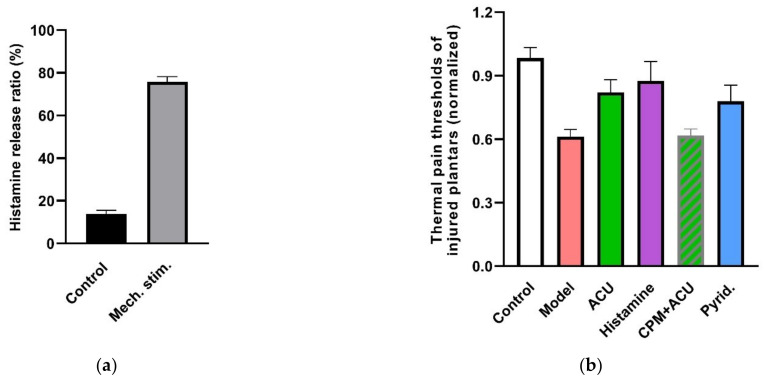
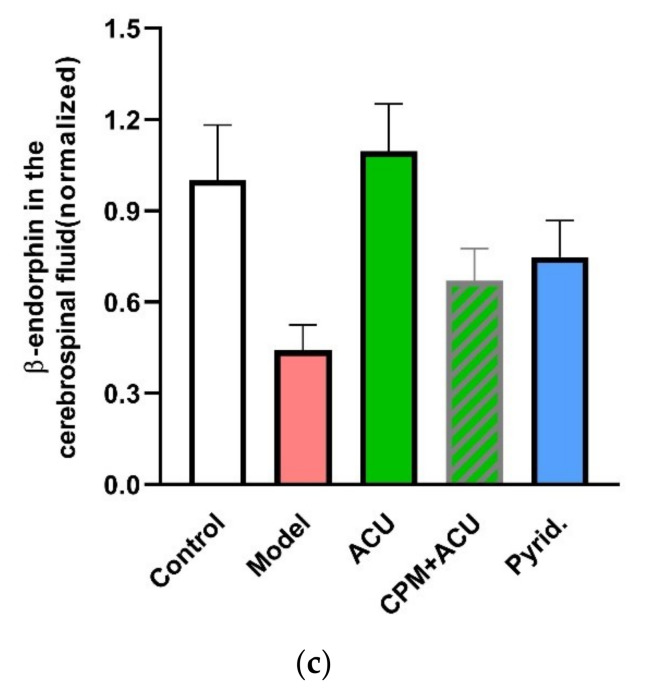
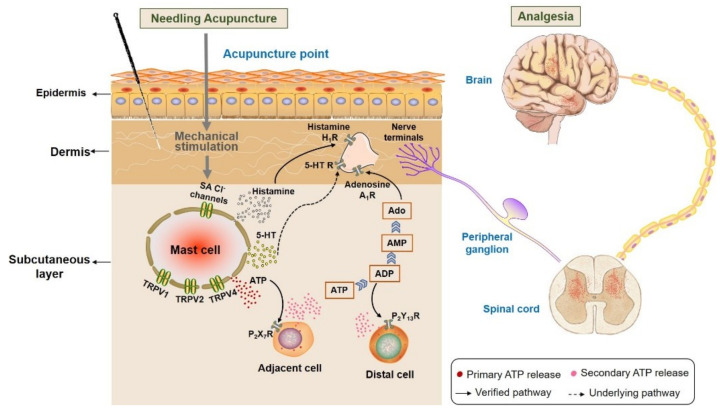
This review summarizes experimental evidence indicating that subcutaneous mast cells are involved in the trigger mechanism of analgesia induced by acupuncture, a traditional oriental therapy, which has gradually become accepted worldwide. The results are essentially based on work from our laboratories. Skin mast cells are present at a high density in acupuncture points where fine needles are inserted and manipulated during acupuncture intervention. Mast cells are sensitive to mechanical stimulation because they express multiple types of mechanosensitive channels, including TRPV1, TRPV2, TRPV4, receptors and chloride channels. Acupuncture manipulation generates force and torque that indirectly activate the mast cells via the collagen network. Subsequently, various mediators, for example, histamine, serotonin, adenosine triphosphate and adenosine, are released from activated mast cells to the interstitial space; they or their downstream products activate the corresponding receptors situated at local nerve terminals of sensory neurons in peripheral ganglia. The analgesic effects are thought to be generated via the reduced electrical activities of the primary sensory neurons. Alternatively, these neurons project such signals to pain-relevant regions in spinal cord and/or higher centers of the brain.

Keywords: TRPV; acupuncture; analgesia; histamine; mast cells; mechanosensitivity; purinergic signals; serotonin.


Conflict of interest statement

The authors declare no conflict of interest.

Figures

Figure 1
Figure 1
Comparison of subcutaneous MC density in acupoints and non-acupoints of normal rabbits. (a,b) Paraffin sections prepared from PC6 acupoints and non-acupoints, respectively. MCs were labeled with toluidine blue and shown as dark spots. Dark blue arrows indicate MCs. (c) Numbers of MCs in PC6 and the non-acupoint. Data represent means + SEM (n = 3), and are based on Zhu et al. (2017) [17], with permission from Springer Nature.
Figure 2
Figure 2
Subcutaneous MC distribution along hair follicles, vessels and nerve fibers of rats. (a) Correlation of MCs and hair follicles in skin examined with immunofluorescence histochemical staining with (a1) tryptase (red), (a2) phalloidin (green) and (a3) DAPI (blue). (b) Correlation of MCs and vessels in skin samples examined with immunofluorescence histochemical staining with (b1) tryptase (red), (b2) phalloidin (green) and (b3) DAPI (blue). Hair follicles and vessels are distinguished by their location and morphological characteristics. (c) Correlation of MCs and hair follicles in skin examined with immunofluorescence histochemical staining with (c1) tryptase (red), (c2) β-III tubulin (green) and (c3) DAPI (blue). Scale bars are shown in the DAPI-stained figure in each group. Based on Yang et al. (2018), [20], with permission from Ivyspring International Publisher.
Figure 3
Figure 3
The distribution of rat MCs along adipose and muscle tissues. (a,b) MCs are distributed along adipose tissue. Adipose tissue is dyed yellow with gathered particles and marked by white asterisks ‘*’ in the figures. (c,d) MCs are distributed along the muscle tissue. The muscle tissue is dyed blue or dark blue and marked by white pound signs ‘#’ in the figures. MCs around the tissue boundaries are marked with dark blue arrows, and the scale bar is shown in the lower right-hand corner of each examined figure. Based on Yang et al. (2018) [20], with permission from Ivyspring International Publisher.
Figure 3
Figure 3
The distribution of rat MCs along adipose and muscle tissues. (a,b) MCs are distributed along adipose tissue. Adipose tissue is dyed yellow with gathered particles and marked by white asterisks ‘*’ in the figures. (c,d) MCs are distributed along the muscle tissue. The muscle tissue is dyed blue or dark blue and marked by white pound signs ‘#’ in the figures. MCs around the tissue boundaries are marked with dark blue arrows, and the scale bar is shown in the lower right-hand corner of each examined figure. Based on Yang et al. (2018) [20], with permission from Ivyspring International Publisher.
Figure 4
Figure 4
Comparison of the MC number at adjacent and distant to hair follicles, nerves, blood vessels, adipose and skeletal muscles in rats. Data represent means + SEM (n = 4–7) and are based on Yang et al. (2018) [20], with permission from Ivyspring International Publisher.
Figure 5
Figure 5
The degranulation of MCs at ST36 induced by acupuncture. (ac) Paraffin sections prepared from ST36 of different groups. Inflammation pain was established by injection of 50 μL Complete Freund’s Adjuvant (CFA) into the left ankle joint cavity to induce acute adjuvant arthritis after rat was anesthetized with 1.5% isoflurane. Inflammatory syndrome, local swelling and behavioral disability appeared within 24 h. Two days later, ipsilateral AP treatment (20 min) was performed on left acupoint ST36. Contained MCs were labeled with toluidine blue. CRO (0.02 g/mL, 20 μL) was pre-injected in treated acupoints 20 min before needling. The dark arrows point to intact MCs and the hollow arrows point to degranulated MCs. (d) Comparison of the degranulation ratio of MCs in ST36 from different groups. Figure is from Huang et al. (2018) [32],with permission from Springer Nature.
Figure 5
Figure 5
The degranulation of MCs at ST36 induced by acupuncture. (ac) Paraffin sections prepared from ST36 of different groups. Inflammation pain was established by injection of 50 μL Complete Freund’s Adjuvant (CFA) into the left ankle joint cavity to induce acute adjuvant arthritis after rat was anesthetized with 1.5% isoflurane. Inflammatory syndrome, local swelling and behavioral disability appeared within 24 h. Two days later, ipsilateral AP treatment (20 min) was performed on left acupoint ST36. Contained MCs were labeled with toluidine blue. CRO (0.02 g/mL, 20 μL) was pre-injected in treated acupoints 20 min before needling. The dark arrows point to intact MCs and the hollow arrows point to degranulated MCs. (d) Comparison of the degranulation ratio of MCs in ST36 from different groups. Figure is from Huang et al. (2018) [32],with permission from Springer Nature.
Figure 6
Figure 6
Contribution of MC degranulation to acupuncture analgesia (a) and β-endorphin increase in the cerebrospinal fluid. (b) Pre-injection of CRO (0.02 g/mL, 20 μL). Establishing of inflammation pain and acupuncture intervention was referred to in the legend of Figure 5. β-endorphin in the cerebrospinal fluid was determined with enzyme linked immunosorbent assay (ELISA). Data represent means + SEM (n = 7–14) and are based on Huang et al. (2018) [32].
Figure 7
Figure 7
Effects of physical stimulation of HMC-1 on whole-cell patch-clamp current (a) and intracellular Ca2+ activity (b) mediated by TRPV2 channels. (a) Currents were recorded at −100 mV and activated by mechanical stress (−60 cm H2O) applied to the patch pipette, by heat (exposure to solution preheated to 53 °C), or by red laser light (at 640 nm and 48 mW). The columns represent the current in the absence (not filled) and the presence (red) of an TRPV inhibitor (20 µM SKF96365 or 10 µM Ruthenium red). In addition, the inhibitor-sensitive, TRPV2-mediated components (difference) are shown (green). The data are normalized to the current signal that can be induced by physical stimuli. The signal changes are significant based on p< 0.05. Data are extracted from Zhang et al. (2012) [38]. (b) Increase in intracellular Ca2+ fluorescence intensity was measure in HMC-1 cells loaded with 4 µM “Calcium Green-1AM”. TRPV2 is activated by mechanical stress (hypotonic solution (240 mOsm compared with 310 mOsm) applied to the cell suspension), by heat (exposure to solution preheated to 53 °C), or by red laser light (at 640 nm and 48 mW). The columns represent the intensities in the absence (not filled) and the presence (red) of an TRPV4 inhibitor (20 µM SKF96365). The TRPV2-mediated Ca2+ increase is considered to the difference (green). The data are normalized to the fluorescence signal that can be induced mechanically. The signal changes are significant based on p< 0.01, and on data from Zhang et al. (2012) [38].
Figure 8
Figure 8
Effects of TRPV2 knock-out on acupuncture analgesia (a) and local MC degranulation (b) in ankle AA mice. Establishing the inflammation pain and acupuncture intervention was referred to in the legend of Figure 5. In (a), data show pain thresholds of injured plantars in response to heat (thermal hyperalgesia) stimulation. In (b), data are obtained from the paraffin sections are prepared from ST36 of wild-type (TRPV2-WT) and TRPV2 deficient (TRPV2-KO) mice. MCs were labeled with toluidine blue and were manually counted under microscope. Data represent means + SEM (n = 10–11). Figure is from Huang et al. (2018) [32] with kind permission from Springer Nature.
Figure 9
Figure 9
Comparison of TRPV4 channel function at sites of inflammation (a) and the treated acupoint (b) of ankle AA rats. Establishing the inflammation pain and acupuncture intervention was referred to in the legend of Figure 5. Data show pain thresholds of injured plantars in response to mechanical (tactile allodynia) or heat (thermal hyperalgesia) stimulation. HC067047 (0.2 mM, 20 μL) (HC), a specific inhibitor of TRPV4, was administrated in the injured plantar 50 min before behavioral test (a), or in the treated ST36 20 min before 30-min needling. (b) Data represent means + SEM (n = 6–9), and are based on data from Zheng et al. (2021) [54].
Figure 10
Figure 10
Degranulation of human MCs induced by activation of TRPV1, TRPV2, TRPV4 and stretch-activated (SA) Cl channels. Degranulation was determined as degree of degranulation induced by the TRPV1 activator capsaicin (1 µM) (data extracted from Gu et al. (2012) [48]), or as the contribution sensitive to specific inhibitors: 20 µM SKF96365 for TRPV2 to degranulation induced by hypotonic stress (230 compared with310 mOsm/L) (data extracted from (Wang and Schwarz (2012) [60]), or 500 nM HC067047 for TRPV4 to degranulation induced by compound 48/80 (data extracted from Mascarenhans et al. (2017) [61]), or 200 µM DIDS for the mechanical SA Cl channel (see Section 3.1.2) (data extracted from Wang and Schwarz (2012) [60]). Data represent averages + SEM.
Figure 11
Figure 11
Effect of mechanical stress on single-channel activity and degranulation ratio of human MCs (HMC-1 cell line). Channel activity was induced in outside-out membrane patches by applying negative pressure to the pipette (−40 cm H2O); the test potential was + 80 mV. 200 µM DIDS reduced single-channel-current amplitude as well as open-state probability. Degranulation was observed under inverted light microscope. Data represent means + SEM (n = 3–4), and are based on Wang et al. (2010) [62].
Figure 12
Figure 12
Contribution of Ado and A1 receptors to acupuncture analgesia. (a) Extracellular Ado level in response to 30-min needing in the absence and presence of CRO. Ado was collected with microdialysis method for each 30 min and assayed with high-performance liquid chromatography. CRO (0.02 g/mL, 20 μL) was pre-injected in treated acupoints of rats 5 min before needling. (b) Changes of thermal pain thresholds of the injured plantars in response to acupuncture or activation of A1 receptors. 2-Chloro-N6-cyclopentyladenosine (CCPA) (0.04 mg/mL, 20 μL), a specific agonist of A1 receptors, was injected in acupoint rats 30 min before behavioral tests. Establishing the inflammation pain and acupuncture intervention was referred to the legend of Figure 5. Data represent means + SEM (n = 7–11) and are based on Huang et al. (2018) [32].
Figure 13
Figure 13
ATP released from MCs (HMC-1 cell line) in response to different stimuli. The cell suspension was perturbed by 3-min, 50% hypotonic shock (of acupuncture), 3-min heat (of moxibustion) or irradiation of 657-nm laser irradiation (280 mW/cm2) (of red laser acupuncture). Energy density (J/cm2) = power density (W/cm2) × time (s). The data represent averages + SEM (n = 4–16) and are based on Wang et al. (2013) and Wang et al. (2015) [46,73].
Figure 14
Figure 14
Acupuncture-induced transient accumulation of interstitial ATP in treated acupoints. (a), Representative trace of ATP concentration in response to needling manipulation, dominated by twirling-rotating (~100 times/min), supplemented with lifting-thrusting (~80 times/min). ATP in the interstitial space was collected with microdialysis method and assayed with luciferase-luciferin assay. (b) Comparison of [eATP] of baseline (t = 0), peak and termination of AP. See Figure 5 legend for the establishment of the inflammation pain and acupuncture intervention. The data represent averages + SEM (n = 4) and are based on data from Zuo et al. (2022) [74].
Figure 15
Figure 15
Effect of TRPV4 channel inhibition at the acupoints on needling-induced eATP accumulation. (a) Time course of eATP changes during AP in the absence and presence of HC067047 (HC) (0.2 mM, 20 μL), a specific antagonist of TRPV4. Each sample contained 5-min microdialysis. (b) Comparison of eATP peaks and the total amounts, respectively, in the absence and presence of HC067047 (0.2 mM, 20 μL). Graphs are based on the same data as (a); eATP amounts were calculated for the area under the curve from 0 min to 20 min. The data represent averages + SEM (n = 4–5). Figure is from Zheng et al. (2021) [54] with kind permission from MDPI.
Figure 16
Figure 16
Ecto-nucleotidase activities in MCs in vitro and in rats acupoint in vivo. (a) Mechanosensitive ATP release from rat MCs (RBL-2H3 cell line) (averages + SEM, n = 4). Medium displacement-induced ATP release was measured in the absence or presence of ARL67156 (100 μM) (n = 6–11). ARL67156 was pre-introduced to cell suspension 20 min before mechanical stimulation. (b) Potentiating effect of ecto-nucleotidase inhibition on acupuncture-induced eATP accumulation in ST36 of ankle AA rats. Representative trace of acupuncture-induced eATP accumulation in the absence or presence of ARL67156 (100 μM), a non-specific antagonist of ecto-nucleotidases, in the microdialysis solution (n = 4). Establishing the inflammation pain and acupuncture intervention was referred to the legend of Figure 5. The data are based on Wang et al. 2020 [83] and Zuo et al. 2022 [74].
Figure 17
Figure 17
Effect of ecto-nucleotidases’ activities on acupuncture analgesia of ankle AA rats. ARL (100 μM, 50 μL) was pre-injected in ST36 20 min ahead of needling (n = 4–5). Apyrase (50 units/mL, 50 μL), soluble form of CD 39, was administrated at the same time point, 50 min before the behavioral test. Establishing the inflammation pain and acupuncture intervention was referred to in Figure 5. The data are based on Zuo et al. 2022 [74].
Figure 18
Figure 18
P2Y13/P2X7 receptors-mediated secondary ATP release from MCs in response to mechanical stimulation. (Left columns), Rat MCs (RBL-2H3 cell line) were irritated by medium displacement that was controlled by electric pipette gun resulting in 6-folds elevation of ATP released to the extracellular space. Such mechanosensitive ATP release could be dampened by the presence of Suramin (100 μM) that was pre-introduced to cells 20 min before stimulation. (Middle columns), 50 nM exogenous ATP (exo-ATP) triggered endogenous ATP release. Exo-ATP was introduced to cells and contained eATP level was assayed immediately. MRS2211 (n = 13), a specific antagonist of P2Y13, or P2Y13 gene interference (n = 4) was used to suppress 50 nM exo-ATP-mediated secondary ATP release. (Right columns), 200 μM exo-ATP triggered endogenous ATP release. BBG (n = 4), a specific antagonist of P2X7, or P2X7 gene interference (n = 4) was used to suppress 200 μM exo-ATP-mediated secondary ATP release. Data are means + SEM (n = 3–11) and are based on Shen et al. (2020) [83].
Figure 19
Figure 19
Contribution of histamine and histamine H1 receptors to acupuncture analgesia. (a) Mechanosensitive histamine release from HMC-1 cells in response to 240 mOsm-hypotonic shock. Fluorescence intensity in cell supernatants and lyses solutions was determined by fluorescence spectrometer (Hitachi, F-4500) (λex = 350 nm, λem = 440 nm). Released histamine was calculated as the ratio of fluorescences (n = 3). (b), Effect of histamine and H1 receptors on acupuncture analgesia (n = 10–13). (c) Effect of histamine H1 receptors on β-endorphin level in the cerebrospinal fluid (n = 7–10). CPM (0.4 mg/mL, 50 μL), a specific antagonist of H1 receptors, was pre-injected in ST36 5 min ahead of needling (n = 10). Histamine (100 μL/mL, 50 μL) or 2-pyridineethanamine dihydrochloride (Pyrid.) (200 μg/mL, 50 μL), a specific agonist of H1 receptors, was injected at the same time point (n = 10). β-endorphin was determined with ELISA. Establishing the inflammation pain and acupuncture intervention was referred to in the legend of Figure 5. Data are means + SEM and are based on Huang et al. (2010) [89], Zhang et al. (2012) [38] and Huang et al. (2018) [32].
Figure 19
Figure 19
Contribution of histamine and histamine H1 receptors to acupuncture analgesia. (a) Mechanosensitive histamine release from HMC-1 cells in response to 240 mOsm-hypotonic shock. Fluorescence intensity in cell supernatants and lyses solutions was determined by fluorescence spectrometer (Hitachi, F-4500) (λex = 350 nm, λem = 440 nm). Released histamine was calculated as the ratio of fluorescences (n = 3). (b), Effect of histamine and H1 receptors on acupuncture analgesia (n = 10–13). (c) Effect of histamine H1 receptors on β-endorphin level in the cerebrospinal fluid (n = 7–10). CPM (0.4 mg/mL, 50 μL), a specific antagonist of H1 receptors, was pre-injected in ST36 5 min ahead of needling (n = 10). Histamine (100 μL/mL, 50 μL) or 2-pyridineethanamine dihydrochloride (Pyrid.) (200 μg/mL, 50 μL), a specific agonist of H1 receptors, was injected at the same time point (n = 10). β-endorphin was determined with ELISA. Establishing the inflammation pain and acupuncture intervention was referred to in the legend of Figure 5. Data are means + SEM and are based on Huang et al. (2010) [89], Zhang et al. (2012) [38] and Huang et al. (2018) [32].
Figure 20
Figure 20
Activation of subcutaneous MCs triggers acupuncture analgesic effect. Needling acupuncture introduces physical stimuli to the treated acupoints. Subcutaneous MCs are activated to release various biological substances, including histamine, serotonin (5-HT) and ATP, through activating mechanosensitive channels. Subsequently, these substances or their downstream products bind to the corresponding receptors situated at local nerve terminals, or they mediate other cells to release ATP to amplify the local biochemical signals. Eventually, peripheral nerve endings ascend acupuncture signals to the peripheral ganglia, then to the spinal cord or upper spinal cord to generate analgesia.

References

    1. Gereau R.W., Sluka K.A., Maixner W., Savage S.R., Price T.J., Murinson B.B., Sullivan M.D., Fillingim R.B. A pain research agenda for the 21st century. J. Pain. 2014;15:1203–1214. doi: 10.1016/j.jpain.2014.09.004. - DOI - PMC - PubMed
    1. Wang X., Yao W., Huang M., Zhang D., Xia Y. Signal Transduction in Acupoints. In: Xia Y., editor. Advanced Acupuncture Research: From Bench to Bedside. Springer; Berlin/Heidelberg, Germany: 2022.
    1. Chon T.Y., Mallory M.J., Yang J., Bublitz S.E., Do A., Dorsher P.T. Laser acupuncture: A concise review. Med. Acupunct. 2019;31:164–168. doi: 10.1089/acu.2019.1343. - DOI - PMC - PubMed
    1. Metcalfe D.D., Baram D., Mekori Y.A. Mast cells. Physiol. Rev. 1997;77:1033–1079. doi: 10.1152/physrev.1997.77.4.1033. - DOI - PubMed
    1. Kitamura Y., Go S., Hatanaka K. Decrease of mast cells in W/Wv mice and their increase by bone marrow transplantation. Blood. 1978;52:447–452. doi: 10.1182/blood.V52.2.447.447. - DOI - PubMed

Publication types

LinkOut - more resources