. 2022 Feb 26;11(5):821.
doi: 10.3390/cells11050821.

miRNA-Dependent Regulation of AKT1 Phosphorylation

Affiliations

miRNA-Dependent Regulation of AKT1 Phosphorylation

Mallory I Frederick et al. Cells. .

Abstract

The phosphoinositide-3-kinase (PI3K)/AKT pathway regulates cell survival and is over-activated in most human cancers, including ovarian cancer. Following growth factor stimulation, AKT1 is activated by phosphorylation at T308 and S473. Disruption of the AKT1 signaling pathway is sufficient to inhibit the epithelial-mesenchymal transition in epithelial ovarian cancer (EOC) cells. In metastatic disease, adherent EOC cells transition to a dormant spheroid state, characterized previously by low S473 phosphorylation in AKT1. We confirmed this finding and observed that T308 phosphorylation was yet further reduced in EOC spheroids and that the transition from adherent to spheroid growth is accompanied by significantly increased levels of let-7 miRNAs. We then used mechanistic studies to investigate the impact of let-7 miRNAs on AKT1 phosphorylation status and activity in cells. In growth factor-stimulated HEK 293T cells supplemented with let-7a, we found increased phosphorylation of AKT1 at T308, decreased phosphorylation at S473, and enhanced downstream AKT1 substrate GSK-3β phosphorylation. Let-7b and let-7g also deregulated AKT signaling by rendering AKT1 insensitive to growth factor simulation. We uncovered let-7a-dependent deregulation of PI3K pathway components, including PI3KC2A, PDK1, and RICTOR, that govern AKT1 phosphorylation and activity. Together, our data show a new role for miRNAs in regulating AKT signaling.

Keywords: miRNA; oncogenic kinase; posttranslational modification; protein phosphorylation; signaling.


Conflict of interest statement

The authors declare no conflict of interest. The funders had no role in the design of the study; in the collection, analyses, or interpretation of data; in the writing of the manuscript, or in the decision to publish the results.

Figures

Figure 1
Figure 1
miRNA let-7a and epidermal growth factor stimulation control AKT1 phosphorylation by regulating PIK3C2A and RICTOR. Overview of the PI3K/AKT pathway and contributions of let-7a. Receptor tyrosine kinases (RTKs) are activated by epidermal growth factor (EGF) stimulation, leading to activation of PIK3C2A. Active PIK3C2A phosphorylates PtdIns (4,5) P2 (PIP2), converting it to PtdIns (3–5) P3 (PIP3). PIP3 recruits PDK1 and AKT1 to the cell membrane, leading to activation of PDK1, which subsequently phosphorylates AKT1 at Thr-308, activating the kinase. Fully activated AKT1 is formed by the additional phosphorylation of Ser-473 by mTORC2 and phosphorylates various cellular substrates. The AKT1 substrate TENT2 is inactivated by Ser-116 phosphorylation. Arrows indicate positive regulation, and flatheads indicate inhibition. Glows indicate proteins activated upon EGF stimulation. The established AKT pathway (black arrows) are shown along with the novel signaling pathway we identified (yellow highlights), where miRNA let-7a, a substrate of TENT2, forms a feedback mechanism wherein it inhibits the mTORC2 member RICTOR and increases PIK3C2A, leading to changes in downstream signaling.
Figure 2
Figure 2
AKT phosphorylation and let-7 miRNA levels are inversely correlated in epithelial ovarian cancer metastasis. (A) Western blots of pan-AKT and pAKT protein levels were (B) quantified from adherent (grey squares) and spheroid (blue circles) TOV-21G ovarian cancer cells. Representative images of TOV-21G epithelial ovarian cancer (EOC) cells grown as (C) adherent and (D) spheroid cultures for 72 h. Scale bars indicate 400 nm. (E) RT-qPCR of let-7 family miRNAs in adherent (grey squares) and spheroid (blue circles) TOV-21G EOC cells. The data include n = 3 or n = 6 biological replicates. Error bars show ± 1 SEM. Asterisks indicate significance (ns, not significant; * p < 0.05; ** p < 0.01, *** p < 0.001).
Figure 3
Figure 3
AKT phosphorylation is downregulated in let-7a transfected cells. (A) RT-qPCR of let-7a miRNA levels in unstimulated HEK 293T cells transfected with 60 fmol let-7a (purple triangles) or a control transfection lacking RNA (black circles). (B) Western blots of AKT isoforms and pAKT protein levels were (C) quantified in cells treated as in (A). The data include n = 3 biological replicates. Error bars show ± 1 SEM. Asterisks indicate significance (ns, not significant; * p < 0.05; *** p < 0.001).
Figure 4
Figure 4
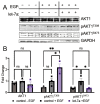
let-7a deregulates AKT1 phosphorylation in epidermal growth factor stimulated cells. (A) Western blots and (B) quantification of mCherry-AKT1 and mCherry-pAKT1 levels in HEK 293T cells co-transfected with 5 µg mCherry-AKT1 plasmid and 60 fmol let-7a (purple) or a control lacking RNA (black) for 24 h and stimulated with epidermal growth factor (EGF, square symbols) or without (circle symbols) EGF for 15 min. The data include n = 3 biological replicates. Error bars show ± 1 SEM. Asterisks indicate significance (ns, not significant; * p < 0.05; ** p < 0.01).
Figure 5
Figure 5
let-7a activation of AKT1 increases downstream phosphorylation of the substrate GSK-3. (A) Western blots and (B) quantification of GSK-3 and pGSK-3 in HEK 293T cells co-transfected with 60 fmol let-7a (purple squares) or a control lacking RNA (black circles) and mCherry-AKT1 for 24 h and stimulated with epidermal growth factor (EGF) for 15 min. (C) Western blots and (D) quantification of GSK-3 and pGSK-3 in HEK 293T cells co-transfected 60 fmol let-7b (pink squares) or a control lacking RNA (black circles) and mCherry-AKT1 for 24 h and stimulated with epidermal growth factor (EGF) for 15 min. (E) Western blots and (F) quantification of GSK-3 and pGSK-3 in COS-7 cells co-transfected with 60 fmol let-7a (purple squares) or a control lacking RNA (black circles) and mCherry-AKT1 for 24 h and stimulated with epidermal growth factor (EGF) for 15 min. Note that all graphs show relative phosphorylation of the AKT substrate GSK-3 in respective experimental conditions. The data include n = 3 biological replicates. Error bars show ± 1 SEM. Asterisks indicate significance (ns, not significant; * p < 0.05, ** p < 0.01).
Figure 6
Figure 6
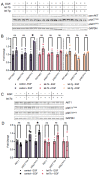
let-7b and let-7g regulate phosphorylation of AKT at Ser-473. (A) Western blots and (B) quantification of pan-AKT and pAKT protein levels in HEK 293T cells transfected with 60 fmol let-7b (pink), let-7g (orange), or no RNA control (grey) for 24 h and stimulated with epidermal growth factor (EGF, square symbols) or without (circle symbols) EGF for 15 min. (C) Western blots and (D) quantification of mCherry-AKT1 and mCherry-pAKT1 levels in HEK 293T cells co-transfected with 5 µg mCherry-mAKT1 plasmid and 60 fmol let-7b (pink) or a control lacking RNA (grey) for 24 h and stimulated with (square symbols) or without (circle symbols) EGF for 15 min. The data include n = 3 biological replicates. Error bars show ± 1 SEM. Asterisks indicate significance (ns, not significant; * p < 0.05).
Figure 7
Figure 7
Let-7a deregulates AKT1 phosphorylation via PIK3C2A and RICTOR. (A,B) Western blots and (C) quantification of PDK1, RICTOR, PIK3C2A, and mTOR in HEK 293T cells transfected 60 fmol let-7a (purple squares) or a control lacking RNA (black circles) for 24 h. Cells in (A) were stimulated with EGF for 15 min. (D) RT-qPCR of PIK3C2A mRNA from cells transfected with 60 fmol let-7a (purple squares) or a control lacking RNA (black circles) for 24 h and stimulated with EGF for 15 min. The data include n = 3 biological replicates. Error bars show ± 1 SEM. Asterisks indicate significance (ns, not significant; * p < 0.05).

References

    1. Karege F., Perroud N., Schurhoff F., Méary A., Marillier G., Burkhardt S., Ballmann E., Fernández R., Jamain S., Leboyer M., et al. Association ofAKT1gene variants and protein expression in both schizophrenia and bipolar disorder. Genes Brain Behav. 2010;9:503–511. doi: 10.1111/j.1601-183X.2010.00578.x. - DOI - PubMed
    1. Correa R.J.M., Peart T., Valdes Y.R., DiMattia G.E., Shepherd T.G. Modulation of AKT activity is associated with reversible dormancy in ascites-derived epithelial ovarian cancer spheroids. Carcinogenesis. 2011;33:49–58. doi: 10.1093/carcin/bgr241. - DOI - PubMed
    1. Peart T.M., Correa R.J.M., Valdes Y.R., DiMattia G.E., Shepherd T.G. BMP signalling controls the malignant potential of ascites-derived human epithelial ovarian cancer spheroids via AKT kinase activation. Clin. Exp. Metast. 2012;29:293–313. doi: 10.1007/s10585-011-9451-3. - DOI - PubMed
    1. Manning B.D., Toker A. AKT/PKB Signaling: Navigating the Network. Cell. 2017;169:381–405. doi: 10.1016/j.cell.2017.04.001. - DOI - PMC - PubMed
    1. Linnerth-Petrik N.M., Santry L.A., Moorehead R., Jücker M., Wootton S.K., Petrik J. Akt isoform specific effects in ovarian cancer progression. Oncotarget. 2016;7:74820–74833. doi: 10.18632/oncotarget.11204. - DOI - PMC - PubMed

Publication types

MeSH terms