. 2022 Mar 1;11(5):842.
doi: 10.3390/cells11050842.

Pyk2 Regulates MAMs and Mitochondrial Dynamics in Hippocampal Neurons

Affiliations

Pyk2 Regulates MAMs and Mitochondrial Dynamics in Hippocampal Neurons

Laura López-Molina et al. Cells. .

Abstract

Pyk2 is a non-receptor tyrosine kinase enriched in hippocampal neurons, which can be activated by calcium-dependent mechanisms. In neurons, Pyk2 is mostly localised in the cytosol and dendritic shafts but can translocate to spines and/or to the nucleus. Here, we explore the function of a new localisation of Pyk2 in mitochondria-associated membranes (MAMs), a subdomain of ER-mitochondria surface that acts as a signalling hub in calcium regulation. To test the role of Pyk2 in MAMs' calcium transport, we used full Pyk2 knockout mice (Pyk2-/-) for in vivo and in vitro studies. Here we report that Pyk2-/- hippocampal neurons present increased ER-mitochondrial contacts along with defective calcium homeostasis. We also show how the absence of Pyk2 modulates mitochondrial dynamics and morphology. Taken all together, our results point out that Pyk2 could be highly relevant in the modulation of ER-mitochondria calcium efflux, affecting in turn mitochondrial function.

Keywords: ER-mitochondria contact sites; calcium; hippocampus; neuron.


Conflict of interest statement

The authors declare no conflict of interest.

Figures
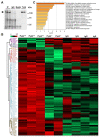
Figure 1
Figure 1
Identification of Pyk2 molecular interactors in the hippocampus. (A) Immunoprecipitation (IP) assay was performed in protein extracts from adult (4-month-old) wild-type hippocampal tissue. IgG antibodies were used as a control of the assay and total lysates were added as a control of the antibody immunoreactivity. The arrowhead depicts Pyk2; (B) Heatmap representation showing both clustering and the intensity for the immunoprecipitated proteins in each biological condition; (C) Statistically enriched biofunctions from Pyk2-associated proteins (from light blue cluster in Figure 1B; see Supplementary Table S2 for details).
Figure 2
Figure 2
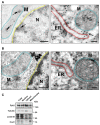
Characterisation of Pyk2 localisation in mitochondria and MAMs. (A) Electron microscopy images from hippocampal pyramidal neurons with Pyk2-immunogold labelling shows how Pyk2 is localised in the inner part of mitochondria (M), inside nucleus (N) and in the ER-mitochondria contact sites. Scale bars: left panel 0.4 µm, right panel 0.06 µm; (B) Negative control without Pyk2 antibody in hippocampal sections of Pyk2+/+ mice. Scale bars: left panel 0.4 µm, right panel 0.06 µm. In (A,B), blue lines delimit mitochondria, red lines the ER and yellow lines the nucleus; (C) Immunoblotting for Pyk2, Tubulin, Lamin B and CoxV in different subcellular fractions of a representative sample from mitochondrial isolation of hippocampus of Pyk2+/+ mouse.
Figure 3
Figure 3
Pyk2 ablation induces increased number of ER–mitochondria contact sites in vivo and in vitro. (A) Densitometry quantification and representative immunoblotting of IP3R3 (Student t-test, t = 3.457, df = 27; * p < 0.05) and VDAC1 (Mann–Whitney test, A, B = 189, 339, U = 69; * p < 0.05) in total lysates of hippocampus from Pyk2+/+ and Pyk2−/− mice. Actin or tubulin were used as loading control. Molecular weight markers positions are indicated in kDa in the right panel. Each point represents an animal; (B) Quantification of MAMs in vivo in hippocampal slices from mice (Student t-test, t = 9.936, df = 4; p < 0.001) and representative images of electron microscopy. Black arrows indicate MAMs and blue area delineate the analysed region. Scale bar, 0.5 µm; (C) MAMs were quantified in vitro by proximity ligation assay measuring VDAC1-IP3R3 interaction in neurites of hippocampal primary neurons. In (C) left panel, quantification shows more MAMs (Student t-test, t = 3.307, df = 46; p < 0.01) in Pyk2−/− primary neurons. In (C) right panel, representative confocal images with interactions between the two targeted proteins in red and anti-MAP2 in green. Scale bar, 10 microns. Data are means ± SEM. Student t-test p values are: ** p < 0.01, *** p < 0.001 vs. Pyk2+/+. In (A), n = 12–19 animals/group; in (B), 50 mitochondria of 6 neurons, from 3 different animals.; in (C), n = 20–28 neurons/group from 4 different cultures.
Figure 4
Figure 4
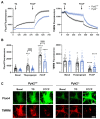
Regulation of cytosolic calcium levels is affected in hippocampal neurons devoid of Pyk2. Pyk2+/+ and Pyk2−/− primary neurons were loaded with Fluo4 (5 μM) and TMRM (20 nM) to label intracellular calcium and mitochondrial membrane potential, respectively. Neurons were stimulated with thapsigargin (TG, 0.5 μM) at 50 s and with FCCP (2 μM) at 7.5 min. (A) Fluo4 and TMRM fluorescence traces from Pyk2+/+ (black) and Pyk2−/− (blue) throughout the experiment. Black arrows indicate the injection point of the treatment; (B) Quantification of fluorescence intensity of Fluo4 (left panel) or TMRM (right panel) at basal condition and after TG or FCCP treatment; (C) Representative confocal images of Fluo4 (green) and TMRM (red) fluorescence in basal conditions and after TG and FCCP exposure. Scale bar, 10 microns. Data are mean ± SEM. n = 55–62 neurons/genotype from 4 different cultures. * p < 0.05, *** p < 0.001, **** p < 0.0001 vs. basal Pyk2+/+; $$$$ p < 0.001 vs. Pyk2+/+ at each condition determined by two-way ANOVA.
Figure 5
Figure 5
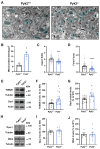
Mitochondrial dynamics and related proteins in hippocampus of Pyk2−/− mice. (A) Representative electron microscopy images of pyramidal neurons in hippocampal tissue sections from Pyk2+/+ (left panel) and Pyk2−/− (right panel) mice. Blue lines delimit mitochondria. Scale bar, 1 µm; (B) Mitochondrial density quantification in Pyk2+/+ and Py2−/− hippocampal pyramidal neurons from (A); Aspect Ratio (C), Mann–Whitney test, (A,B) = 11,883, 9438, U = 2298; p < 0.0001) and Form Factor; (D), Mann–Whitney test, A,B = 11,769, 9552, U = 2412; p < 0.0001) of results in (A) were also determined; (EG) Immunoblotting and its quantification of TOM20 ((E,F), Student t-test, t = 2.175, df = 30; p < 0.05) and Drp1 ((E,G), Student t-test, t = 2.455, df = 27; p < 0.05) protein levels in dorsal hippocampus of Pyk2+/+ and Pyk2−/− mice; (HJ) Immunoblotting and its quantification of Opa-1 (Student t-test, t = 0.7007, df = 12; p = 0.4968) and Mfn2 (Student t-test, t = 0.0009984, df = 12; 0.9992) protein levels in hippocampus of Pyk2+/+ and Pyk2−/− mice. Actin or tubulin were used as loading control. Molecular weight markers positions are indicated in kDa in (E,H); Data represent mean ± SEM In (C,D), n = 87 Pyk2+/+ and n = 119 Pyk2−/− mitochondria from 3 different mice per group; Animals, in (F), Pyk2+/+ n = 12 and Pyk2−/− n = 16; in (G), Pyk2+/+ n = 15 and Pyk2−/− n = 14; in (I,J), Pyk2+/+ n = 5 and Pyk2−/− n = 9. * p < 0.05, *** p < 0.001, **** p < 0.0001 vs. Pyk2+/+.
Figure 6
Figure 6
Alterations in mitochondrial morphology in Pyk2−/− primary hippocampal neurons. Hippocampal primary neurons from Pyk2+/+ and Pyk2−/− embryos were cultured until DIV21. (A) In the upper panel, confocal images of immunolabeling of hippocampal primary neurons with TOM20 (green) and MAP2 (red). White lines delimit the analysed region. In the lower panel, correspondent binary image with the analysed mitochondria in black with white background. Scale bar, 1 micron; (BD) Pyk2−/− neurons presented mitochondrial fragmentation as indicated by three different parameters namely: Increased (B) number of mitochondria per micron (Student t-test, t = 6.834, df = 258; p < 0.0001); lower (C) Aspect Ratio (Mann–Whitney t-test, A: 11,659, B: 14906, U: 5036, p = 0.0101) and lower (D) Form Factor (Mann–Whitney t-test, A: 20,567, B: 15,748, U: 5878, p < 0.0001). Data are means ± SEM of 15–20 neurons from 8 different embryos per genotype (n = 128–140). * p < 0.05, **** p < 0.0001 vs. Pyk2+/+.
Figure 7
Figure 7
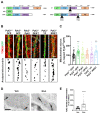
Mechanisms of Pyk2-dependent modulation of mitochondrial density. (A) Cultured hippocampal neurons were transfected with plasmids expressing only GFP or Pyk2 or Pyk2 with the indicated mutations namely: DFAT (Pyk2 without the entire FAT domain), YF (Pyk2 with a point mutation in the tyrosine 402 residue for an alanine) and RRST (with four-point mutations in the import/export nuclear domains called R184A, R185A, S747A and T749A); (B) Hippocampal primary neurons from Pyk2+/+ and Pyk2−/− mice at 21 DIV. In the upper panel, immunostaining of TOM20 (red) and GFP expressed by the plasmids (green). In the lower panel, correspondent binary image with the analysed mitochondria in black with white background. Scale bar, 3 microns; (C) Quantification of number of mitochondria as in (B) (one-way ANOVA, F(5, 258) = 4.881, p = 0.0003). Tukey’s multiple comparisons test was used as a post hoc. Tukey’s post hoc p values are: ** p < 0.01 vs. Pyk2+/+:GFP group; n = 35–40 neurons/group from 4 different cultures; (D) Pyk2 presence (gold particles) in the mitochondria of Pyk2+/+ cultured hippocampal neurons upon vehicle or glutamate treatment for 15 min (40 µm, electronic microscopy imaging). Scale bar, 0.1 µm; (E) Quantification of results (relative to vehicle group) as in (D) (Mann–Whitney test, (A,B) = 271, 259, U = 40; **** p < 0.0001). n = 21/20 mitochondria/group from 7 different cultured pyramidal neurons/group. Data are means ± SEM.

Similar articles

Cited by

References

    1. Lev S., Moreno H., Martinez R., Canoll P., Peles E., Musacchio J.M., Plowman G.D., Rudy B., Schlessinger J. Protein tyrosine kinase PYK2 involved in Ca2+-induced regulation of ion channel and MAP kinase functions. Nature. 1995;376:737–745. doi: 10.1038/376737a0. - DOI - PubMed
    1. Giralt A., Brito V., Chevy Q., Simonnet C., Otsu Y., Cifuentes-Díaz C., De Pins B., Coura R., Alberch J., Ginés S., et al. Pyk2 modulates hippocampal excitatory synapses and contributes to cognitive deficits in a Huntington’s disease model. Nat. Commun. 2017;8:15592. doi: 10.1038/ncomms15592. - DOI - PMC - PubMed
    1. Corvol J.-C., Valjent E., Toutant M., Enslen H., Irinopoulou T., Lev S., Hervé D., Girault J.-A. Depolarization Activates ERK and Proline-rich Tyrosine Kinase 2 (PYK2) Independently in Different Cellular Compartments in Hippocampal Slices. J. Biol. Chem. 2005;280:660–668. doi: 10.1074/jbc.M411312200. - DOI - PubMed
    1. Menegon A., Burgaya F., Baudot P., Dunlap D.D., Girault J.-A., Valtorta F. FAK + and PYK2/CAKβ, two related tyrosine kinases highly expressed in the central nervous system: Similarities and differences in the expression pattern. Eur. J. Neurosci. 1999;11:3777–3788. doi: 10.1046/j.1460-9568.1999.00798.x. - DOI - PubMed
    1. Faure C., Corvol J.-C., Toutant M., Valjent E., Hvalby O., Jensen V., El Messari S., Corsi J.-M., Kadare G., Girault J.-A. Calcineurin is essential for depolarization-induced nuclear translocation and tyrosine phosphorylation of PYK2 in neurons. J. Cell Sci. 2007;120:3034–3044. doi: 10.1242/jcs.009613. - DOI - PubMed

Publication types