

Inhibitory Neurotransmission Is Sex-Dependently Affected by Tat Expression in Transgenic Mice and Suppressed by the Fatty Acid Amide Hydrolase Enzyme Inhibitor PF3845 via Cannabinoid Type-1 Receptor Mechanisms
- PMID: 35269478
- PMCID: PMC8909692
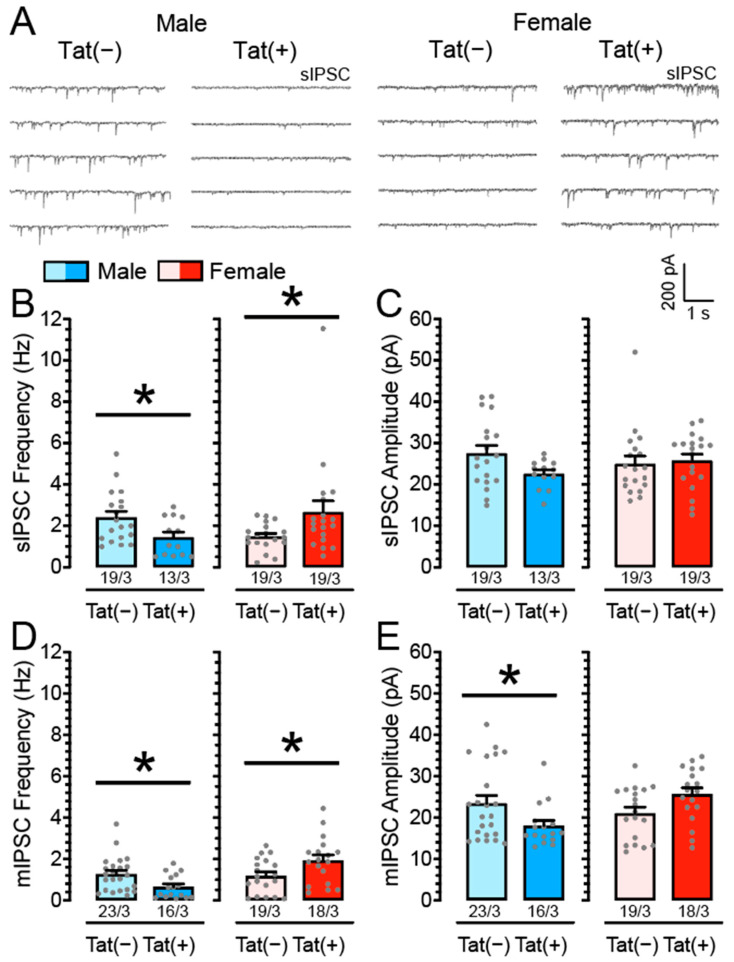
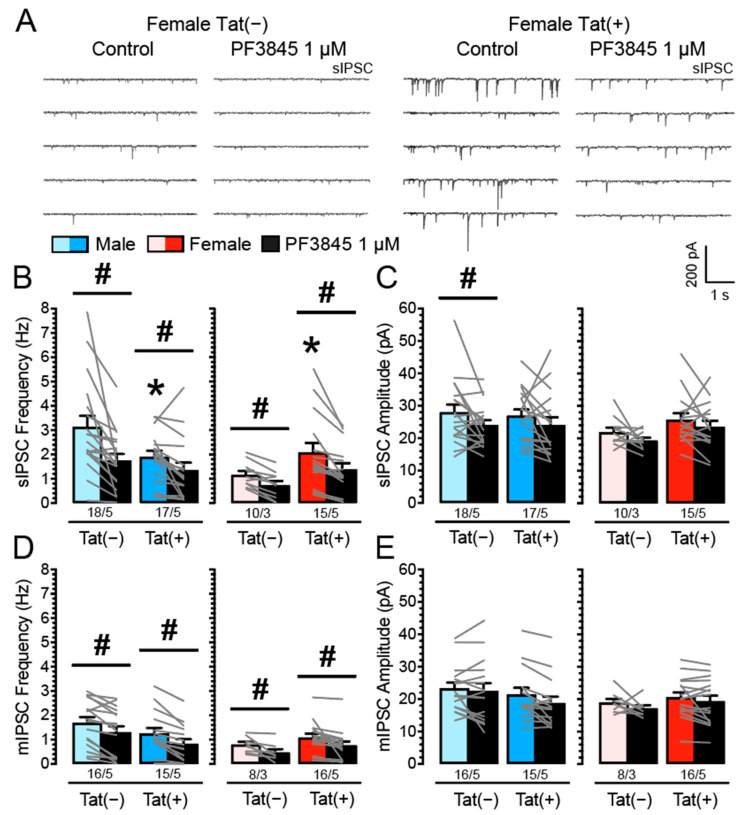
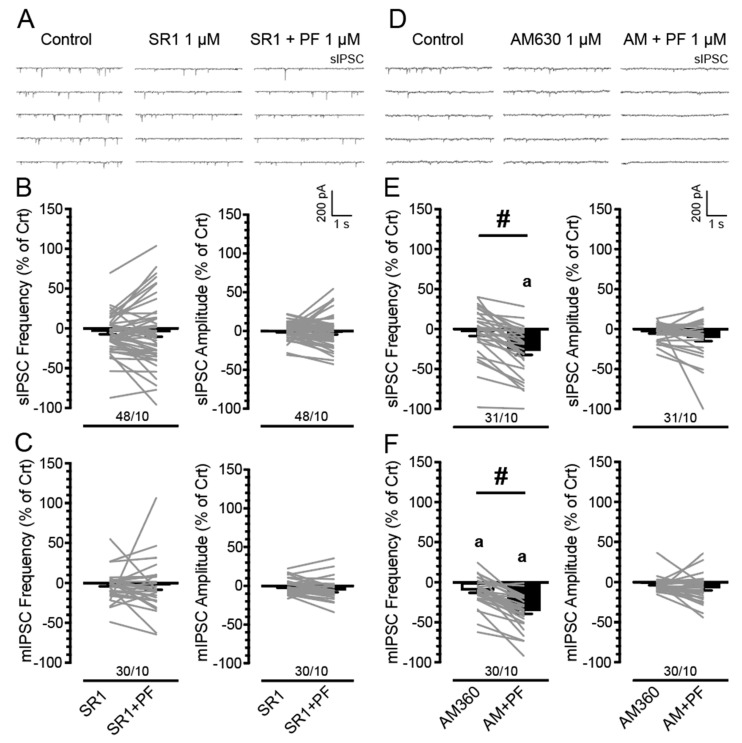
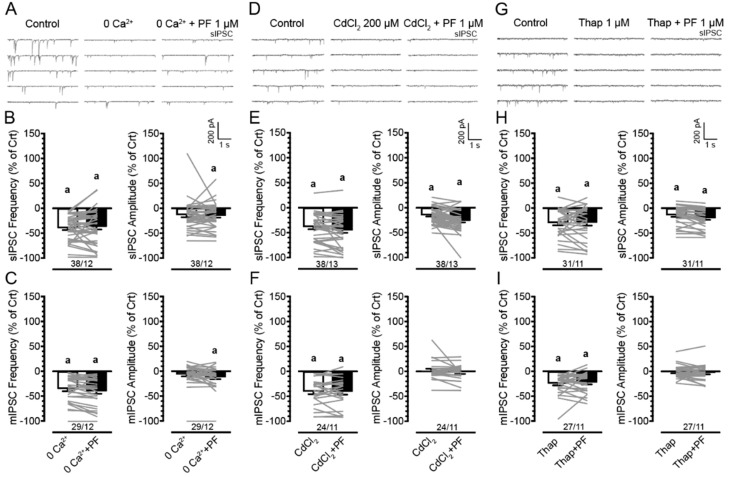
- DOI: 10.3390/cells11050857
Inhibitory Neurotransmission Is Sex-Dependently Affected by Tat Expression in Transgenic Mice and Suppressed by the Fatty Acid Amide Hydrolase Enzyme Inhibitor PF3845 via Cannabinoid Type-1 Receptor Mechanisms
Abstract
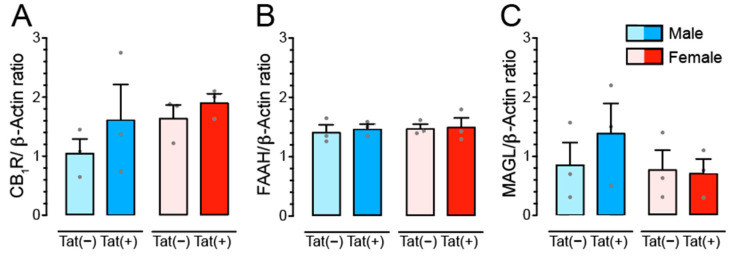
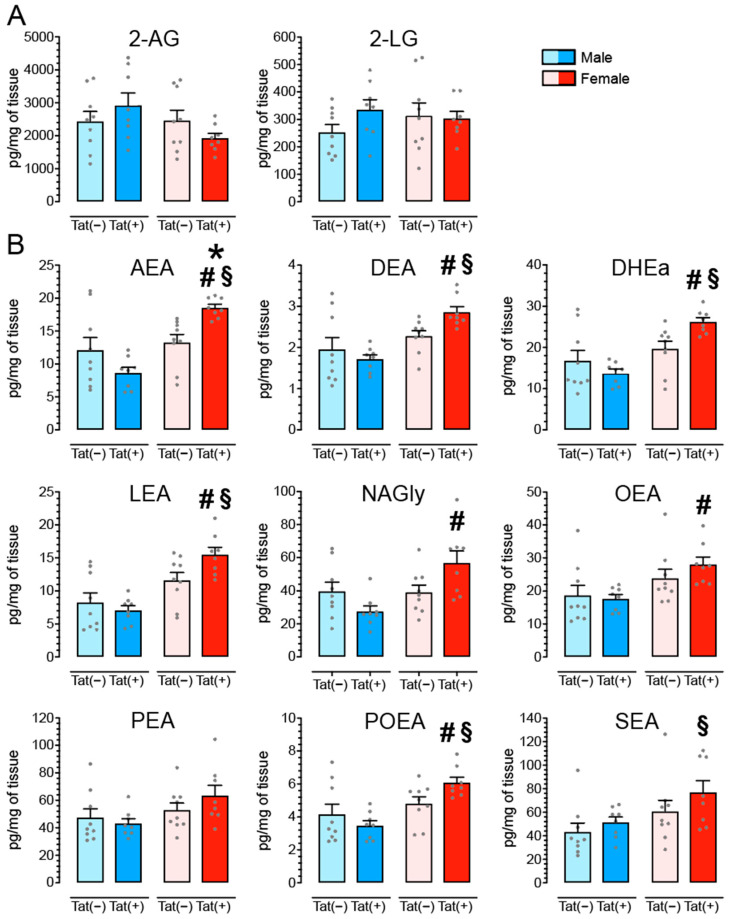
(1) Background. The endocannabinoid (eCB) system, which regulates physiological and cognitive processes, presents a promising therapeutic target for treating HIV-associated neurocognitive disorders (HAND). Here we examine whether upregulating eCB tone has potential protective effects against HIV-1 Tat (a key HIV transactivator of transcription) protein-induced alterations in synaptic activity. (2) Methods. Whole-cell patch-clamp recordings were performed to assess inhibitory GABAergic neurotransmission in prefrontal cortex slices of Tat transgenic male and female mice, in the presence and absence of the fatty acid amide hydrolase (FAAH) enzyme inhibitor PF3845. Western blot and mass spectrometry analyses assessed alterations of cannabinoid receptor and enzyme protein expression as well as endogenous ligands, respectively, to determine the impact of Tat exposure on the eCB system. (3) Results. GABAergic activity was significantly altered upon Tat exposure based on sex, whereas the effectiveness of PF3845 to suppress GABAergic activity in Tat transgenic mice was not altered by Tat or sex and involved CB1R-related mechanisms that depended on calcium signaling. Additionally, our data indicated sex-dependent changes for AEA and related non-eCB lipids based on Tat induction. (4) Conclusion. Results highlight sex- and/or Tat-dependent alterations of GABAergic activity and eCB signaling in the prefrontal cortex of Tat transgenic mice and further increase our understanding about the role of FAAH inhibition in neuroHIV.
Keywords: PF3845; Tat transgenic mice; anandamide; cannabinoid type 1 receptor; endocannabinoid enzyme inhibitor; endocannabinoids; fatty acid amide hydrolase; inhibitory postsynaptic potentials; neuroHIV; non-eCB lipids.
Conflict of interest statement
The authors declare no conflict of interest.
Figures
Similar articles
-
Neuroprotective effects of fatty acid amide hydrolase catabolic enzyme inhibition in a HIV-1 Tat model of neuroAIDS.Neuropharmacology. 2018 Oct;141:55-65. doi: 10.1016/j.neuropharm.2018.08.013. Epub 2018 Aug 13. Neuropharmacology. 2018. PMID: 30114402 Free PMC article.
-
GPR18 drives FAAH inhibition-induced neuroprotection against HIV-1 Tat-induced neurodegeneration.Exp Neurol. 2021 Jul;341:113699. doi: 10.1016/j.expneurol.2021.113699. Epub 2021 Mar 15. Exp Neurol. 2021. PMID: 33736974 Free PMC article.
-
Cannabinoids Occlude the HIV-1 Tat-Induced Decrease in GABAergic Neurotransmission in Prefrontal Cortex Slices.J Neuroimmune Pharmacol. 2016 Jun;11(2):316-31. doi: 10.1007/s11481-016-9664-y. Epub 2016 Mar 18. J Neuroimmune Pharmacol. 2016. PMID: 26993829 Free PMC article.
-
Druggable targets of the endocannabinoid system: Implications for the treatment of HIV-associated neurocognitive disorder.Brain Res. 2019 Dec 1;1724:146467. doi: 10.1016/j.brainres.2019.146467. Epub 2019 Sep 17. Brain Res. 2019. PMID: 31539547 Free PMC article. Review.
-
The Synaptic Interactions of Alcohol and the Endogenous Cannabinoid System.Alcohol Res. 2022 Jan 27;42(1):03. doi: 10.35946/arcr.v42.1.03. eCollection 2022. Alcohol Res. 2022. PMID: 35223337 Free PMC article. Review.
Cited by
-
Effects of acute Δ9-tetrahydrocannabinol on behavior and the endocannabinoid system in HIV-1 Tat transgenic female and male mice.Brain Res. 2024 Jan 1;1822:148638. doi: 10.1016/j.brainres.2023.148638. Epub 2023 Oct 17. Brain Res. 2024. PMID: 37858856 Free PMC article.
-
Combination treatment with FAAH inhibitors/URB597 and ferroptosis inducers significantly decreases the growth and metastasis of renal cell carcinoma cells via the PI3K-AKT signaling pathway.Cell Death Dis. 2023 Apr 6;14(4):247. doi: 10.1038/s41419-023-05779-z. Cell Death Dis. 2023. PMID: 37024452 Free PMC article.
-
The Impact of Cannabis Use on Cognition in People with HIV: Evidence of Function-Dependent Effects and Mechanisms from Clinical and Preclinical Studies.Curr HIV/AIDS Rep. 2024 Jun;21(3):87-115. doi: 10.1007/s11904-024-00698-w. Epub 2024 Apr 11. Curr HIV/AIDS Rep. 2024. PMID: 38602558 Free PMC article.
-
A helping HAND: therapeutic potential of MAGL inhibition against HIV-1-associated neuroinflammation.Front Immunol. 2024 May 21;15:1374301. doi: 10.3389/fimmu.2024.1374301. eCollection 2024. Front Immunol. 2024. PMID: 38835765 Free PMC article.
-
Cannabinoid receptor 1 positive allosteric modulator ZCZ011 shows differential effects on behavior and the endocannabinoid system in HIV-1 Tat transgenic female and male mice.PLoS One. 2024 Jun 24;19(6):e0305868. doi: 10.1371/journal.pone.0305868. eCollection 2024. PLoS One. 2024. PMID: 38913661 Free PMC article.
References
-
- May M.T., Sterne J.A., Costagliola D., Sabin C.A., Phillips A.N., Justice A.C., Dabis F., Gill J., Lundgren J., Hogg R.S., et al. HIV treatment response and prognosis in Europe and North America in the first decade of highly active antiretroviral therapy: A collaborative analysis. Lancet. 2006;368:451–458. - PubMed
-
- Marcus J.L., Chao C.R., Leyden W.A., Xu L., Quesenberry C.P., Jr., Klein D.B., Towner W.J., Horberg M.A., Silverberg M.J. Narrowing the Gap in Life Expectancy Between HIV-Infected and HIV-Uninfected Individuals With Access to Care. J. Acquir. Immune Defic. Syndr. 2016;73:39–46. doi: 10.1097/QAI.0000000000001014. - DOI - PMC - PubMed
Publication types
MeSH terms
Substances
Grants and funding
LinkOut - more resources
Full Text Sources
Medical
Molecular Biology Databases
