. 2022 Mar 2;11(5):859.
doi: 10.3390/cells11050859.

Vesicular MicroRNA as Potential Biomarkers of Viral Rebound

Affiliations

Vesicular MicroRNA as Potential Biomarkers of Viral Rebound

Wilfried Wenceslas Bazié et al. Cells. .

Abstract

Changes in the cellular microRNA (miRNA) expression profile in response to HIV infection, replication or latency have been reported. Nevertheless, little is known concerning the abundance of miRNA in extracellular vesicles (EVs). In the search for a reliable predictor of viral rebound, we quantified the amount of miR-29a, miR-146a, and miR-155 in two types of plasma extracellular vesicles. Venous blood was collected from 235 ART-treated and ART-naive persons living with HIV (85 with ongoing viral replication, ≥20 copies/mL) and 60 HIV-negative participants at five HIV testing or treatment centers in Burkina Faso. Large and small plasma EVs were purified and counted, and mature miRNA miR-29a, miR-146a, and miR-155 were measured by RT-qPCR. Diagnostic performance of miRNA levels in large and small EVs was evaluated by a receiver operating characteristic curve analysis. The median duration of HIV infection was 36 months (IQR 14-117). The median duration of ART was 34 months (IQR 13-85). The virus was undetectable in 63.8% of these persons. In the others, viral load ranged from 108 to 33,978 copies/mL (median = 30,032). Large EVs were more abundant in viremic participants than aviremic. All three miRNAs were significantly more abundant in small EVs in persons with detectable HIV RNA, and their expression levels in copies per vesicle were a more reliable indicator of viral replication in ART-treated patients with low viremia (20-1000 copies/mL). HIV replication increased the production of large EVs more than small EVs. Combined with viral load measurement, quantifying EV-associated miRNA abundance relative to the number of vesicles provides a more reliable marker of the viral status. The expression level as copies per small vesicle could predict the viral rebound in ART-treated patients with undetectable viral loads.

Keywords: HIV-1; biomarker; extracellular vesicles; miR-146a; miR-155; miR-29a; microRNA; viral replication.


Conflict of interest statement

The authors declare no conflict of interest.

Figures

Figure 1
Figure 1
Flow chart of study participant categorization (A). Counts of purified large (B) and small (C) plasma EVs by flow cytometry using DID and CFSE staining. Study participants were HIV-negative, HIV-positive on antiretroviral therapy (ART) for more than six months, or HIV-positive and ART-naïve, with an undetectable or detectable viral load (VL). An ordinary one-way ANOVA corrected for multiple comparisons using the Tukey test was used to compare groups.
Figure 2
Figure 2
Mature miR-29a content expressed as copies per µg of total RNA in large (A) and small (B) plasma EVs and expressed as copies per large vesicle (C) and copies per small vesicle (D). See the flow chart in Figure 1 for study participant group descriptions. Values are log10-transformed. An ordinary one-way ANOVA was used with the Tukey test for between-group multiple comparisons.
Figure 3
Figure 3
Mature miR-146a content expressed as copies per µg of total RNA in large (A) and small (B) plasma EVs and expressed as copies per large vesicle (C) and copies per small vesicle (D). See the flow chart in Figure 1 for study participant group descriptions. Values are log10-transformed. An ordinary one-way ANOVA was used with the Tukey test for between-group multiple comparisons.
Figure 4
Figure 4
Mature miR-155 content expressed as copies per µg of total RNA in large (A) and small (B) plasma EVs and expressed as copies per large vesicle (C) and copies per small vesicle (D). See the flow chart in Figure 1 for the study participant group descriptions. Values are log10-transformed. An ordinary one-way ANOVA was used with the Tukey test for between-group multiple comparisons.
Figure 5
Figure 5
Correlation matrix between the different variables of ART-naive (A) or ART-treated (B) study participants with viremia. The sizes and colors of the circles indicate the strength of the correlation, and the colored boxes indicate significant correlation at the threshold of 0.05. A two-tailed Pearson correlational test was computed between variables.
Figure 6
Figure 6
Principal component analysis of the microRNA content of large and small EVs in individuals in the five groups ((1) HIV-negative, (2) HIV+ ART-treated nonviremic, (3) HIV+ ART–naïve nonviremic, (4) HIV+ ART-treated viremic, and (5) HIV+ ART–naïve viremic). The miRNAs miR-29a (A), miR-146a (C), and miR-155 (E) contents expressed as copies per µg of RNA and expressed as copies per vesicle for miR-29a (B), miR-146a (D), and miR-155 (F). Ellipses are drawn around the centroids of the clusters, representing 95% confidence intervals.
Figure 7
Figure 7
Small EV miRNA content diagnosis performances in the receiver operating characteristics curves analysis. MiRNA per small EVs was used to generate a receiver operator characteristic (ROC) curve analysis to discriminate viremic participants in different populations. The nonviremic patients ART-treated for more than six months and having a CD8 T cell count < 500 cells/µL, CD4 T cell count ≥ 500 cells/µL, and CD4/CD8 ≥ 1 (reference patient) as the controls. The diagnosis performance of miRNA expressed as copies per small vesicle for the discrimination of participants with detectable viral loads in all viremic participants were presented for miR-29a (A), miR-146a (F), and miR-155 (K). The diagnosis performance of miRNA expressed as copies per small vesicle for the discrimination of participants with detectable viral loads in female sex worker group participants were presented for miR-29a (B), miR-146a (G), and miR-155 (L). The diagnosis performance of miRNA expressed as copies per small vesicle for the discrimination of participants with detectable viral loads in men who have sex with men were presented for miR-29a (C), miR-146a (H), and miR-155 (M). The diagnosis performance of miRNA expressed as copies per small vesicle for the discrimination of participants with detectable viral loads in female from general population group were presented for miR-29a (D), miR-146a (I), and miR-155 (N). The diagnosis performance of miRNA expressed as copies per small vesicle for the discrimination of participants with detectable viral loads in men from general population group were presented for miR-29a (E), miR-146a (J), and miR-155 (O). Wilson/Brown method was used to compute the area under a ROC curve.
Figure 8
Figure 8
Large EV miR-155 content diagnosis performance in the receiver operating characteristics curves analysis. MiR-155 per large EVs was used to generate a receiver operator characteristic (ROC) curve analysis to discriminate viremic participants in different populations. The nonviremic patients ART-treated for more than six months and having a CD8 T cell count < 500 cells/µL, CD4 T cell count ≥ 500 cells/µL, and CD4/CD8 ≥ 1 (reference patient) undetectable viral load under ART were used as controls. Wilson/Brown method was used to compute the area under a ROC curve. The diagnosis performance of miR-155 copies per µg of total RNA in large for the discrimination of participants with detectable viral were presented for all participants (A), female sex workers (B), men who have sex with men (C), female from general population (D), and men from general population (E). Wilson/Brown method was used to compute the area under a ROC curve.
Figure 9
Figure 9
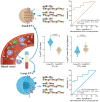
Graphical abstract show that microRNA into large or small EVs in plasma from PLWH may be helpful in the prediction of viral rebound as liquid biopsies for different populations.

References

    1. Pierson T., McArthur J., Siliciano R.F. Reservoirs for HIV-1: Mechanisms for viral persistence in the presence of antiviral immune responses and antiretroviral therapy. Annu. Rev. Immunol. 2000;18:665–708. doi: 10.1146/annurev.immunol.18.1.665. - DOI - PubMed
    1. Aamer H.A., McClure J., Ko D., Maenza J., Collier A.C., Coombs R.W., Mullins J.I., Frenkel L.M. Cells producing residual viremia during antiretroviral treatment appear to contribute to rebound viremia following interruption of treatment. PLoS Pathog. 2020;16:e1008791. doi: 10.1371/journal.ppat.1008791. - DOI - PMC - PubMed
    1. Dinoso J.B., Kim S.Y., Wiegand A.M., Palmer S.E., Gange S.J., Cranmer L., O’Shea A., Callender M., Spivak A., Brennan T., et al. Treatment intensification does not reduce residual HIV-1 viremia in patients on highly active antiretroviral therapy. Proc. Natl. Acad. Sci. USA. 2009;106:9403–9408. doi: 10.1073/pnas.0903107106. - DOI - PMC - PubMed
    1. Vandenhende M.A., Perrier A., Bonnet F., Lazaro E., Cazanave C., Reigadas S., Chêne G., Morlat P. Risk of virological failure in HIV-1-infected patients experiencing low-level viraemia under active antiretroviral therapy (ANRS C03 cohort study) Antivir. Ther. 2015;20:655–660. doi: 10.3851/IMP2949. - DOI - PubMed
    1. Craw J.A., Beer L., Tie Y., Jaenicke T., Shouse R.L., Prejean J. Viral Rebound Among Persons With Diagnosed HIV Who Achieved Viral Suppression, United States. J. Acquir. Immune Defic. Syndr. 2020;84:133–140. doi: 10.1097/QAI.0000000000002321. - DOI - PMC - PubMed

Publication types