. 2022 Mar 6;11(5):908.
doi: 10.3390/cells11050908.

Direct Interaction of Mitochondrial Cytochrome c Oxidase with Thyroid Hormones: Evidence for Two Binding Sites

Affiliations

Direct Interaction of Mitochondrial Cytochrome c Oxidase with Thyroid Hormones: Evidence for Two Binding Sites

Ilya P Oleynikov et al. Cells. .

Abstract

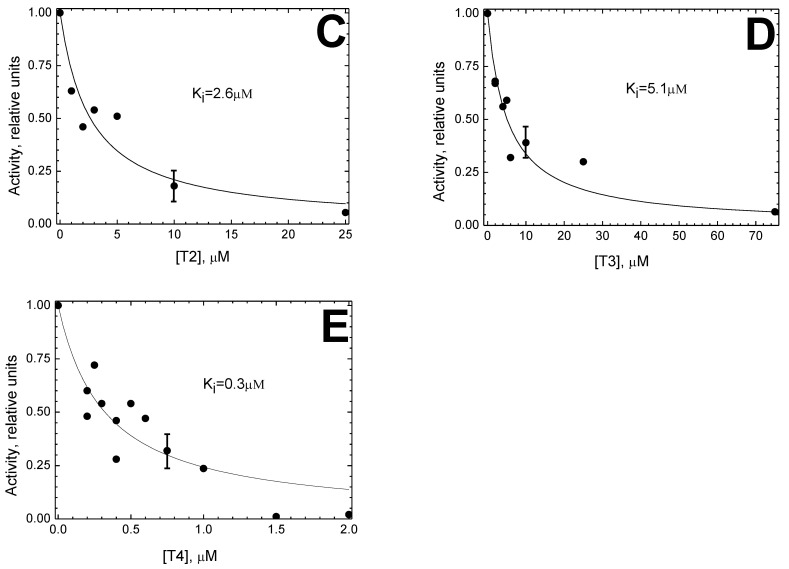
Thyroid hormones regulate tissue metabolism to establish an energy balance in the cell, in particular, by affecting oxidative phosphorylation. Their long-term impact is mainly associated with changes in gene expression, while the short-term effects may differ in their mechanisms. Our work was devoted to studying the short-term effects of hormones T2, T3 and T4 on mitochondrial cytochrome c oxidase (CcO) mediated by direct contact with the enzyme. The data obtained indicate the existence of two separate sites of CcO interaction with thyroid hormones, differing in their location, affinity and specificity to hormone binding. First, we show that T3 and T4 but not T2 inhibit the oxidase activity of CcO in solution and on membrane preparations with Ki ≈ 100-200 μM. In solution, T3 and T4 compete in a 1:1 ratio with the detergent dodecyl-maltoside to bind to the enzyme. The peroxidase and catalase partial activities of CcO are not sensitive to hormones, but electron transfer from heme a to the oxidized binuclear center is affected. We believe that T3 and T4 could be ligands of the bile acid-binding site found in the 3D structure of CcO by Ferguson-Miller's group, and hormone-induced inhibition is associated with dysfunction of the K-proton channel. A possible role of this interaction in the physiological regulation of the enzyme is discussed. Second, we find that T2, T3, and T4 inhibit superoxide generation by oxidized CcO in the presence of excess H2O2. Inhibition is characterized by Ki values of 0.3-5 μM and apparently affects the formation of O2●- at the protein surface. The second binding site for thyroid hormones presumably coincides with the point of tight T2 binding on the Va subunit described in the literature.

Keywords: bile acid-binding site; cytochrome oxidase; regulation; steroid hormones; superoxide generation; thyroid hormones.


Conflict of interest statement

The authors declare no conflict of interest. The funders had no role in the design of the study; in the collection, analyses, or interpretation of data; in the writing of the manuscript or in the decision to publish the results.

Figures

Figure 1
Figure 1
Inhibition of the solubilized cytochrome c oxidase (CcO) activity by thyroid hormones. (A) Inhibition of oxygen consumption. Additions of CcO (20 nM), cytochrome c and T4 (0.25 mM) are shown by the arrows. The kinetics trace is corrected for ascorbate autooxidation. To highlight the inhibitory effect, the trace in the absence of T4 is shown by the dotted line. (B) Titration of CcO activity by T3 at 0.02% dodecyl-maltoside (DM). Other conditions are mainly as in panel (A). Experimental data (circles) are approximated by function (1), see Section 2. The activity (the ratio of the reaction rate after the onset of inhibition to the initial reaction rate) is given in relative units. To streamline the figure, a typical measurement error is shown for only one of the experimental points (hereinafter, in similar cases). (C) Dependence of an apparent Ki for T3 on the DM concentration. The Ki(app) values are determined from the approximation of the experimental data by function (1), see panel (B). The segment being cut off on the Y-axis indicates the true inhibition constant Ki for T3 in the absence of DM; the segment being cut off on the X-axis in its negative area indicates the value of the dissociation constant for DM in the absence of T3, Kc (both segments are pointed out by arrows). (D) Titration of CcO activity by T4 at 0.05% DM. See panel (B) for further details. (E) Dependence of an apparent Ki for T4 on the DM concentration. The Ki(app) values are determined as described above, see panel (C). (F) Titration of CcO activity by T2 at 0.05% (filled signs) and 1% (open signs) DM. Other conditions are mainly as in panel (A). The entire dataset is approximated by function (1).
Figure 1
Figure 1
Inhibition of the solubilized cytochrome c oxidase (CcO) activity by thyroid hormones. (A) Inhibition of oxygen consumption. Additions of CcO (20 nM), cytochrome c and T4 (0.25 mM) are shown by the arrows. The kinetics trace is corrected for ascorbate autooxidation. To highlight the inhibitory effect, the trace in the absence of T4 is shown by the dotted line. (B) Titration of CcO activity by T3 at 0.02% dodecyl-maltoside (DM). Other conditions are mainly as in panel (A). Experimental data (circles) are approximated by function (1), see Section 2. The activity (the ratio of the reaction rate after the onset of inhibition to the initial reaction rate) is given in relative units. To streamline the figure, a typical measurement error is shown for only one of the experimental points (hereinafter, in similar cases). (C) Dependence of an apparent Ki for T3 on the DM concentration. The Ki(app) values are determined from the approximation of the experimental data by function (1), see panel (B). The segment being cut off on the Y-axis indicates the true inhibition constant Ki for T3 in the absence of DM; the segment being cut off on the X-axis in its negative area indicates the value of the dissociation constant for DM in the absence of T3, Kc (both segments are pointed out by arrows). (D) Titration of CcO activity by T4 at 0.05% DM. See panel (B) for further details. (E) Dependence of an apparent Ki for T4 on the DM concentration. The Ki(app) values are determined as described above, see panel (C). (F) Titration of CcO activity by T2 at 0.05% (filled signs) and 1% (open signs) DM. Other conditions are mainly as in panel (A). The entire dataset is approximated by function (1).
Figure 2
Figure 2
Inhibitory effect of thyroid hormones on the oxidase activity of the membrane-incorporated CcO. (AC) Titration of the oxidase activity of CcO in proteoliposomes by T3 (A), T4 (B) and T2 (C). Proteoliposomes were added to the experimental medium up to 26 nM CcO. The oxidase reaction was initiated by addition of the respiratory substrate. Other details are as in Figure 1B,D. (D) T3-induced inhibition of ferrocytochrome c oxidation by CcO in proteoliposomes. The activity was measured in the absence (control curve 1, black) or in the presence (curve 2, red) of 0.5 mM T3 in the medium. Other conditions are as in panel (A) except that proteoliposomes were added to the medium up to 3.25 nM CcO and pre-incubated for 30 min before adding the respiratory substrate. (E) Inhibitory effect of T3 on CcO oxidase activity in rat liver mitochondria. Mitochondria were suspended in the experimental medium up to 0.8 mg of protein/mL. Other details are as in Figure 1B,D. (F) Inhibitory effect of T4 on CcO oxidase activity in SMP obtained from bovine heart mitochondria. The conditions were essentially as in panel (E) except that the CcO concentration was 20 nM.
Figure 3
Figure 3
Hormones T3 and T4 decelerate electron transfer from heme a to heme a3. (A) Effect of T3 and T4 on the steady-state level of heme a reduction. CcO (ca. 1 μM) in the basic medium pH 8.0 supplied with 5 μM RuAm, and where indicated, T3 or T4 was placed in a closed cuvette and reduced by addition of 5 mM ascorbate (indicated by the arrow). The reduction level of heme a was followed in the absence (control trace 1, black) or presence of 1 mM T3 (trace 2, red), 2 mM T3 (trace 3, blue) or 1 mM T4 (trace 4, green). (B) Effect of T4 on the kinetics of the reduction of hemes a and a3 on the onset of anaerobiosis. The total reduction level of hemes a and a3 was registered. Trace 1, black = control and trace 2, red = reduction of the sample in the presence of 0.5 mM T4. The other conditions were as in panel (A) except that 0.1 mM TMPD was used instead of RuAm.
Figure 4
Figure 4
Peroxidase reaction catalyzed by CcO is not affected by thyroid hormones. Peroxidation of ferrocyanide (0.2 mM) was monitored in the presence of 0.6 μM CcO. The reaction was triggered by addition of 4 mM H2O2 (shown by the arrow). Trace 1, black = control; trace 2, red = the experiment in the presence of 1 mM T4; trace 3, blue = 1 mM T4 added in the course of the experiment, as indicated. The initial jump on H2O2 addition reflects spectral response in the γ-band of heme a3 on oxoferryl intermediates’ formation.
Figure 5
Figure 5
Thyroid hormones do not inhibit catalase activity of CcO. Pre-addition of 12 mM H2O2 to the experimental medium did not induce detectable oxygen release. Additions of 1.5 μM CcO are indicated by the vertical arrows. Trace 1, black = control; traces 24 = thyroid hormones (T3 = 2, green; T2 = 3, red; T4 = 4, blue). T2 was pre-added up to 0.5 mM; T3 and T4 were added up to 0.5 mM and 1 mM, respectively, as marked.
Figure 6
Figure 6
Effect of T4 on the formation of CcO oxoferryl intermediates during the reaction with H2O2. The reaction was followed using a diode array spectrophotometer. Final concentrations after mixing: 3.25 μM CcO, 1 mM H2O2, 0.5 mM T4. (A, B) Kinetics of the oxoferryl intermediates’ formation. Spectral forms FI-607 (trace 1, black) and FII-580 (trace 2, red) are followed by the absorption differences at 606–700 nm and 571–501 nm, respectively. (A) Control; (B) CcO was pre-incubated with 0.5 mM T4 until mixing. (C) Difference spectra (15 s vs. 0.2 s after mixing) obtained in the absence (control spectrum 1, black) and presence (spectrum 2, red) of 0.5 mM T4.
Figure 6
Figure 6
Effect of T4 on the formation of CcO oxoferryl intermediates during the reaction with H2O2. The reaction was followed using a diode array spectrophotometer. Final concentrations after mixing: 3.25 μM CcO, 1 mM H2O2, 0.5 mM T4. (A, B) Kinetics of the oxoferryl intermediates’ formation. Spectral forms FI-607 (trace 1, black) and FII-580 (trace 2, red) are followed by the absorption differences at 606–700 nm and 571–501 nm, respectively. (A) Control; (B) CcO was pre-incubated with 0.5 mM T4 until mixing. (C) Difference spectra (15 s vs. 0.2 s after mixing) obtained in the absence (control spectrum 1, black) and presence (spectrum 2, red) of 0.5 mM T4.
Figure 7
Figure 7
Thyroid hormones strongly inhibit superoxide generation by CcO in the presence of excess H2O2. (A) Typical kinetics of superoxide production catalyzed by mitochondrial CcO (trace 1, black) as compared to bacterial aa3-type oxidase from R. sphaeroides (trace 2, red). Addition of 0.4 µM T4 is indicated. CcO was added up to 0.5 μM to the experimental medium, supplemented with 0.1 mM WST-1. The reaction was initiated by addition of 4 mM H2O2 (indicated by the arrow). (B) T4 has no superoxide dismutase activity. Superoxide formation accompanying the oxidation of hypoxanthine (50 μM) by xanthine oxidase (XOx, 0.015 units/mL) was followed as in panel (A). Additions of 500 μM T4 and superoxide dismutase (SOD, 20 μg/mL) are shown by the arrows. (CE) Concentration dependence of the inhibitory effect of thyroid hormones T2 (C), T3 (D) and T4 (E), respectively, on superoxide production by mitochondrial CcO. Conditions of the measurements are as in panel (A). Experimental data are approximated by function (1) with different values of the Ki parameter (indicated).
Figure 7
Figure 7
Thyroid hormones strongly inhibit superoxide generation by CcO in the presence of excess H2O2. (A) Typical kinetics of superoxide production catalyzed by mitochondrial CcO (trace 1, black) as compared to bacterial aa3-type oxidase from R. sphaeroides (trace 2, red). Addition of 0.4 µM T4 is indicated. CcO was added up to 0.5 μM to the experimental medium, supplemented with 0.1 mM WST-1. The reaction was initiated by addition of 4 mM H2O2 (indicated by the arrow). (B) T4 has no superoxide dismutase activity. Superoxide formation accompanying the oxidation of hypoxanthine (50 μM) by xanthine oxidase (XOx, 0.015 units/mL) was followed as in panel (A). Additions of 500 μM T4 and superoxide dismutase (SOD, 20 μg/mL) are shown by the arrows. (CE) Concentration dependence of the inhibitory effect of thyroid hormones T2 (C), T3 (D) and T4 (E), respectively, on superoxide production by mitochondrial CcO. Conditions of the measurements are as in panel (A). Experimental data are approximated by function (1) with different values of the Ki parameter (indicated).
Figure 8
Figure 8
Proposed interaction of estradiol (A) and triiodo-thyronine (B) molecules with CcO in BABS. The structure of the dimeric enzyme in the region of BABS is shown. Side view: the inner (matrix) surface of the membrane is at the bottom. The ligand molecule is docked in a hydrophobic cavity near the entrance to the proton channel K. Subunits I (green) and II (cyan) are shown, as well as subunits III (brown) and VIa (wheat) from the neighboring monomer (marked with an asterisk). The indicated residue E62 from subunit II is located just on the border of the matrix and the entrance to the K-channel.

Similar articles

Cited by

References

    1. Rich P.R. Mitochondrial cytochrome c oxidase: Catalysis, coupling and controversies. Biochem. Soc. Trans. 2017;45:813–829. doi: 10.1042/BST20160139. - DOI - PubMed
    1. Wikström M., Sharma V. Proton pumping by cytochrome c oxidase—A 40 year anniversary. Biochim. Biophys. Acta (Bioenergetics) 2018;1859:692–698. doi: 10.1016/j.bbabio.2018.03.009. - DOI - PubMed
    1. Kadenbach B., Hüttemann M. The subunit composition and function of mammalian cytochrome c oxidase. Mitochondrion. 2015;24:64–76. doi: 10.1016/j.mito.2015.07.002. - DOI - PubMed
    1. Pierron D., Wildman D.E., Hüttemann M., Markondapatnaikuni G.C., Aras S., Grossman L.I. Cytochrome c oxidase: Evolution of control via nuclear subunit addition. Biochim. Biophys. Acta. 2011;1817:590–597. doi: 10.1016/j.bbabio.2011.07.007. - DOI - PMC - PubMed
    1. Konstantinov A.A. Cytochrome c oxidase as a proton-pumping peroxidase: Reaction cycle and electrogenic mechanism. J. Bioenerg. Biomembr. 1998;30:121–130. doi: 10.1023/A:1020571930850. - DOI - PubMed

Publication types

MeSH terms

LinkOut - more resources