. 2022 Feb 22;23(5):2415.
doi: 10.3390/ijms23052415.

Dynamics of Endothelial Engagement and Filopodia Formation in Complex 3D Microscaffolds

Affiliations

Dynamics of Endothelial Engagement and Filopodia Formation in Complex 3D Microscaffolds

Pierre Ucla et al. Int J Mol Sci. .

Abstract

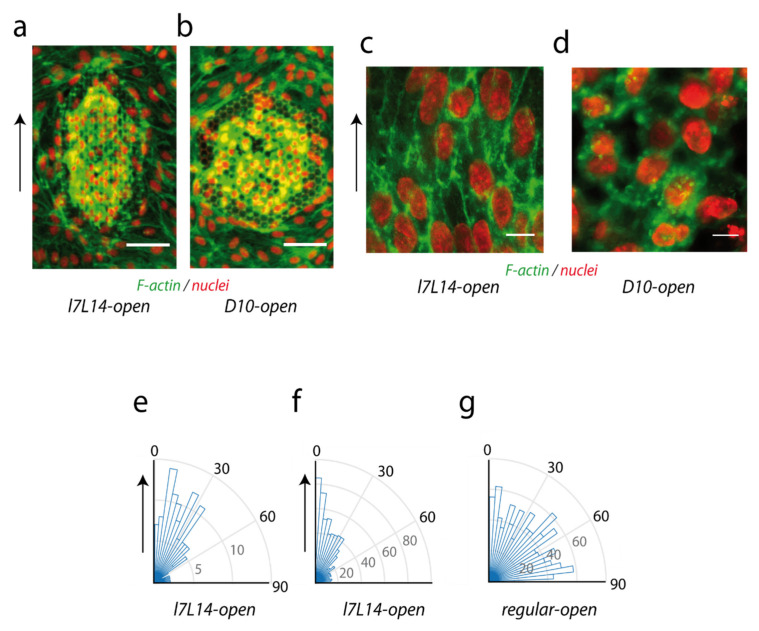
The understanding of endothelium-extracellular matrix interactions during the initiation of new blood vessels is of great medical importance; however, the mechanobiological principles governing endothelial protrusive behaviours in 3D microtopographies remain imperfectly understood. In blood capillaries submitted to angiogenic factors (such as vascular endothelial growth factor, VEGF), endothelial cells can transiently transdifferentiate in filopodia-rich cells, named tip cells, from which angiogenesis processes are locally initiated. This protrusive state based on filopodia dynamics contrasts with the lamellipodia-based endothelial cell migration on 2D substrates. Using two-photon polymerization, we generated 3D microstructures triggering endothelial phenotypes evocative of tip cell behaviour. Hexagonal lattices on pillars ("open"), but not "closed" hexagonal lattices, induced engagement from the endothelial monolayer with the generation of numerous filopodia. The development of image analysis tools for filopodia tracking allowed to probe the influence of the microtopography (pore size, regular vs. elongated structures, role of the pillars) on orientations, engagement and filopodia dynamics, and to identify MLCK (myosin light-chain kinase) as a key player for filopodia-based protrusive mode. Importantly, these events occurred independently of VEGF treatment, suggesting that the observed phenotype was induced through microtopography. These microstructures are proposed as a model research tool for understanding endothelial cell behaviour in 3D fibrillary networks.

Keywords: angiogenesis; contractility; endothelial cells; filopodia; mechanotransduction; microtopography; two-photon polymerization.


Conflict of interest statement

The authors declare no conflict of interest. The funders had no role in the design of the study; in the collection, analyses, or interpretation of data; in the writing of the manuscript, or in the decision to publish the results.

Figures

Figure 1
Figure 1
Microfabrication of microstructures. Microstructures were realized with NOA61 (Norland Optical Adhesive) by two-photon polymerization. (a) Hexagonal lattices previously described [37] are referred to here as “closed” microstructures. (b,c) “Open” microstructures were realized by building hexagons on pillars, with a total height H of 7 µm (including the typical pillar height of 2–4 µm), and variable horizontal dimensions. Regular (b) and elongated (c) hexagons were used. (d) Scheme of dimensions measured for regular (D) and elongated (l, L) hexagons. (eg) SEM imaging of D8-closed (e) and l7L14-open (f,g) structures. (e) Top view, (f,g) side views, bars 10 µm.
Figure A1
Figure A1
Additional data for nuclei quantification. (a) Example of nuclei segmentation on top of a l7L14 microstructure. (bh) Histograms of nuclei orientations in different geometries, in the top layer above the microstructures: (b) l7L14-closed with 5 ng/mL VEGF (68 nuclei in 3 structures), (c) l7L14-open without VEGF (1 structure), (d) D13.5-open structures (607 nuclei in 6 structures), (e) D10-open structures (95 nuclei in 1 structure), (f) D8.8-open structures (178 nuclei in 4 structures), (g) D6.6-open structures (94 nuclei in 5 structures), (h) D4.5-open structures (77 nuclei in 7 structures). (i,j) Vertical engagements: position of the bottom of the nuclei for: (i) l7L14-closed with 5 ng/mL VEGF, (j) l7L14-open without VEGF.
Figure A2
Figure A2
Semi-automatic filopodia detection on fixed samples. Filopodia detection (red) for the right image (average z projection of the bottom planes).
Figure A3
Figure A3
Early colonization and membrane labelling. (a) Early cell colonization on a l7L14-closed structure, VEGF 5 ng/mL. z projection is shown, red: nuclei, green: F-actin, bar 50 µm. (b) Monolayer organization on top of a l7L14-closed structure: intercellular junctions labelled with VE-cadherin (blue). Nuclei in red. z projection of 3 planes above structure. Confocal image acquired from the top, bar 10 µm. (c) Membrane labelling with WGA-FITC on a l7L14-open microstructure (WGA, blue; nuclei, red; F-actin, green). Top, early colonization (VEGF 5 ng/mL). Bottom, colonization with dactylopodia-like structures, culture in media without VEGF, same image as in Figure 3d, left, with additional WGA labelling. Bar 10 µm. Cells fixed at time of structure colonization (2 (a,b), 3 (c bottom) or 5 (c top) days after cell seeding).
Figure A4
Figure A4
Histograms of filopodia orientations in elongated structures. (a) The angle with the reference axis of elongated structures was computed (top). Bottom, left: all filopodia, right: filopodia with lengths > 5 µm. (b) Remarkable angles in elongated microstructures (grey circles: pillars). Preferential orientations of short (≤5 µm, blue) and long (>5 µm, red) filopodia.
Figure A5
Figure A5
Filopodia characterization on regular microstructures. HUVECs were cultivated on regular open microstructures with different horizontal dimensions D: (a) D13.5-open, (b) D8.8-open, (c) D4.5-open, (d) D3.5-open. Bottom and top planes are represented. Red: nuclei and microstructure autofluorescence, green: F-actin. Cells were fixed at time of structure colonization (2 days after cell seeding). Denoised images, bar 10 µm. (e) Median filopodia lengths in D13.5-open + D8.8-open microstructures, one point corresponds to one structure (bar: average value). (f) Histogram of filopodia lengths in D13.5-open + D8.8-open microstructures. (g) Histograms of filopodia orientations in D13.5-open + D8.8-open structures. The angle with the reference axis of elongated structures was computed. Left: all filopodia, right: filopodia with lengths > 5 µm. (h) Remarkable angles.
Figure A6
Figure A6
Filopodia orientation on regular lattices of different dimensions. (a,b) Median filopodia lengths, one point corresponds to one structure (bar: mean value), for D13.5-open (a) and D8.8-open (b) structures. (c,d) Histogram of filopodia lengths, for D13.5-open (c) and D8.8-open (d) structures (respectively 782 and 256 filopodia). (el) Histograms of filopodia orientation. The angle with the reference axis of elongated structures was computed. (eg) D13.5-open structures, (e) all filopodia, (f) filopodia with length > 5 µm, (g) filopodia with lengths ≤ 5 µm. (hj) D8.8-open structures, (e) all filopodia, (f) filopodia with length > 5 µm, (g) filopodia with lengths ≤ 5 µm. (k) l7L14-open structures, filopodia with lengths ≤ 5 µm. (l) D13.5-open + D8.8-open structures, filopodia with lengths ≤ 5 µm.
Figure A7
Figure A7
Quantitative analysis of ML-7, Y-27632, PF-573228 and sunitinib effects on filopodia dynamics in the microstructures. (a) Cell morphology of HUVECs-Lifeact-GFP cells in and outside the l7L14-open microstructure 1 h 20 min after addition of 10 µM ML-7 (1 day after cell seeding) Yellow rectangle: cells formed membrane blebs in the structure. Outside the microstructure, cells displayed no noticeable morphological change. Scale bar, 10 µm. (be) Statistical analyses of the differences in normalized numbers and lifetime upon drug addition. Each point corresponds to the temporal mean in one movie. Three independent experiments (represented with orange, blue and green points) were carried out for each drug, and each experiment is represented by a different colour. Paired t-tests were performed to test for statistically significant differences between the values before drug addition (Ctr) and after addition of: 10 µM ML-7 (b), 10 µM Y-27632 (c), 10 µM PF-573228 (d) and 300 nM sunitinib (e). * indicates statistically significant differences before and after drug addition with p < 0.05, n.s. indicates non statistically significant differences. (fi) Kinetics of the mean elongation (blue) and retraction (orange) rates of the (+) filopodia extremities, for 10 µM ML-7 (f), 10 µM Y-27632 (g), 10 µM PF-573228 (h) and 300 nM sunitinib (i) treatments. Pre-treatment and post-treatment values are concatenated. Blue arrow, time of drug addition. n = 3 independent experiments, errors: S.D. The light blue vertical bar indicates a state of stabilization of the system after media change (~3 min long), which was not considered for analysis.
Figure A8
Figure A8
VEGF accessibility. (a,b) Phosphorylated VEGFR2 labelling, with or without VEGF stimulation. Cells were incubated 10 min without (a) or with (b) VEGF 50 ng/mL (see Materials and Methods for details), and were immediately fixed and labelled for phosphorylated VEGFR2. Bottom plane. Left, F-actin (green)/nuclei (red). Right, pVEGFR2 (blue)/nuclei (red). Cells were fixed 2 days after cell seeding. Denoised images, bar 10 µm.
Figure 2
Figure 2
Cellular organization in the top monolayer. (a,b) Global HUVECs coverage of (a) l7L14-open and (b) D10-open microstructures. VEGF 0.5 ng/mL. z projection is shown, red: nuclei, green: F-actin, bar 50 µm. (c,d) Detail of the top monolayer covering (c) l7L14-open, with the axis of elongation of hexagons represented by a black arrow (top, left), and (d) regular D10-open microstructures. Red: nuclei, green: F-actin, z projection of planes above structures, cells fixed at time of structure colonization (2 (b,d) or 3 (a,c) days after cell seeding). Scale bar 10 µm. (eg) Histograms of nuclei orientations in the top layer above the microstructures. Only the part of the nuclei above 4 µm height was considered. (e) l7L14-closed (127 nuclei in 7 structures) (f) l7L14-open (700 nuclei in 15 structures) (g) D4.5, D6.6, D8.8, D10, and D13.5-open microstructures (1051 nuclei in 23 structures). Vertical arrows in (a,c,e,f) represent the reference axis for elongated structures. For regular structures, the reference axis was chosen perpendicular to one size of the hexagon (not shown).
Figure 3
Figure 3
HUVECs organization on closed and open microstructures. Left, schemes of hexagonal lattices, and side or 3D views of typical HUVECs organization after colonization. Right, confocal planes, denoised images, scale bar 10 µm. Red: nuclei and microstructure autofluorescence, green: F-actin. Cells were cultivated in standard conditions (VEGF 0.5 ng/mL) unless otherwise specified. Cells were fixed at time of structure colonization (2 (b,d-middle, d-right), 3 (d-left) or 4 (a,c) days after cell seeding). (a) Closed microstructures. Confocal planes on HUVECs on l7L14-closed microstructure. Left, bottom plane (contact with the bottom substrate); middle, just below the structure (1.2 µm below the top of the structure); top, above the structure. (be) Typical examples of colonization of open l7L14-open structures, with vertical engagement and formation of filopodia in the bottom plane: (b) with limited cell area on the basal substrate), (c) with larger membrane and nuclei vertical engagement, (d) with formation of extended, dactylopodia-like protrusions, and (e) typical enrichment observed for F-actin around the micropillars, white arrows. (b,c) From left to right, bottom plane; middle plane (at the level of the closed part of the structure); top, above the structure. (d) Dactylopodia-like protrusions were observed without (d-left) or with (d-middle,right) VEGF in the media. Bottom planes are shown. For d-left, correspondent membrane labelling with bottom, middle and top views is shown in Figure A3c. (e) Two examples of bottom and top planes are shown.
Figure 4
Figure 4
Dependence of geometry and pore size for nuclei engagement. HUVECs were cultivated on elongated (a) l7L14-closed microstructures (127 nuclei in 7 structures) and (b) l7L14-open structures (700 nuclei in 15 structures), or on regular open structures with different horizontal dimensions D: (c) D13.5-open (607 nuclei in 6 structures), (d) D10-open (95 nuclei in 1 structure), (e) D8.8-open, (178 nuclei in 4 structures), (f) D6.5-open (94 nuclei in 5 structures), and (g) D4.5-open (77 nuclei in 7 structures). After the 3D segmentation of nuclei, the position of the bottom of the nuclei was determined, with a position of 0 µm corresponding to the contact with the bottom substrate (black horizontal line) and a position of 7 µm to the top of the microstructures (blue horizontal line). For D4.5-open microstructures (g), the highest position compared with the expected height of the structure likely reflects an optical deformation when imaging through a densely polymerized structure. (h) Recapitulative scheme showing nuclei engagement in the function of the pore size and on the closed or open nature of the microstructure.
Figure 5
Figure 5
Automated filopodia detection. Left, original image of Lifeact-GFP HUVECs cells in the microstructures. Middle, automatic detection of cell islets (red) and filopodia (green). Right, detection of (−) and (+) extremities for each individual filopodia, used for filopodia tracking. Bottom, zoom on the image part in the white rectangle on top. Scale bar 15 µm.
Figure 6
Figure 6
Quantification of filopodia organization. HUVECs were cultivated on l7L14 microstructures, and filopodia quantified. (a) Median filopodia lengths from analyses on fixed samples, one point corresponds to one structure (bar: average value). (b) Histogram of filopodia lengths from analyses on fixed samples. (cg) Mean values from analyses on timelapse images. Each point of the plot corresponds to the mean filopodia values on one movie (n = 15 independent movies were analysed, with a typical number of 10–100 filopodia detected at a given time point for each movie). Violin plots are shown, with dotted lines representing quartiles (middle line: median). (c) filopodia length, (d) number of filopodia normalized by the perimeter (in µm) of the cell islets inside the structure, (e) filopodia lifetime, (f,g) elongation (blue) and retraction (orange) rates of the (−) (f) and (+) (g) filopodia extremities.
Figure 7
Figure 7
Transition between different protrusive modes in the microstructures, and molecular mechanisms. (a,b) Spontaneous transitions between an amoeboid state and a mesenchymal state (a), and between a mesenchymal and an amoeboid state (b). (ce) Kinetics of the representative effects of (c) ML-7 (10 µM), (d) Y-27632 (10 µM), or (e) PF-573228 (10 µM) addition on Lifeact-GFP HUVECs cells (green, Lifeact-GFP), z projection of the bottom planes. (a,b) T0 refers to an arbitrary moment chosen as time origin, (ce) T0 refers to the time of drug addition. Movies were acquired 1 day after cell seeding. Scale bar 10 µm (ad), 15 µm (e).
Figure 8
Figure 8
Quantitative analysis of ML-7, Y-27632 and PF-573228 effect on filopodia dynamics. (ac) Evolution along time of (a) mean filopodia lengths, (b) normalized number of filopodia (normalization by the perimeter, in µm, of the cell islets inside the structure), and (c) mean lifetimes of filopodia present at this time, for ML-7 (left), Y-27632 (middle) and PF-573228 (right) treatments, n = 3 independent experiments per condition. Error: S.D. Pre-treatment and post-treatment graphs are concatenated. The blue arrow indicates the time of drug addition. The light blue vertical bar indicates a state of stabilization of the system after media change (~3 min long). The dotted lines for lifetime (c) refer to times where the lifetime cannot be precisely assessed, because of the imaging interruption during media changes (durations, ~1 mean filopodia lifetime before and after drug addition; see Materials and Methods). * in (b) ML7, and (c) PF-573228, indicates statistically significant differences before and after drug addition, with p < 0.05 (see Figure A7b–d).
Figure 9
Figure 9
Dependence on VEGF. (ah) HUVECs were cultivated on l7L14-open microstructures, and long-term cultures were performed in different VEGF concentrations. Cell organization was studied from fixed samples. (a,b) Culture without VEGF: (a) ECGM media (Promocell), which contains no VEGF supplement, (b) ECGM2 media without the VEGF supplement. (be) Standard ECGM2 media with (c) 0.5 ng/mL VEGF, (d) 5 ng/mL, (e) 20 ng/mL, and (f) 50 ng/mL. (af) Red, nuclei (and structure autofluorescence), green, F-actin. Bottom and top planes are represented. Cells fixed at time of structure colonization (2 (bf) or 3 (a) days after cell seeding). Denoised images, bar 10 µm. (g,h) Quantification for experiments realized in parallel in the different VEGF concentrations (2 days after cell seeding). The figure corresponds to an experiment where the five VEGF concentrations were analysed simultaneously, with two structures per condition. The generation of numerous filopodia for the conditions VEGF0 was observed in 3 additional independent microstructures (see raw data). (g) Histograms of filopodia lengths (black bar, mean value, red bar, median value). (h) Number of filopodia normalized by the perimeter on cell bodies in the bottom part of the structure. One point corresponds to one structure. (i,j) Effect of sunitinib (300 nM) treatment on HUVECs-Lifeact-GFP cells. Movies were acquired 1 day after cell seeding. (i) After sunitinib addition, cells still exhibited filopodia (left) and dactylopodia-like protrusions with filopodia (middle-left) (26 and 29 min after drug addition, respectively). Dynamic filopodia were still present after longer sunitinib treatments: 5 h (middle-right) or 18 h (right). Green, Lifeact-GFP, z projection of the bottom planes. Scale bars 10 µm (left, middle-right, right), 15 µm (middle-left). (j) Evolution along time of the mean filopodia length (left), of the number of filopodia normalized by the perimeter (in µm) of the cell islets inside the structure (middle), and of the mean lifetime of filopodia present at this time, upon sunitinib treatment, n = 3 experiments per condition, errors: S.D. (n = 3 independent experiments). Pre-treatment and post-treatment graphs are concatenated. The blue arrow indicates the time of drug addition. The light blue vertical bar indicates a state of stabilization of the system after media change (~3 min long). The dotted lines for lifetime (c) refer to times where the lifetime cannot be precisely assessed, because of the imaging interruption during media changes (durations, ~1 mean filopodia lifetime before and after drug addition; see Materials and Methods). No statistical difference was detected in filopodia dynamics upon sunitinib treatment (see Figure A7e).
Figure 10
Figure 10
Recapitulative scheme of the global cell behaviour in the microstructures. (Top) Organisation of endothelial HUVECs in function of the elongation of hexagons in the horizontal plane, and of the open or closed nature of the microstructure. These two characteristics modulate the orientation of the top monolayer, the vertical engagement and the induction of filopodia, and the orientation of the exploratory filopodia. The vertical cell polarization and the induction of filopodia are hallmarks of tip cell phenotype, but occur independently of VEGF. (Bottom) Zoom of the different protrusive modes present in the bottom plane (pillars) of open elongated structures, and transitions between them.

Similar articles

Cited by

References

    1. Bettinger C.J., Langer R., Borenstein J.T. Engineering Substrate Topography at the Micro- and Nanoscale to Control Cell Function. Angew. Chem. Int. Ed. 2009;48:5406–5415. doi: 10.1002/anie.200805179. - DOI - PMC - PubMed
    1. Karina Kulangaraa K.W.L. Substrate topography shapes cell function. Soft Matter. 2009;5:4072–4076. doi: 10.1039/b910132m. - DOI
    1. Flemming R., Murphy C., Abrams G., Goodman S., Nealey P. Effects of synthetic micro- and nano-structured surfaces on cell behavior. Biomaterials. 1999;20:573–588. doi: 10.1016/S0142-9612(98)00209-9. - DOI - PubMed
    1. Teixeira A., Abrams G.A., Bertics P.J., Murphy C.J., Nealey P.F. Epithelial contact guidance on well-defined micro- and nanostructured substrates. J. Cell Sci. 2003;116:1881–1892. doi: 10.1242/jcs.00383. - DOI - PMC - PubMed
    1. Chen S., Jones J.A., Xu Y., Low H.-Y., Anderson J.M., Leong K.W. Characterization of topographical effects on macrophage behavior in a foreign body response model. Biomaterials. 2010;31:3479–3491. doi: 10.1016/j.biomaterials.2010.01.074. - DOI - PMC - PubMed

MeSH terms

Substances

LinkOut - more resources