. 2022 Feb 25;23(5):2570.
doi: 10.3390/ijms23052570.

Combined Transcriptomic and Proteomic Profiling of E. coli under Microaerobic versus Aerobic Conditions: The Multifaceted Roles of Noncoding Small RNAs and Oxygen-Dependent Sensing in Global Gene Expression Control

Affiliations

Combined Transcriptomic and Proteomic Profiling of E. coli under Microaerobic versus Aerobic Conditions: The Multifaceted Roles of Noncoding Small RNAs and Oxygen-Dependent Sensing in Global Gene Expression Control

Gunn-Guang Liou et al. Int J Mol Sci. .

Abstract

Adaptive mechanisms that facilitate intestinal colonization by the human microbiota, including Escherichia coli, may be better understood by analyzing the physiology and gene expression of bacteria in low-oxygen environments. We used high-throughput transcriptomics and proteomics to compare the expression profiles of E. coli grown under aerobic versus microaerobic conditions. Clustering of high-abundance transcripts under microaerobiosis highlighted genes controlling acid-stress adaptation (gadAXW, gadAB, hdeAB-yhiD and hdeD operons), cell adhesion/biofilm formation (pgaABCD and csgDEFG operons), electron transport (cydAB), oligopeptide transport (oppABCDF), and anaerobic respiration/fermentation (hyaABCDEF and hycABCDEFGHI operons). In contrast, downregulated genes were involved in iron transport (fhuABCD, feoABC and fepA-entD operons), iron-sulfur cluster assembly (iscRSUA and sufABCDSE operons), aerobic respiration (sdhDAB and sucABCDSE operons), and de novo nucleotide synthesis (nrdHIEF). Additionally, quantitative proteomics showed that the products (proteins) of these high- or low-abundance transcripts were expressed consistently. Our findings highlight interrelationships among energy production, carbon metabolism, and iron homeostasis. Moreover, we have identified and validated a subset of differentially expressed noncoding small RNAs (i.e., CsrC, RyhB, RprA and GcvB), and we discuss their regulatory functions during microaerobic growth. Collectively, we reveal key changes in gene expression at the transcriptional and post-transcriptional levels that sustain E. coli growth when oxygen levels are low.

Keywords: acid stress response; anaerobic respiration; iron homeostasis; transcriptional and post-transcriptional regulation.


Conflict of interest statement

The authors declare no conflict of interest.

Figures

Figure 1
Figure 1
Identification of differentially expressed genes (DEGs). (A) MA plot showing the relationship between gene expression level (A values on the x axis) and fold-change (FC) (M values on the y axis) across genes. The discontinuous horizontal black lines indicate the fold-change (FC) threshold applied (absolute value of log2 FC ≥ 2). DEGs displaying statistical significance (i.e., meeting this FC criterion) are shown as red (176 upregulated genes) or green (104 downregulated genes) dots. (B) Volcano plot displaying FC plotted against the false discovery rate (FDR) p-value. The y axis represents the −log10 FDR p-value and the x axis represents the log2 FC value. The horizontal black line indicates the significance threshold (−log10 p-value ≥ 1), and the vertical black lines indicate the FC threshold (absolute value of log2 FC ≥ 2). DEGs displaying statistical significance (i.e., those meeting both criteria) are shown as 105 upregulated (red dots) and 71 downregulated (green dots) genes in the right-upper and left-upper areas of the panel delineated by black lines, respectively.
Figure 1
Figure 1
Identification of differentially expressed genes (DEGs). (A) MA plot showing the relationship between gene expression level (A values on the x axis) and fold-change (FC) (M values on the y axis) across genes. The discontinuous horizontal black lines indicate the fold-change (FC) threshold applied (absolute value of log2 FC ≥ 2). DEGs displaying statistical significance (i.e., meeting this FC criterion) are shown as red (176 upregulated genes) or green (104 downregulated genes) dots. (B) Volcano plot displaying FC plotted against the false discovery rate (FDR) p-value. The y axis represents the −log10 FDR p-value and the x axis represents the log2 FC value. The horizontal black line indicates the significance threshold (−log10 p-value ≥ 1), and the vertical black lines indicate the FC threshold (absolute value of log2 FC ≥ 2). DEGs displaying statistical significance (i.e., those meeting both criteria) are shown as 105 upregulated (red dots) and 71 downregulated (green dots) genes in the right-upper and left-upper areas of the panel delineated by black lines, respectively.
Figure 2
Figure 2
Functional classification of the differentially expressed genes (DEGs). (A,B) Gene ontology (GO) enrichment terms were categorized into biological process (BP), cellular component (CC), or molecular function (MF) for upregulated DEGs (A) and downregulated DEGs (B). Symbol codes for enriched subcategory terms are shown on the y axis, and fold enrichment is presented on the x axis of the horizontal histogram. Numbers of genes for each enriched subcategory are shown to the right of the respective horizontal bar in the histogram. A list of enriched subcategory terms is shown. (C,D) Kyoto Encyclopedia of Genes and Genomes (KEGG) pathway enrichment (left panels) and UniProtKB keyword (right panels) analyses were conducted to further classify upregulated (C) and downregulated (D) DEGs. The enriched term and the respective number of observed genes is shown to the left or right of the histogram, respectively.
Figure 2
Figure 2
Functional classification of the differentially expressed genes (DEGs). (A,B) Gene ontology (GO) enrichment terms were categorized into biological process (BP), cellular component (CC), or molecular function (MF) for upregulated DEGs (A) and downregulated DEGs (B). Symbol codes for enriched subcategory terms are shown on the y axis, and fold enrichment is presented on the x axis of the horizontal histogram. Numbers of genes for each enriched subcategory are shown to the right of the respective horizontal bar in the histogram. A list of enriched subcategory terms is shown. (C,D) Kyoto Encyclopedia of Genes and Genomes (KEGG) pathway enrichment (left panels) and UniProtKB keyword (right panels) analyses were conducted to further classify upregulated (C) and downregulated (D) DEGs. The enriched term and the respective number of observed genes is shown to the left or right of the histogram, respectively.
Figure 3
Figure 3
Higher fold-change expression and individual TPM values for known E. coli sRNAs detected under microaerobic versus aerobic conditions. (A) The fold-change values for upregulated and downregulated sRNAs are shown in red and green, respectively. (B,C) The y axis shows logarithmic TPM expression values for sRNAs expressed in aerobic (B) and microaerobic (C) cultures, respectively. The x axis shows the sRNAs listed in (A). The individually colored bars represent different biological replicates as indicated.
Figure 4
Figure 4
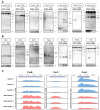
Validation of sRNA expression via Northern blot analysis. (A,B) Hybridizations were performed with the probes specific for selected sRNAs that showed ≥1.5 fold-change (A) or <1.5 fold-change (B) in abundance according to our RNA-seq data collected under microaerobic versus aerobic growth conditions. The 5S rRNA served as an internal loading control. The expected sizes (in nucleotides (nt)) of the full-length sRNAs are indicated. The molecular ladder was obtained by hybridizing total RNA with radiolabeled probes specific for RnpB (M1) RNA (377 nt), 6S RNA (183 nt), 5S rRNA (120 nt), and tRNAAsn (75 nt). Three biological replicates were performed and representative images are shown. (C) Comparison of reads corresponding to the mapped sRNAs CsrB/C (left and middle panels, respectively) and csrA (right panel) mRNAs within the E. coli genome. The y axis represents the number of RNA-seq reads for the sRNAs and csrA mRNA on the largest scale of 400,000 and 4000, respectively. The coding region of each gene is shown in blue at the top of each panel, and expression is shown in blue and red for aerobic and microaerobic growth conditions, respectively.
Figure 5
Figure 5
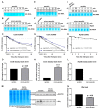
Half-lives of sRNAs CsrB, CsrC, and RyhB and protein abundance of Hfq under aerobic and microaerobic conditions. (AL) Northern blot analysis was used to determine the half-lives of CsrB, CsrC, and RyhB under aerobic (A, E, and I, respectively) and microaerobic ((B,F,J), respectively) conditions. Mean values for CsrB (C), CsrC (G), and RyhB (K) half-lives under aerobic and microaerobic conditions are shown (encompassing three biological repeats, bars represent standard error). The dotted gray line indicates 50% of total RNA remaining. Black circles and blue squares represent the signal intensities corresponding to RNA samples from aerobic and microaerobic cultures, respectively. CsrB, CsrC, and RyhB half-lives under aerobic conditions were calculated as 3.8 ± 0.2, 4.3 ± 0.4, and 7.4 ± 0.1 min (C,G,K), respectively, whereas under microaerobic conditions they were 5.5 ± 0.3 min, 6.1 ± 0.4 min, and no detectable signal (see panels (B,F,J)), respectively. Bar graph shows the relative steady-state levels of small RNAs (time 0) normalized to their levels under aerobic conditions, which were arbitrarily set as 1. Experiments were performed with three biological replicates and representative images are shown. The steady-state level of CsrB under microaerobiosis relative to aerobiosis was 1.03 ± 0.05-fold (p-value = 0.49) (D), whereas for CsrC it was 5.32 ± 0.51-fold (p-value < 0.0001, indicated as ****) (H). Expression of RyhB was not detectable (nd) under microaerobic conditions (L). (M) Hfq protein abundance analyzed via Western blotting. Equal amounts of total protein were fractionated in 20% SDS polyacrylamide gels and transferred to a membrane, and the lower part of the membrane was probed with anti-Hfq antibody. The upper part of the membrane was used to detect GAPDH as a loading control. Experiments were performed with three biological replicates and representative images are shown. (N) Quantification of Hfq level. The signal obtained with anti-Hfq antibody was normalized using GAPDH and further processed to calculate the relative protein expression level, plotted as vertical bars. Hfq level under microaerobiosis was normalized to its level under aerobiosis, which was arbitrarily set as 1. The difference in Hfq level under these conditions was not statistically significant (p-value = 0.26).
Figure 6
Figure 6
Protein–protein interaction networks of differentially abundant proteins. (A,B) The protein–protein interaction networks for increased (A) and decreased (B) differentially abundant proteins were generated using the STRING platform (https://string-db.org/). Abundance-increased proteins were involved in processes such as glycolysis, ATP metabolism, and coenzyme/small-molecule metabolism, for which proteins are represented in red, blue, and green, respectively. Abundance-decreased proteins were involved in ribosome biogenesis, post-transcriptional regulation of gene expression and peptide metabolism, and are indicated in red, blue, and green, respectively.
Figure 6
Figure 6
Protein–protein interaction networks of differentially abundant proteins. (A,B) The protein–protein interaction networks for increased (A) and decreased (B) differentially abundant proteins were generated using the STRING platform (https://string-db.org/). Abundance-increased proteins were involved in processes such as glycolysis, ATP metabolism, and coenzyme/small-molecule metabolism, for which proteins are represented in red, blue, and green, respectively. Abundance-decreased proteins were involved in ribosome biogenesis, post-transcriptional regulation of gene expression and peptide metabolism, and are indicated in red, blue, and green, respectively.

References

    1. Sassone-Corsi M., Raffatellu M. No vacancy: How beneficial microbes cooperate with immunity to provide colonization resistance to pathogens. J. Immunol. 2015;194:4081–4087. doi: 10.4049/jimmunol.1403169. - DOI - PMC - PubMed
    1. Karp P.D., Ong W.K., Paley S., Billington R., Caspi R., Fulcher C., Kothari A., Krummenacker M., Latendresse M., Midford P.E., et al. The EcoCyc Database. EcoSal Plus. 2018;8 doi: 10.1128/ecosalplus.ESP-0006-2018. - DOI - PMC - PubMed
    1. Stewart K.L., Stewart A.M., Bobik T.A. Prokaryotic Organelles: Bacterial Microcompartments in E. coli and Salmonella. EcoSal Plus. 2020:9. doi: 10.1128/ecosalplus.ESP-0025-2019. - DOI - PMC - PubMed
    1. Choi K.R., Shin J.H., Cho J.S., Yang D., Lee S.Y. Systems Metabolic Engineering of Escherichia coli. EcoSal Plus. 2016;7 doi: 10.1128/ecosalplus.ESP-0010-2015. - DOI - PubMed
    1. Alexeeva S., Hellingwerf K.J., Teixeira de Mattos M.J. Requirement of ArcA for redox regulation in Escherichia coli under microaerobic but not anaerobic or aerobic conditions. J. Bacteriol. 2003;185:204–209. doi: 10.1128/JB.185.1.204-209.2003. - DOI - PMC - PubMed