

Molecular Interactions of Tannic Acid with Proteins Associated with SARS-CoV-2 Infectivity
- PMID: 35269785
- PMCID: PMC8910432
- DOI: 10.3390/ijms23052643
Molecular Interactions of Tannic Acid with Proteins Associated with SARS-CoV-2 Infectivity
Abstract
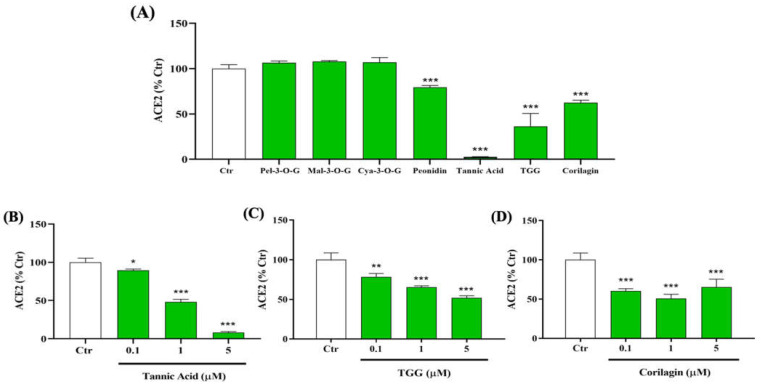
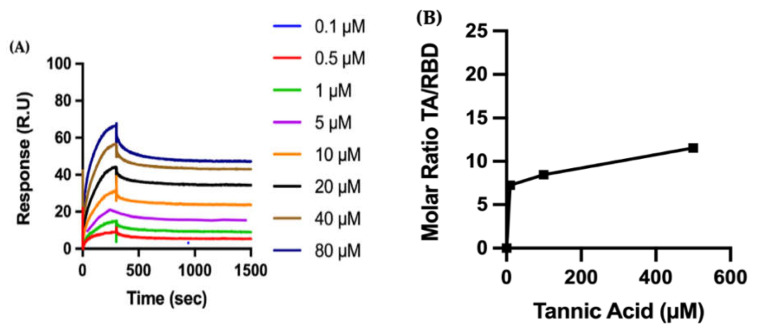
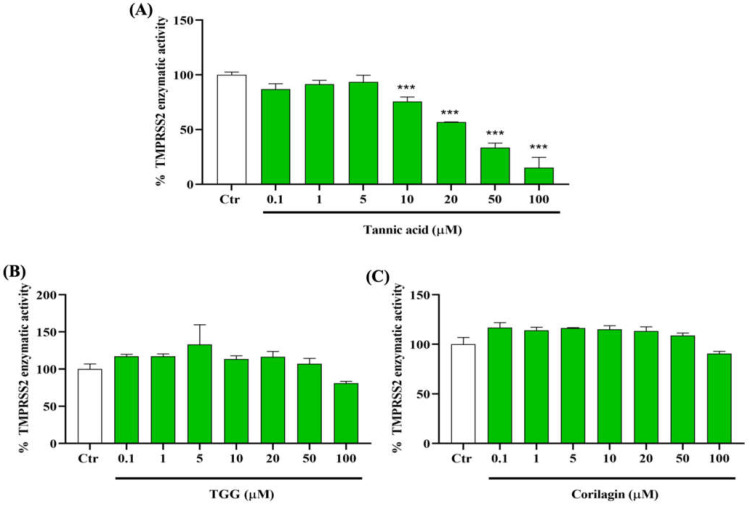
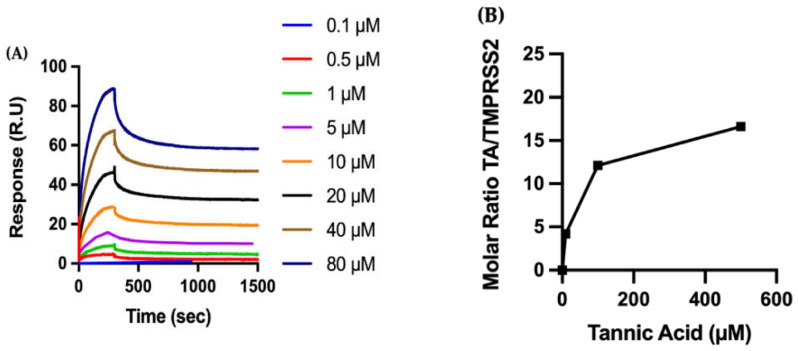
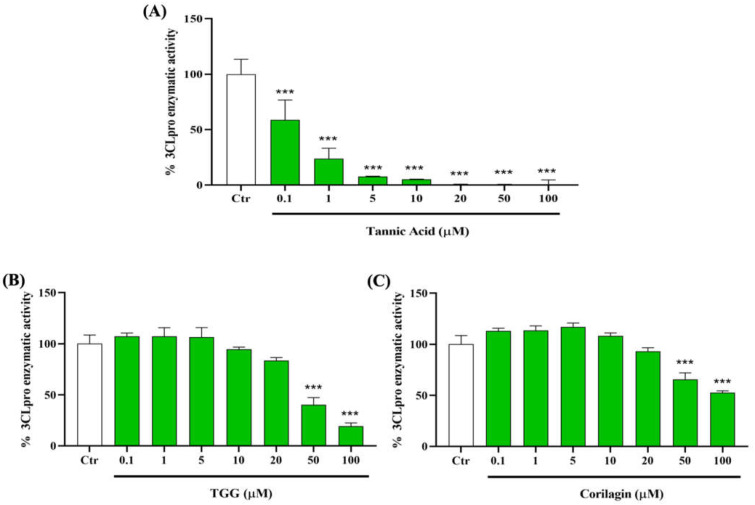
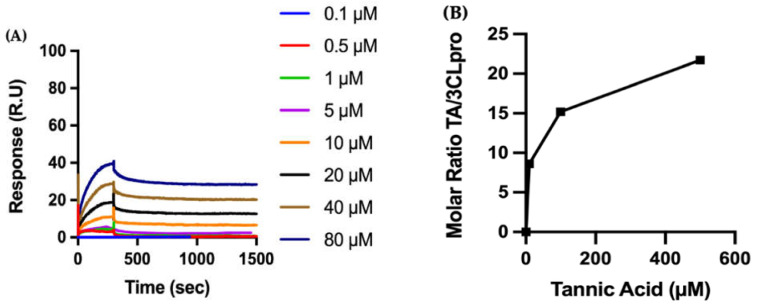
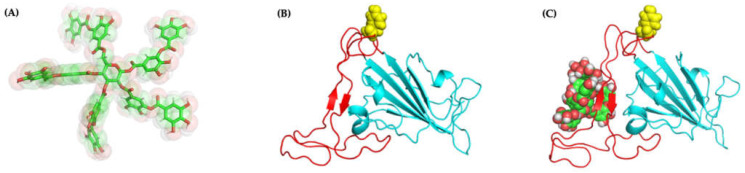
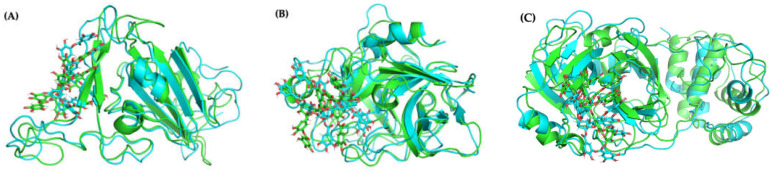
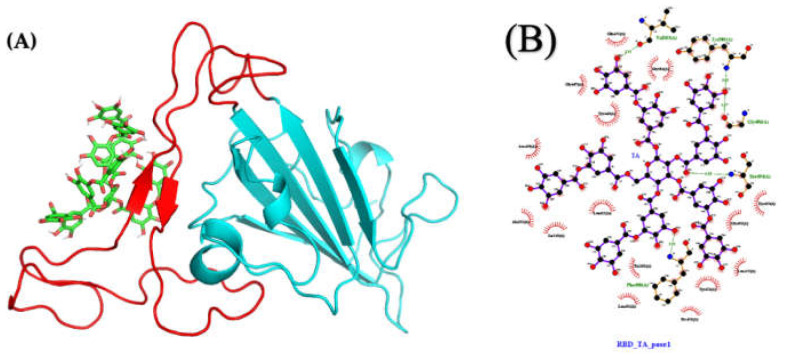
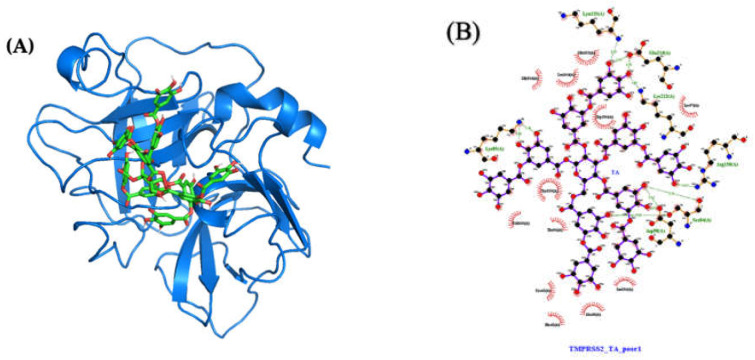
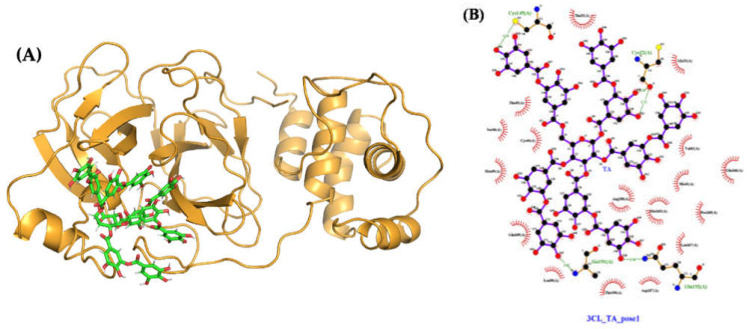
The overall impact of severe acute respiratory syndrome coronavirus 2 (SARS-CoV-2) on our society is unprecedented. The identification of small natural ligands that could prevent the entry and/or replication of the coronavirus remains a pertinent approach to fight the coronavirus disease (COVID-19) pandemic. Previously, we showed that the phenolic compounds corilagin and 1,3,6-tri-O-galloyl-β-D-glucose (TGG) inhibit the interaction between the SARS-CoV-2 spike protein receptor binding domain (RBD) and angiotensin-converting enzyme 2 (ACE2), the SARS-CoV-2 target receptor on the cell membrane of the host organism. Building on these promising results, we now assess the effects of these phenolic ligands on two other crucial targets involved in SARS-CoV-2 cell entry and replication, respectively: transmembrane protease serine 2 (TMPRSS2) and 3-chymotrypsin like protease (3CLpro) inhibitors. Since corilagin, TGG, and tannic acid (TA) share many physicochemical and structural properties, we investigate the binding of TA to these targets. In this work, a combination of experimental methods (biochemical inhibition assays, surface plasmon resonance, and quartz crystal microbalance with dissipation monitoring) confirms the potential role of TA in the prevention of SARS-CoV-2 infectivity through the inhibition of extracellular RBD/ACE2 interactions and TMPRSS2 and 3CLpro activity. Moreover, molecular docking prediction followed by dynamic simulation and molecular mechanics Poisson-Boltzmann surface area (MMPBSA) free energy calculation also shows that TA binds to RBD, TMPRSS2, and 3CLpro with higher affinities than TGG and corilagin. Overall, these results suggest that naturally occurring TA is a promising candidate to prevent and inhibit the infectivity of SARS-CoV-2.
Keywords: 3CLpro; COVID-19; RBD; SARS-CoV-2; TMPRSS2; molecular dynamics; polyphenols.
Conflict of interest statement
The authors declare no conflict of interest, financial or otherwise.
Figures
Similar articles
-
Corilagin and 1,3,6-Tri-O-galloy-β-D-glucose: potential inhibitors of SARS-CoV-2 variants.Phys Chem Chem Phys. 2021 Jul 14;23(27):14873-14888. doi: 10.1039/d1cp01790j. Phys Chem Chem Phys. 2021. PMID: 34223589
-
Corilagin prevents SARS-CoV-2 infection by targeting RBD-ACE2 binding.Phytomedicine. 2021 Jul;87:153591. doi: 10.1016/j.phymed.2021.153591. Epub 2021 May 5. Phytomedicine. 2021. PMID: 34029937 Free PMC article.
-
Geraniin Inhibits the Entry of SARS-CoV-2 by Blocking the Interaction between Spike Protein RBD and Human ACE2 Receptor.Int J Mol Sci. 2021 Aug 10;22(16):8604. doi: 10.3390/ijms22168604. Int J Mol Sci. 2021. PMID: 34445310 Free PMC article.
-
Contributions of human ACE2 and TMPRSS2 in determining host-pathogen interaction of COVID-19.J Genet. 2021;100(1):12. doi: 10.1007/s12041-021-01262-w. J Genet. 2021. PMID: 33707363 Free PMC article. Review.
-
Identifying Exifone as a Dual-Target Agent Targeting Both SARS-CoV-2 3CL Protease and the ACE2/S-RBD Interaction Among Clinical Polyphenolic Compounds.Int J Mol Sci. 2025 Mar 2;26(5):2243. doi: 10.3390/ijms26052243. Int J Mol Sci. 2025. PMID: 40076865 Free PMC article. Review.
Cited by
-
Antiviral functionalization of cellulose using tannic acid and tannin-rich extracts.Front Microbiol. 2023 Dec 6;14:1287167. doi: 10.3389/fmicb.2023.1287167. eCollection 2023. Front Microbiol. 2023. PMID: 38125579 Free PMC article.
-
Identification of anti-SARS-CoV-2 agents based on flavor/fragrance compositions that inhibit the interaction between the virus receptor binding domain and human angiotensin converting enzyme 2.PLoS One. 2022 Dec 19;17(12):e0279182. doi: 10.1371/journal.pone.0279182. eCollection 2022. PLoS One. 2022. PMID: 36534650 Free PMC article.
-
Biocidal Activity of Tannic Acid-Prepared Silver Nanoparticles towards Pathogens Isolated from Patients with Exacerbations of Chronic Rhinosinusitis.Int J Mol Sci. 2022 Dec 6;23(23):15411. doi: 10.3390/ijms232315411. Int J Mol Sci. 2022. PMID: 36499763 Free PMC article.
-
Tannic acids and proanthocyanidins in tea inhibit SARS-CoV-2 variants infection.Am J Cancer Res. 2024 May 15;14(5):2555-2569. doi: 10.62347/QJBG3026. eCollection 2024. Am J Cancer Res. 2024. PMID: 38859869 Free PMC article.
-
Possible roles of phytochemicals with bioactive properties in the prevention of and recovery from COVID-19.Front Nutr. 2024 Jul 10;11:1408248. doi: 10.3389/fnut.2024.1408248. eCollection 2024. Front Nutr. 2024. PMID: 39050135 Free PMC article.
References
-
- Dejnirattisai W., Huo J., Zhou D., Zahradnik J., Supasa P., Liu C., Duyvesteyn H.M.E., Ginn H.M., Mentzer H.M., Tuekprakhon A., et al. SARS-CoV-2 Omicron-B.1.1.529 leads to widespread escape from neutralizing antibody responses. Cell. 2022;185:467–484. doi: 10.1016/j.cell.2021.12.046. - DOI - PMC - PubMed
-
- Hoffmann M., Kleine-Weber H., Schroeder S., Kruger N., Herrler T., Erichsen S., Schiergens T.S., Herrler G., Wu N.H., Nitsche A., et al. SARS-CoV-2 Cell Entry Depends on ACE2 and TMPRSS2 and Is Blocked by a Clinically Proven Protease Inhibitor. Cell. 2020;181:271–280.e278. doi: 10.1016/j.cell.2020.02.052. - DOI - PMC - PubMed
MeSH terms
Substances
Grants and funding
LinkOut - more resources
Full Text Sources
Medical
Miscellaneous
