. 2022 Mar 2;23(5):2757.
doi: 10.3390/ijms23052757.

Low-Dose Delta-9-Tetrahydrocannabinol as Beneficial Treatment for Aged APP/PS1 Mice

Affiliations

Low-Dose Delta-9-Tetrahydrocannabinol as Beneficial Treatment for Aged APP/PS1 Mice

Yanhong Wang et al. Int J Mol Sci. .

Abstract

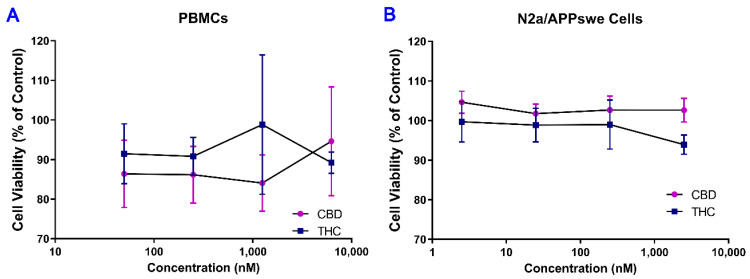
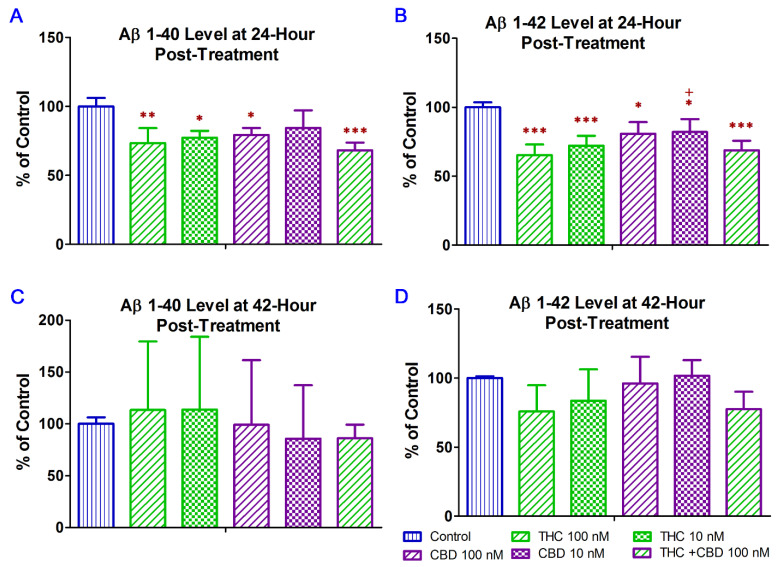
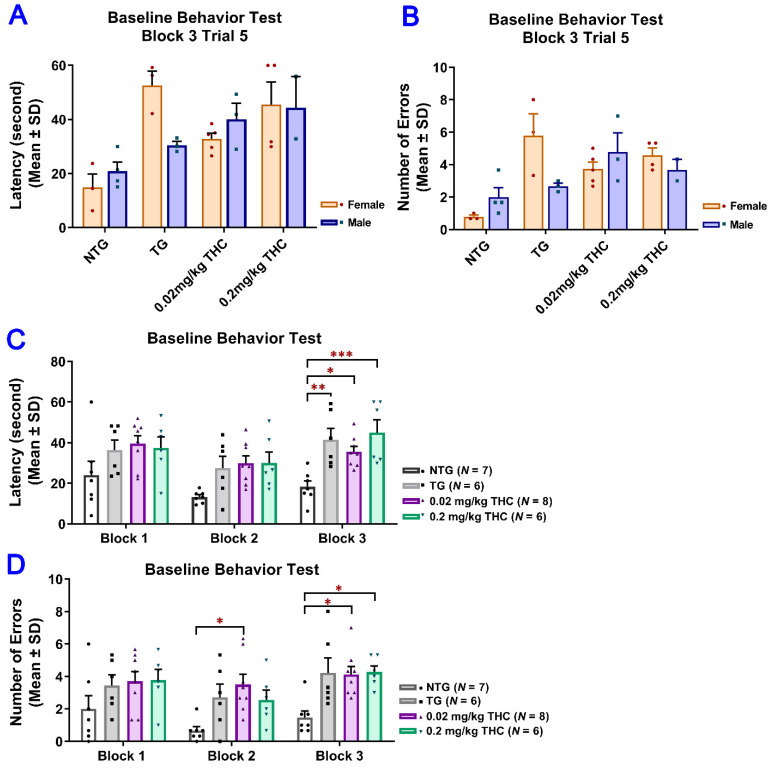
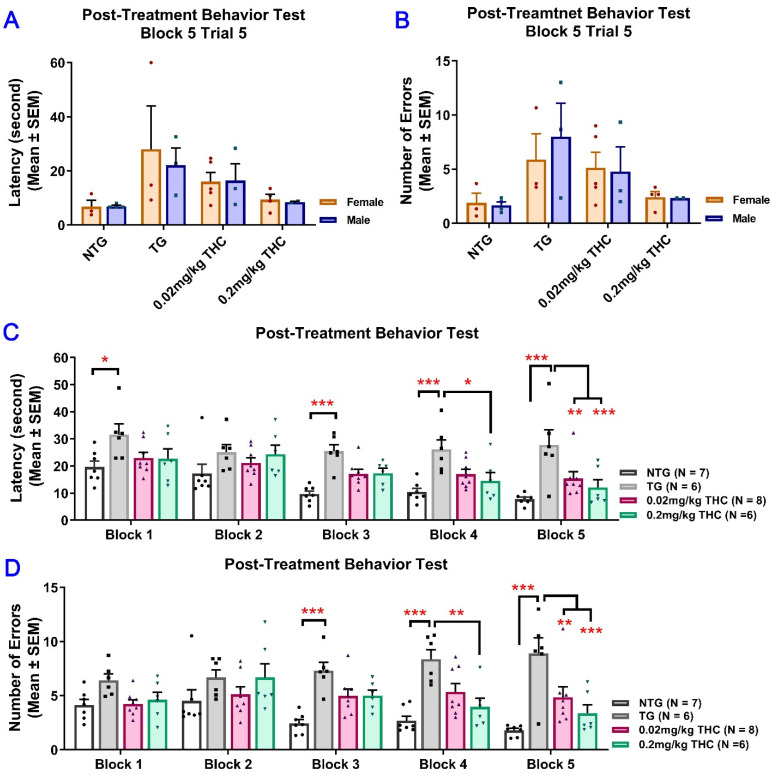
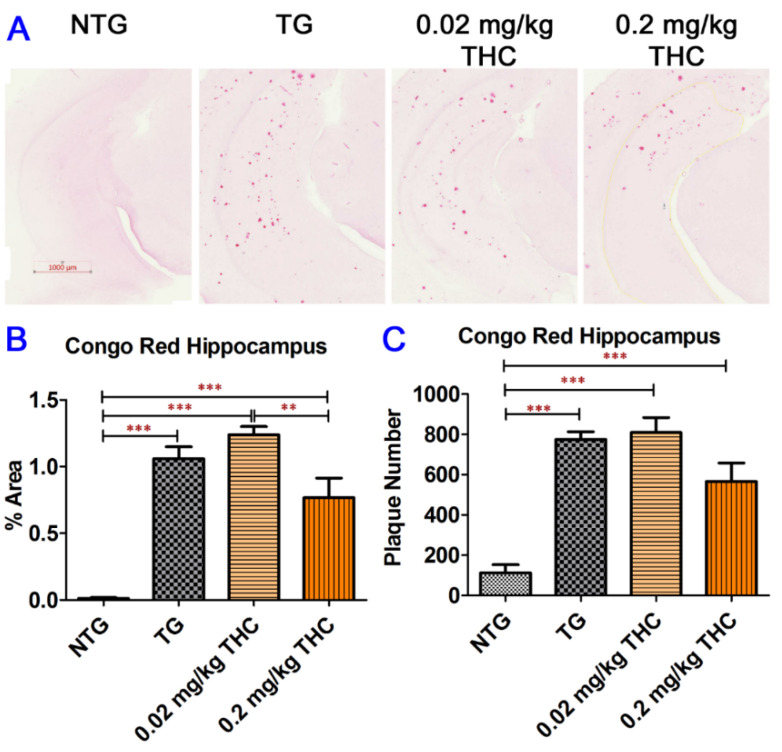
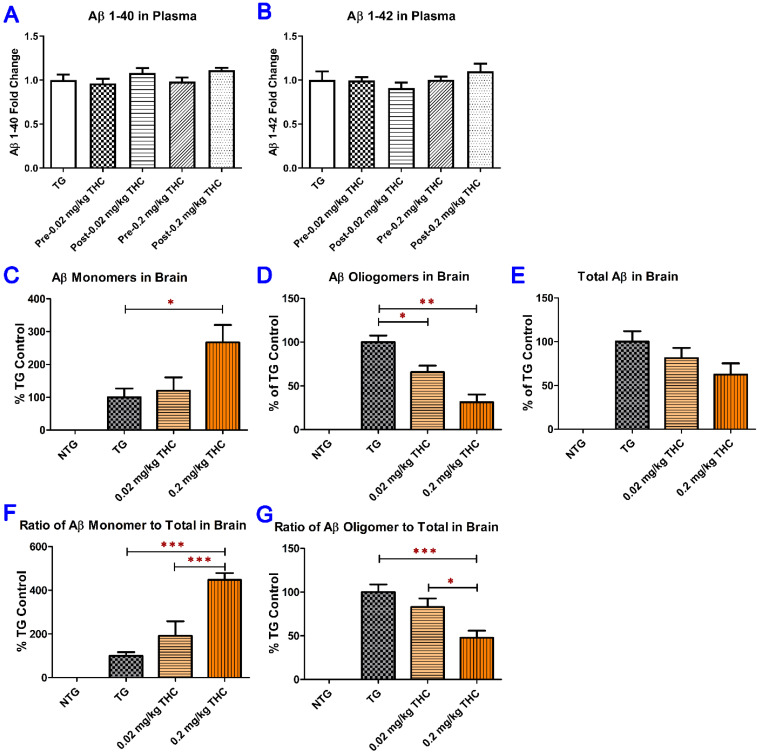
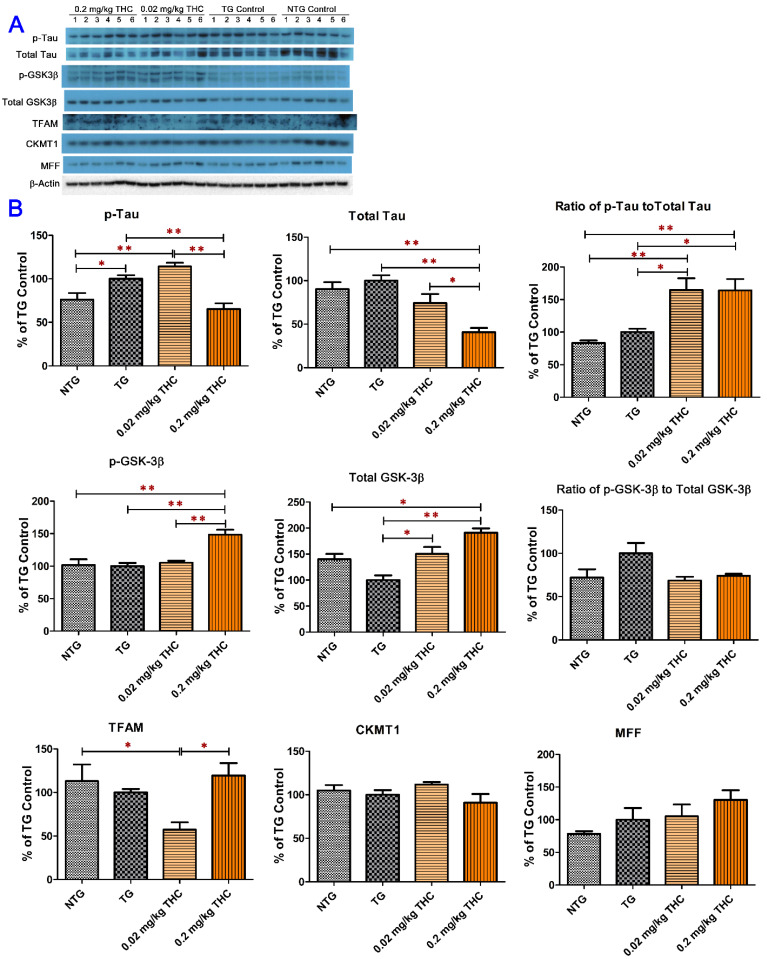
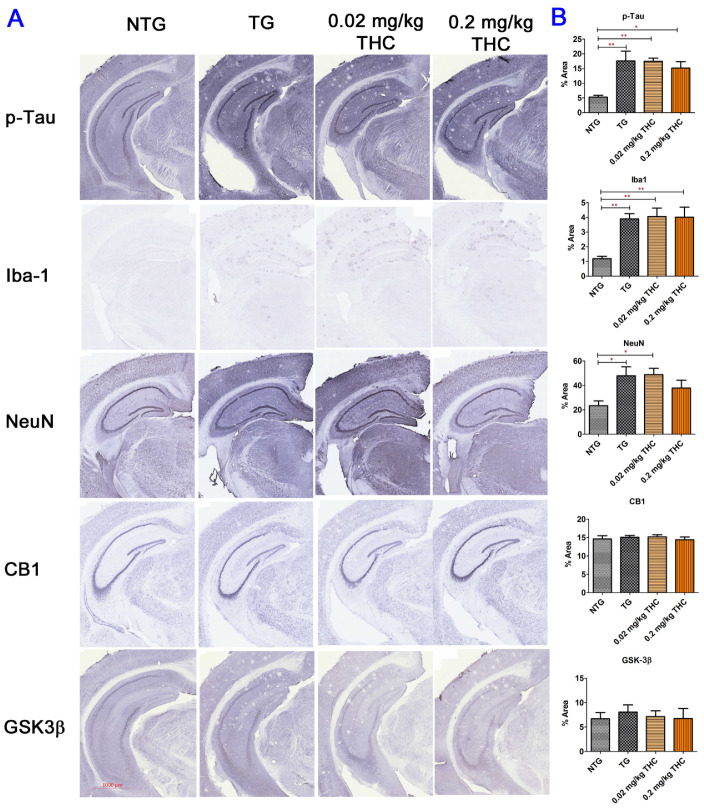
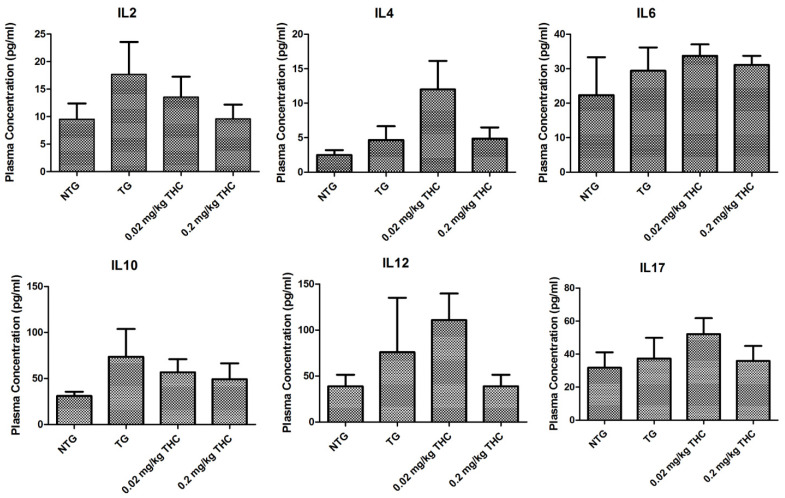
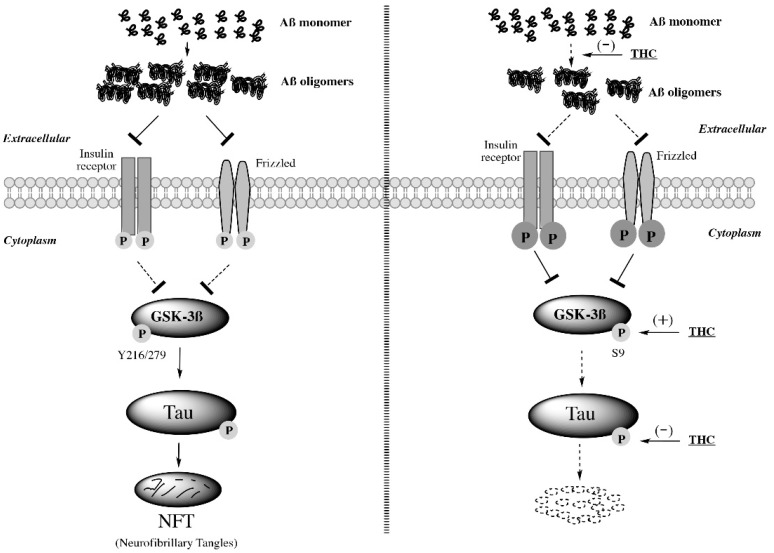
Studies on the effective and safe therapeutic dosage of delta-9-tetrahydrocannabinol (THC) for the treatment of Alzheimer's disease (AD) have been sparse due to the concern about THC's psychotropic activity. The present study focused on demonstrating the beneficial effect of low-dose THC treatment in preclinical AD models. The effect of THC on amyloid-β (Aβ) production was examined in N2a/AβPPswe cells. An in vivo study was conducted in aged APP/PS1 transgenic mice that received an intraperitoneal injection of THC at 0.02 and 0.2 mg/kg every other day for three months. The in vitro study showed that THC inhibited Aβ aggregation within a safe dose range. Results of the radial arm water maze (RAWM) test demonstrated that treatment with 0.02 and 0.2 mg/kg of THC for three months significantly improved the spatial learning performance of aged APP/PS1 mice in a dose-dependent manner. Results of protein analyses revealed that low-dose THC treatment significantly decreased the expression of Aβ oligomers, phospho-tau and total tau, and increased the expression of Aβ monomers and phospho-GSK-3β (Ser9) in the THC-treated brain tissues. In conclusion, treatment with THC at 0.2 and 0.02 mg/kg improved the spatial learning of aged APP/PS1 mice, suggesting low-dose THC is a safe and effective treatment for AD.

Keywords: APP/PS1 transgenic mice; Alzheimer’s disease; amyloid-β; cannabidiol; delta-9-tetrahydrocannabinol; radial arm water maze test.


Conflict of interest statement

The authors declare no conflict of interest. The funders had no role in the design of the study.

Figures

Figure 1
Figure 1
Determination of cytotoxicity of THC and CBD in (A) PBMCs and (B) N2a/APPswe cells. Concentration-effect curves demonstrated that treatment with THC or CBD for 40 h had no significant effect on the viability of cultured PBMCs and N2a/APPswe cells over a concentration range of 0.0625–6.25 μM and 0.0025–2.5 μM, respectively. Data are expressed as mean ± standard deviation (SD) (N = 3 for PBMCs. N = 5 for N2a/APPswe cells). Error bars denote SD.
Figure 2
Figure 2
Effect of THC and CBD treatment alone or in combination on Aβ1–40 and Aβ1–42 production in N2a/APPswe cells at 24 (A) for Aβ1–40; (B) for Aβ1–42) and 42 (C) for Aβ1–40; (D) for Aβ1–42) hours after the treatment. The production of Aβ1–40 and Aβ 1–42 in the cell culture supernatant was determined by ELISA. After N2a/APPswe cells were treated with THC and CBD alone or in combination for 24 h, Aβ1–40 and Aβ 1–42 levels in the supernatant reduced significantly by 16~32% and 18~35%, respectively, compared with those in the non-treated control samples. No significant changes in the Aβ1–40 and Aβ 1–42 levels in the supernatant were found between the non-treated and treated samples after the 42-h treatment. Data are expressed as mean ± SD (N = 4). SD is denoted by the error bars. * p < 0.05, ** p < 0.01, and *** p < 0.001 compared with the control group and + p < 0.05 compared with the 100 nM THC treatment group using one-way ANOVA followed by the Tukey–Kramer post hoc multiple comparison test.
Figure 3
Figure 3
Evaluation of the baseline spatial reference memory of 14-month-old APP/PS1 mice in three study groups (i.e., the control transgenic control (TG), 0.02 mg/kg and 0.2 mg/kg THC treatment groups as well as 14-month-old non-transgenic (NTG) mice using the radial arm water maze (RAWM) test. Individual mice were subjected to five blocks of trials each day for three days with each block containing three trials. (A) No significant difference in baseline latency between male and female mice within individual study groups (p = 0.56, p = 0.06, p = 0.51 and p = 0.947 for NTG, TG, 0.02 mg/kg and 0.2 mg/kg THC groups, respectively, using the Independent sample t test). (B) No significant difference in baseline number of errors between male and female mice within individual study groups (p = 0.356, p = 0.299, p = 0.513, and p = 0.513 for NTG, TG, 0.02 mg/kg, and 0.2 mg/kg THC groups, respectively, using the Independent sample t test). (C) Significant increase in the baseline latency in TG (p < 0.01), 0.02 mg/kg THC (p < 0.05), and 0.2 mg/kg THC (p < 0.001) groups compared with the NTG control group in Trial 3 of the last block on day 3. (D) Significant increase in the baseline latency in TG (p < 0.01), 0.02 mg/kg THC (p < 0.05), and 0.2 mg/kg THC (p < 0.001) groups compared with the NTG control group in Trial 3 of the last block on day 3. Data are expressed as mean ± SD. SD is denoted by the error bars. A comparison of mean latency and number of errors between female and male animals in individual study groups was made with multiple t-tests with correction for multiple comparisons using the Holm–Sidak method. Comparison of mean baseline latency and number of errors among different study groups were conducted using one-way ANOVA with the post hoc Bonferroni’s multiple comparisons test. * p < 0.05, ** p < 0.01, and *** p < 0.001 compared between the control NTG (N = 7), control TG (N = 6), 0.02 mg/kg THC (N = 8), and 0.2 mg/kg THC (N = 6) groups.
Figure 4
Figure 4
Evaluation of the effect of THC treatment on improving the spatial reference memory of 14-month-old APP/PS1 mice using the RAWM test. Individual mice were subjected to five trials per day for 15 consecutive days with each block containing 15 trials. (A) No significant difference in latency between male and female mice within individual study groups in Trial 5 of Block 5 (p = 0.998, p = 0.996, p = 0.998, and p = 0.996 for NTG, TG, 0.02 mg/kg, and 0.2 mg/kg THC groups, respectively, using the Independent sample t test). (B) No significant difference in number of errors between male and female mice within individual study groups in Trial 5 of Block 5 (p = 0.992, p = 0.979, p = 0.992, and p = 0.992 for NTG, TG, 0.02 mg/kg, and 0.2 mg/kg THC groups, respectively, using the Independent sample t test). (C) Significant decrease in the latency in NTG control (p < 0.001), 0.02 mg/kg THC (p < 0.01, and 0.2 mg/kg THC (p < 0.001) groups compared with the TG control group in Block 5 Trial 5. Significant decrease in latency was also found in the NTG control (p < 0.001) and 0.2 mg/kg THC (p < 0.05) groups compared to the TG control group in Block 4 Trial 5. (D) Significant decrease in the number of errors in 0.02 mg/kg THC (p < 0.01) and 0.2 mg/kg THC (p < 0.001) groups compared with the TG control group in Block 5 Trial 5. Significant decrease in the number of errors was also found in the NTG control (p < 0.001) and 0.2 mg/kg THC (p < 0.01) groups compared with the TG control group in Block 4 Trial 5. Data are expressed as mean ± SD. SD is denoted by the error bars. Comparison of mean latency and number of errors between female and male animals in individual study groups was made by multiple t-tests with correction for multiple comparisons using the Holm–Sidak method. Comparison of mean latency and number of errors among different study groups were made using one-way ANOVA with post hoc Bonferroni’s multiple comparisons test. * p < 0.05, ** p < 0.01 and *** p < 0.001 compared between the control NTG (N = 7), control TG (N = 6), 0.02 mg/kg THC (N = 8), and 0.2 mg/kg THC (N = 6) groups.
Figure 5
Figure 5
Congo Red staining of Aβ plaques in mouse hippocampi. (A) Representative Congo Red staining images acquired under light microscopy. (B) Quantification of Congo red staining shown as the percentage of Congo red-positive area compared to the hippocampus tissue area per field. (C) Quantification of Congo red staining shown as the number of Congo red stained plague in the hippocampus area. The non-transgenic (NTG) mice had significantly fewer Aβ plaques than all the APP/PS1 transgenic (TG) mice regardless of treatment (p < 0.001 for all). No significant differences in Aβ plaque area and number of Aβ plaques were found between the vehicle control and 0.02 or 0.2 mg/kg THC treated APP/PS1 mice. However, the Aβ plaque area in hippocampi sections of APP/PS1 mice treated with 0.2 mg/kg THC was significantly lower than those treated with 0.02 mg/kg THC (p < 0.01). Data are expressed as mean ± SD (N = 7 for the control NTG group, N = 6 for the control TG, and 0.2 mg/kg THC groups, and N = 8 for the 0.02 mg/kg THC group). Error bars denote the SD. ** p < 0.01 and *** p < 0.001 compared between the control NTG mice, control APP/PS1 mice, and APP/PS1 mice treated with 0.02 and 0.2 mg/kg THC using one-way ANOVA followed by the Tukey–Kramer post hoc multiple comparison test.
Figure 6
Figure 6
Determination of both soluble and insoluble Aβ1–40 (A) and Aβ1–42 (B) levels in the plasma using ELISA. Plasma samples were collected from the APP/PS1 mice before the start and after the 3-month THC treatment. No significant difference in soluble and insoluble Aβ1–40 and Aβ1–42 levels in plasma was found among all treatment groups and between the baseline and post-treatment levels (N = 7 for the control NTG group, N = 6 for the control TG and 0.2 mg/kg THC groups, and N = 8 for the 0.02 mg/kg THC group). Determination of Aβ monomers (C), Aβ oligomers (D), and total Aβ (E) in mouse brain tissue using the semi-quantitative western blotting and the total Aβ normalized Aβ monomer (F) and oligomer levels (G). The total Aβ normalized Aβ monomer (or oligomer) level was calculated as the ratio of Aβ monomer (or oligomer) level to total Aβ level. Treatment with 0.2 mg/kg THC significantly increased the Aβ monomer level and decreased Aβ oligomer level compared with the control treatment in TG mice. Data are expressed as mean ± SD (N = 6 for each study group). SD is denoted by the error bars. * p < 0.05, ** p < 0.01, and *** p < 0.001 compared between the control NTG mice, control APP/PS1 mice, and APP/PS1 mice treated with 0.02 and 0.2 mg/kg THC using one-way ANOVA followed by the Tukey–Kramer post hoc multiple comparison test.
Figure 7
Figure 7
Evaluation of the effect of THC on the protein expression of phospho-tau, total tau, phospho-GSK-3β, total GSK-3β, TFAM, CKMT1, and MFF in brain homogenates using western blot analysis. (A) Western blot images of the expression of total and phosphorylated Tau and GSK-3β, TFAM, CKMT1, and MFF proteins in individual brain homogenate samples collected from the control NTG (N = 6), control TG (N = 6), 0.02 mg/kg (N = 6), and 0.2 mg/kg (N = 6) THC treatment groups. Detection of β-actin was used to ensure equal sample loading per lane. (B) Relative immunoreactive band intensities are expressed as percent change over the average signal value in the control TG mouse brain homogenates. THC treatment at 0.2 mg/kg significantly decreased the expression levels of phospho-tau and total Tau and increased the expression levels of phospho-GSK3β and total GSK3β compared with the vehicle treatment in APP/PS1 mice. THC treatment at either 0.02 mg/kg or 0.2 mg/kg had no significant effect on the protein levels of TFAM, CKMT1, and MFF in brain homogenates. Data are presented as mean ± SD (N = 6 for each study group). SD is denoted by the error bars. * p < 0.05 and ** p < 0.01 compared between the control NTG mice, control APP/PS1 mice, and APP/PS1 mice treatment with 0.02 and 0.2 mg/kg THC using one-way ANOVA followed by Tukey–Kramer post hoc multiple comparison test.
Figure 8
Figure 8
Immunohistochemical (IHC) analysis of molecular markers associated with the neuropathologic change in AD. (A) Representative IHC images for p-Tau, Iba-1, NeuN, CB1, and GSK3β in brain sections. (B) Quantification of IHC staining of for p-Tau, Iba-1, NeuN, CB1, and GSK3β in brain sections. No statistically significant difference in the expression of phospho-Tau, Iba1, CB1, and GSK-3β and the NeuN area was observed between the vehicle and THC treatment in APP/PS1 mice, suggesting the limited effect of THC on reversing the neuropathologic change in AD. Data are expressed as mean ± SD (N = 7 for the control NTG group, N = 6 for the control TG and 0.2 mg/kg THC groups, and N = 8 for the 0.02 mg/kg THC group). SD is denoted by the error bars. * p < 0.05 and ** p < 0.01 compared between the control NTG mice, control APP/PS1 mice, and APP/PS1 mice treatment with 0.02 and 0.2 mg/kg THC using one-way ANOVA followed by the Tukey–Kramer post hoc multiple comparison test.
Figure 9
Figure 9
Evaluation of the effect of THC treatment on the plasma cytokine levels. Control NTG mice (N = 7) were given IP administration of PBS, while APP/PS1 mice were given IP administration of PBS (N = 6), 0.02 mg/kg THC (N = 8), or 0.2 mg/kg THC (N = 6) once every other day for three months. Plasma cytokine levels were determined using ELISA after the treatments were completed. No statistically significant difference in the plasma levels of any cytokine was observed between any study group. Data are presented as mean ± SD. Statistical analysis was conducted using one-way ANOVA followed by the Tukey–Kramer post hoc multiple comparison test.
Figure 10
Figure 10
Inhibitory effect of low-dose THC treatment on Aβ aggregation, GSK-3β activity, and tau phosphorylation in the brain. Low-dose THC prevents Aβ monomers from forming Aβ oligomers and alleviates the antagonistic effect of Aβ oligomers on insulin receptors and Frizzled so that insulin receptors and Frizzled are able to downregulate GSK-3β activity. Moreover, low-dose THC may decrease GSK-3β activity directly by increasing the Ser9 phosphorylation of GSK-3β. Since the increased GSK-3β activity promotes tau phosphorylation, it is likely that the inhibitory effect of THC on tau phosphorylation is in part attributable to the THC-induced Ser9 phosphorylation of GSK-3β.

Similar articles

Cited by

References

    1. Mechoulam R., Hanuš L.O., Pertwee R., Howlett A.C. Early phytocannabinoid chemistry to endocannabinoids and beyond. Nat. Rev. Neurosci. 2014;15:757–764. doi: 10.1038/nrn3811. - DOI - PubMed
    1. Nelson K.M., Bisson J., Singh G., Graham J.G., Chen S.-N., Friesen J.B., Dahlin J.L., Niemitz M., Walters M.A., Pauli G.F. The Essential Medicinal Chemistry of Cannabidiol (CBD) J. Med. Chem. 2020;63:12137–12155. doi: 10.1021/acs.jmedchem.0c00724. - DOI - PMC - PubMed
    1. Ashton C.H. Pharmacology and effects of cannabis: A brief review. Br. J. Psychiatry J. Ment. Sci. 2001;178:101–106. doi: 10.1192/bjp.178.2.101. - DOI - PubMed
    1. Esposito G., De Filippis D., Carnuccio R., Izzo A., Iuvone T. The marijuana component cannabidiol inhibits β-amyloid-induced tau protein hyperphosphorylation through Wnt/β-catenin pathway rescue in PC12 cells. Klin. Wochenschr. 2006;84:253–258. doi: 10.1007/s00109-005-0025-1. - DOI - PubMed
    1. Maroon J., Bost J. Review of the neurological benefits of phytocannabinoids. Surg. Neurol. Int. 2018;9:91. doi: 10.4103/sni.sni_45_18. - DOI - PMC - PubMed