. 2022 Mar 11;375(6585):eabi6983.
doi: 10.1126/science.abi6983. Epub 2022 Mar 11.

OpenCell: Endogenous tagging for the cartography of human cellular organization

Affiliations

OpenCell: Endogenous tagging for the cartography of human cellular organization

Nathan H Cho et al. Science. .

Abstract

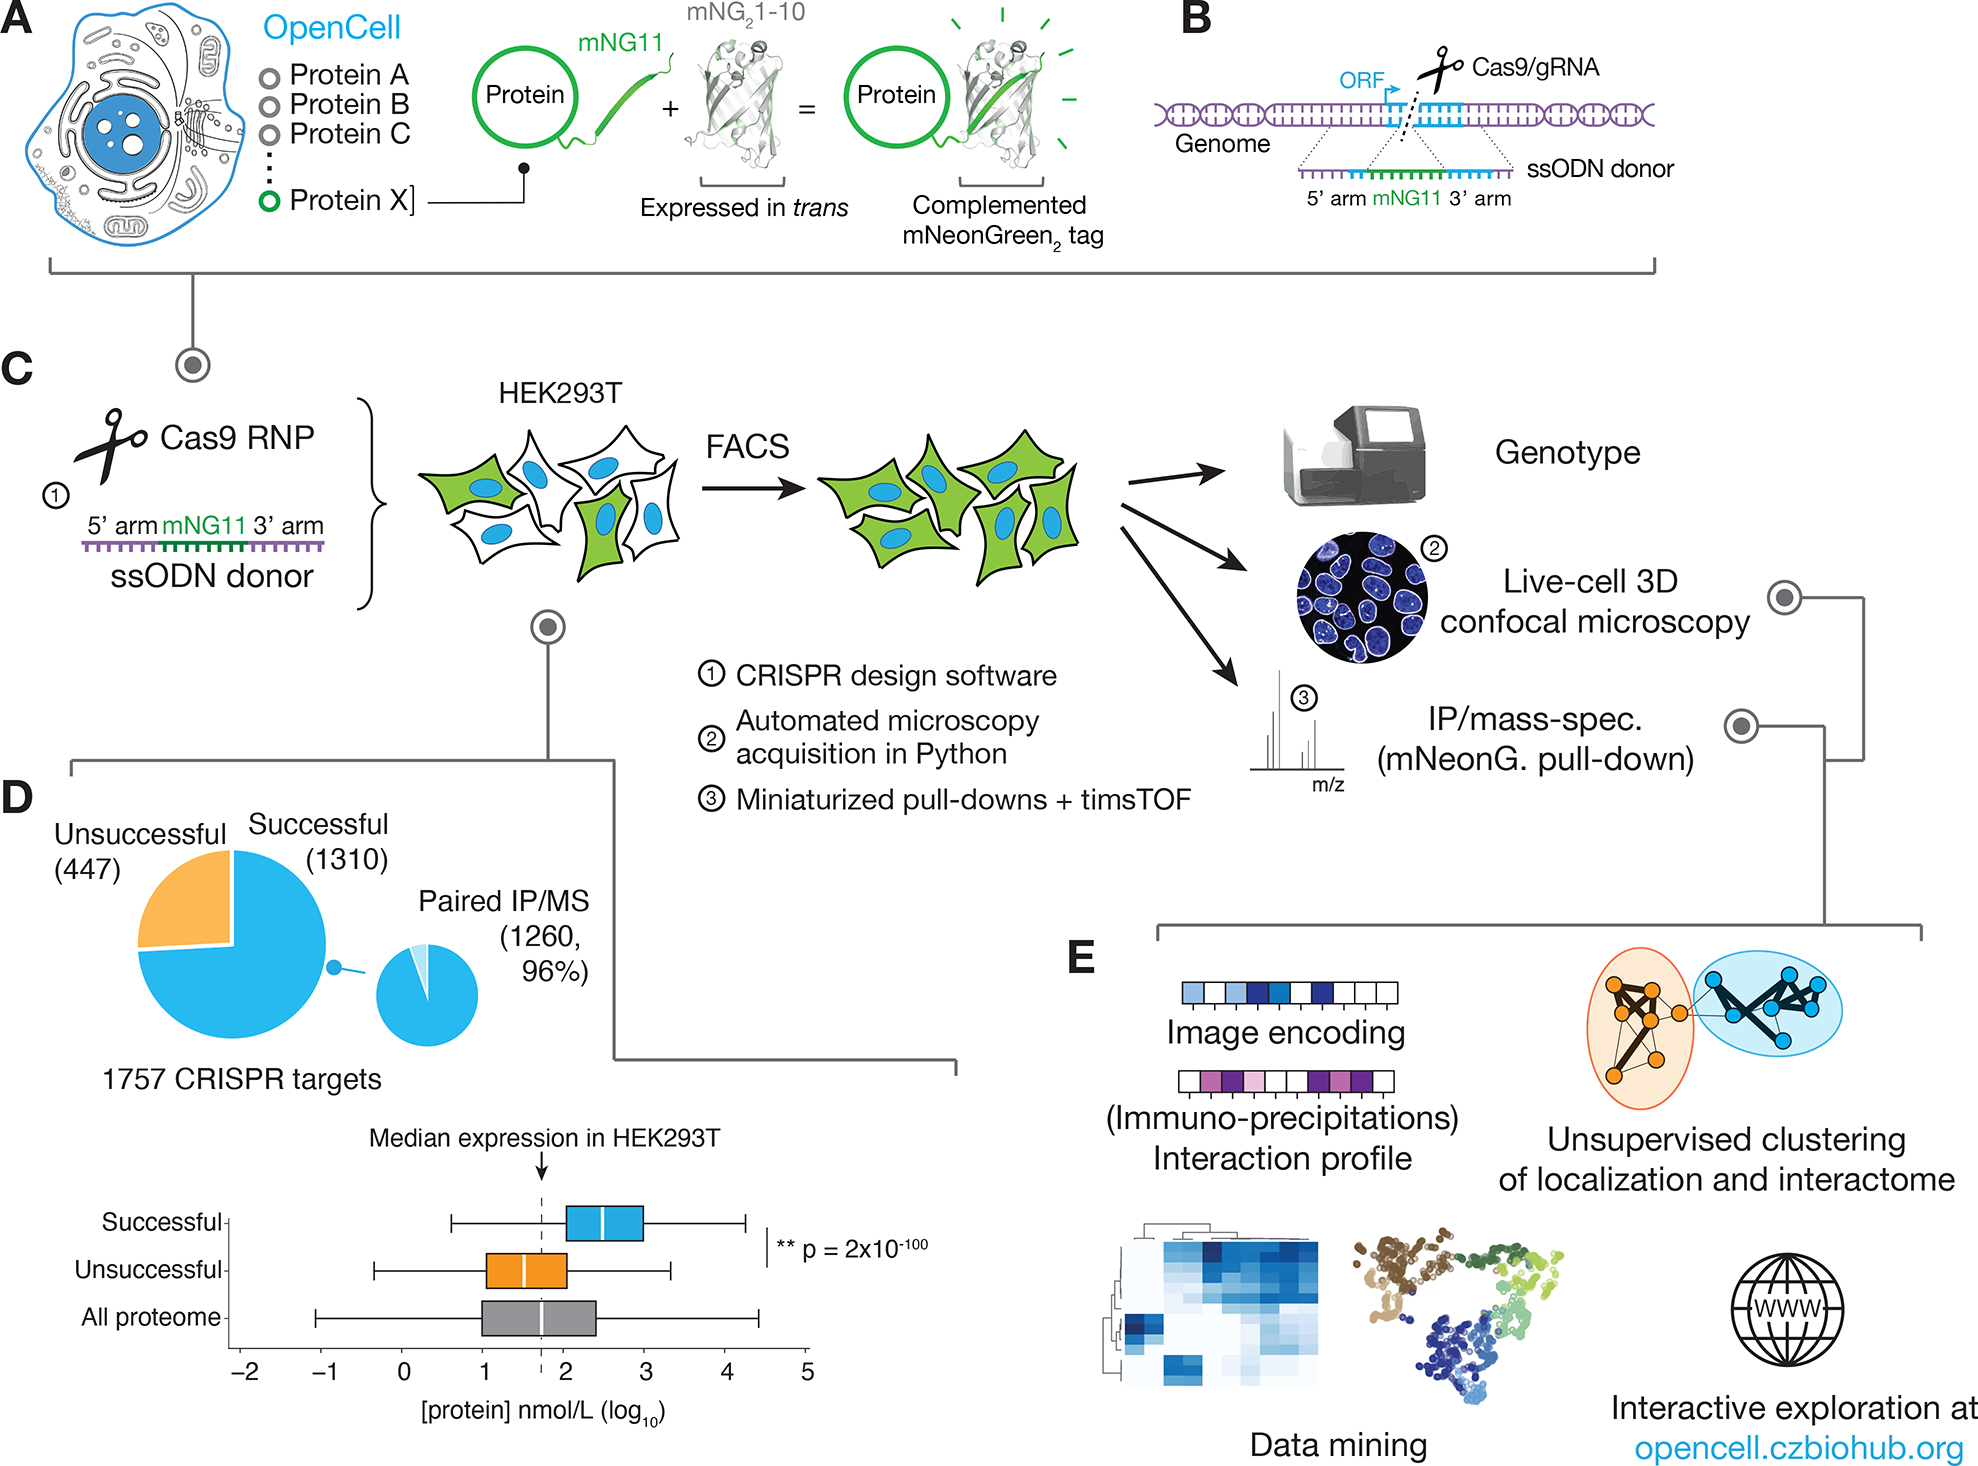
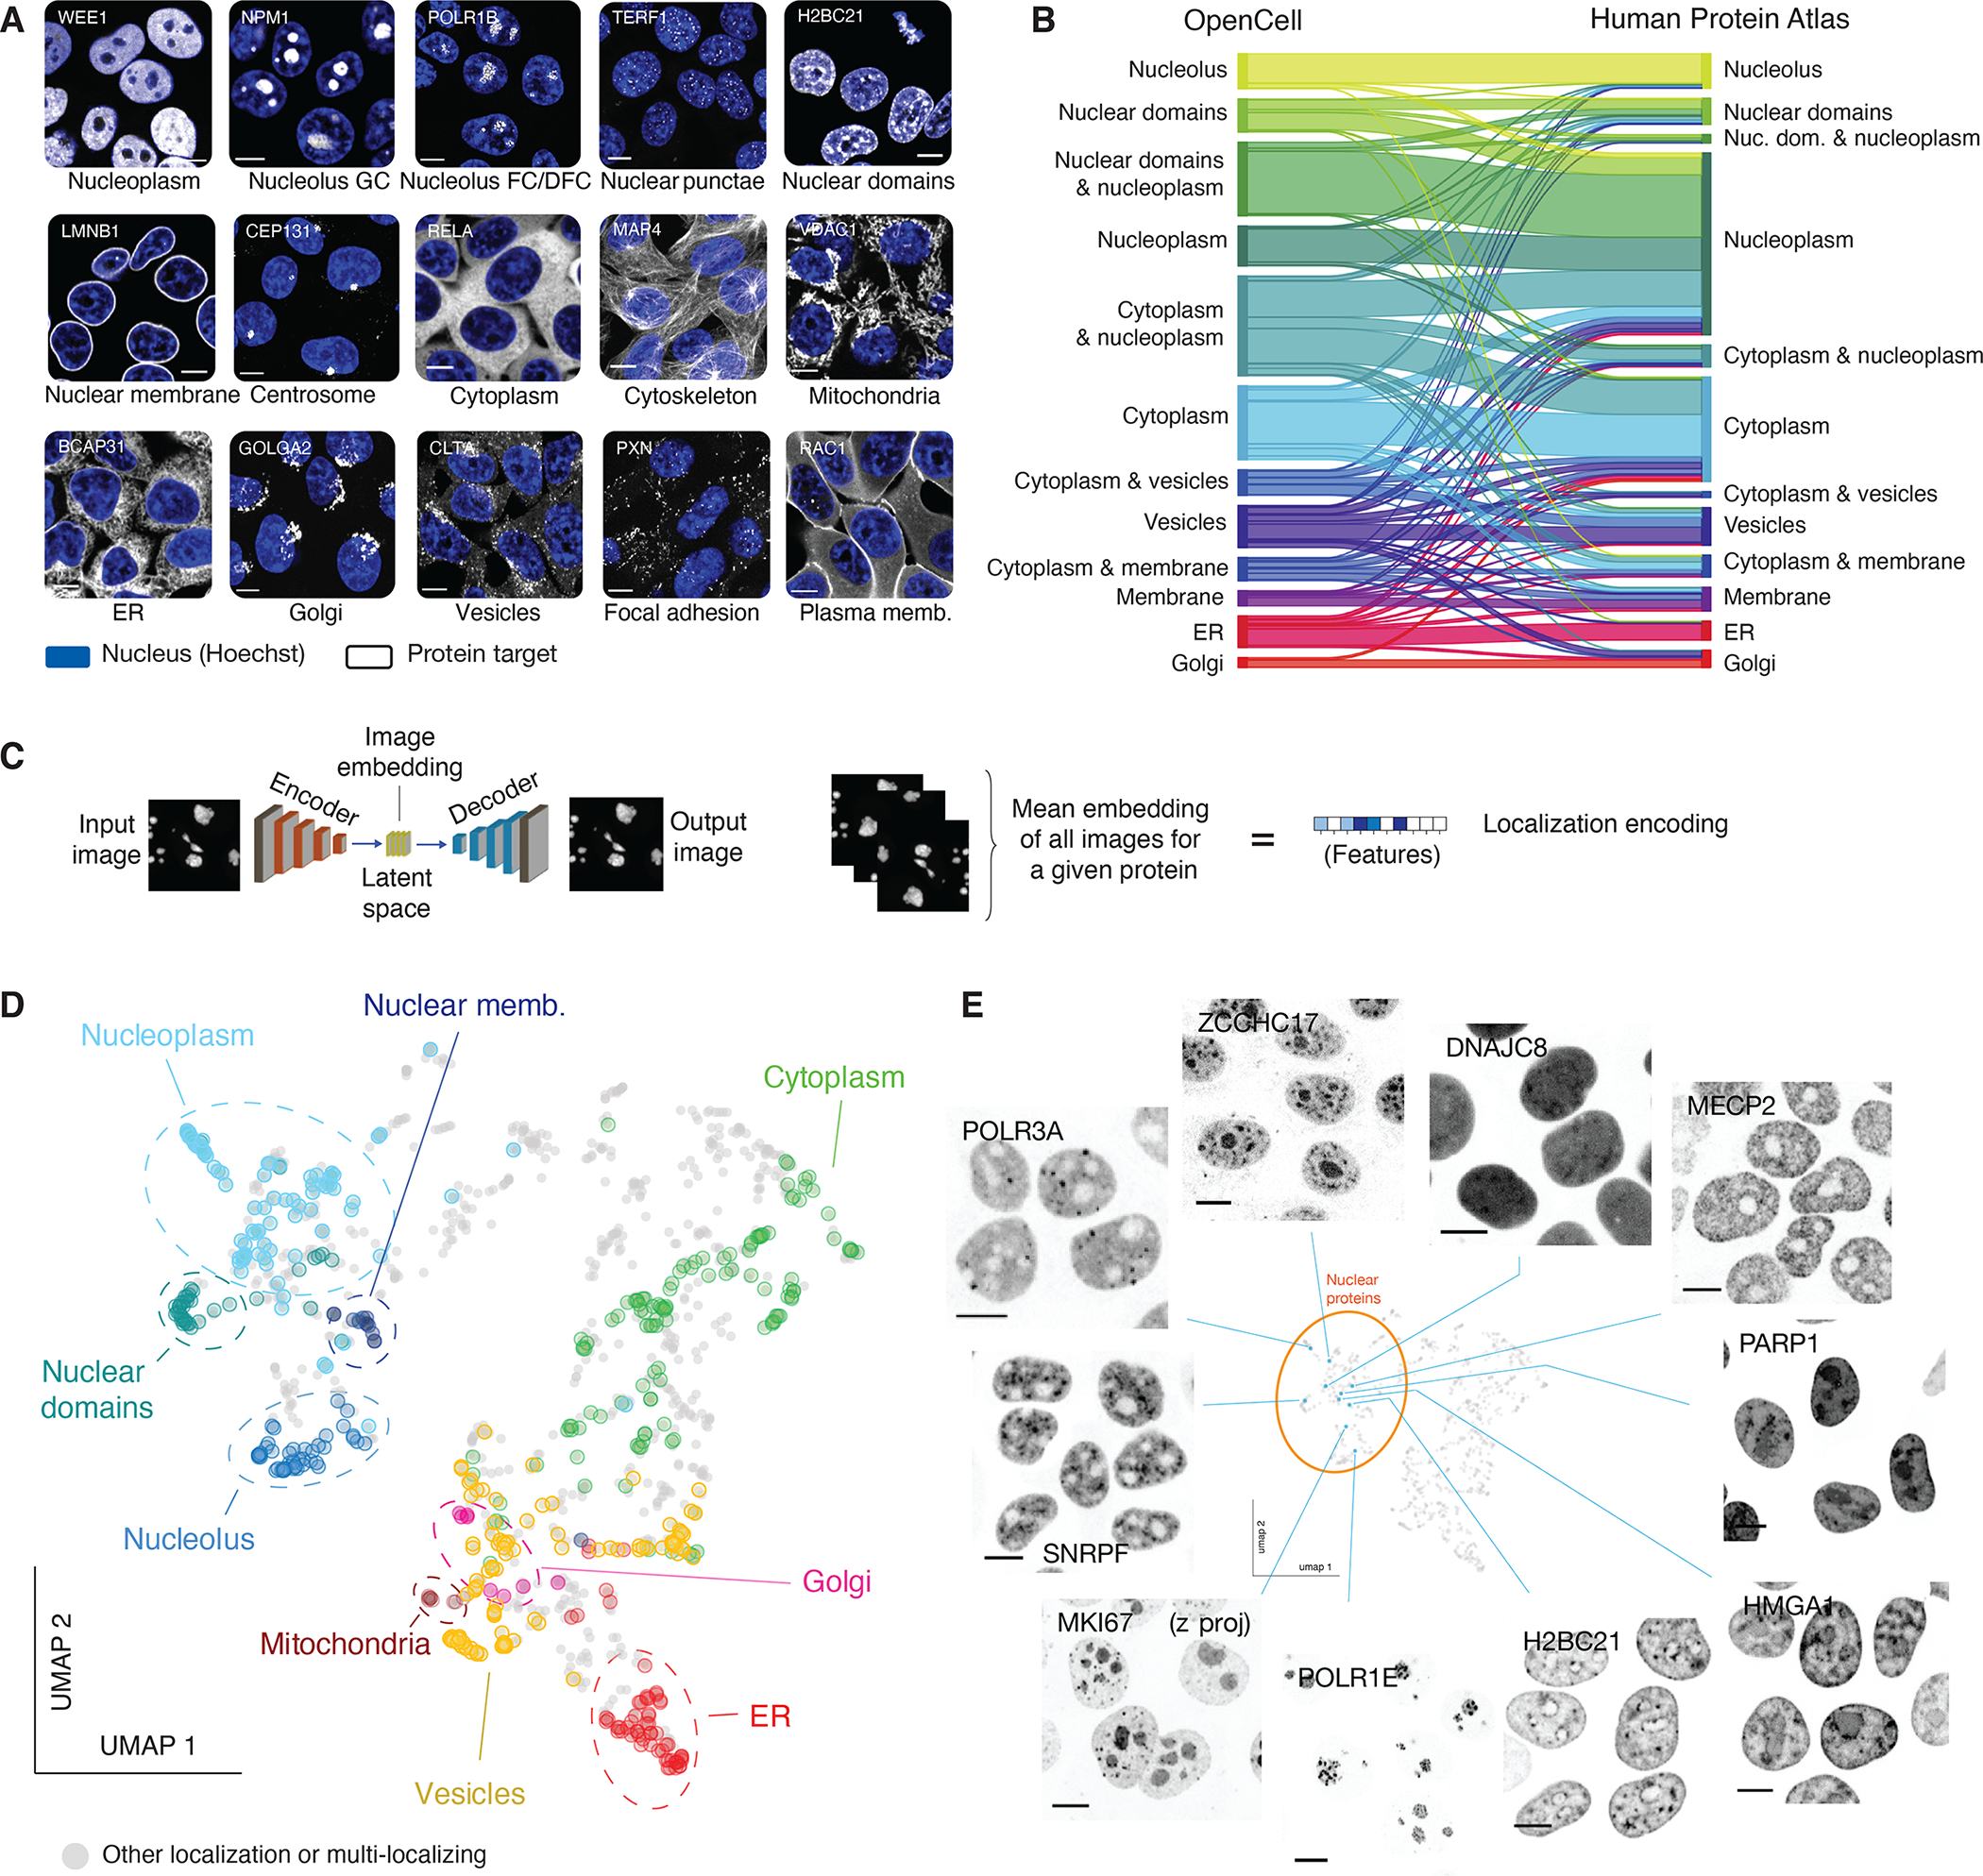
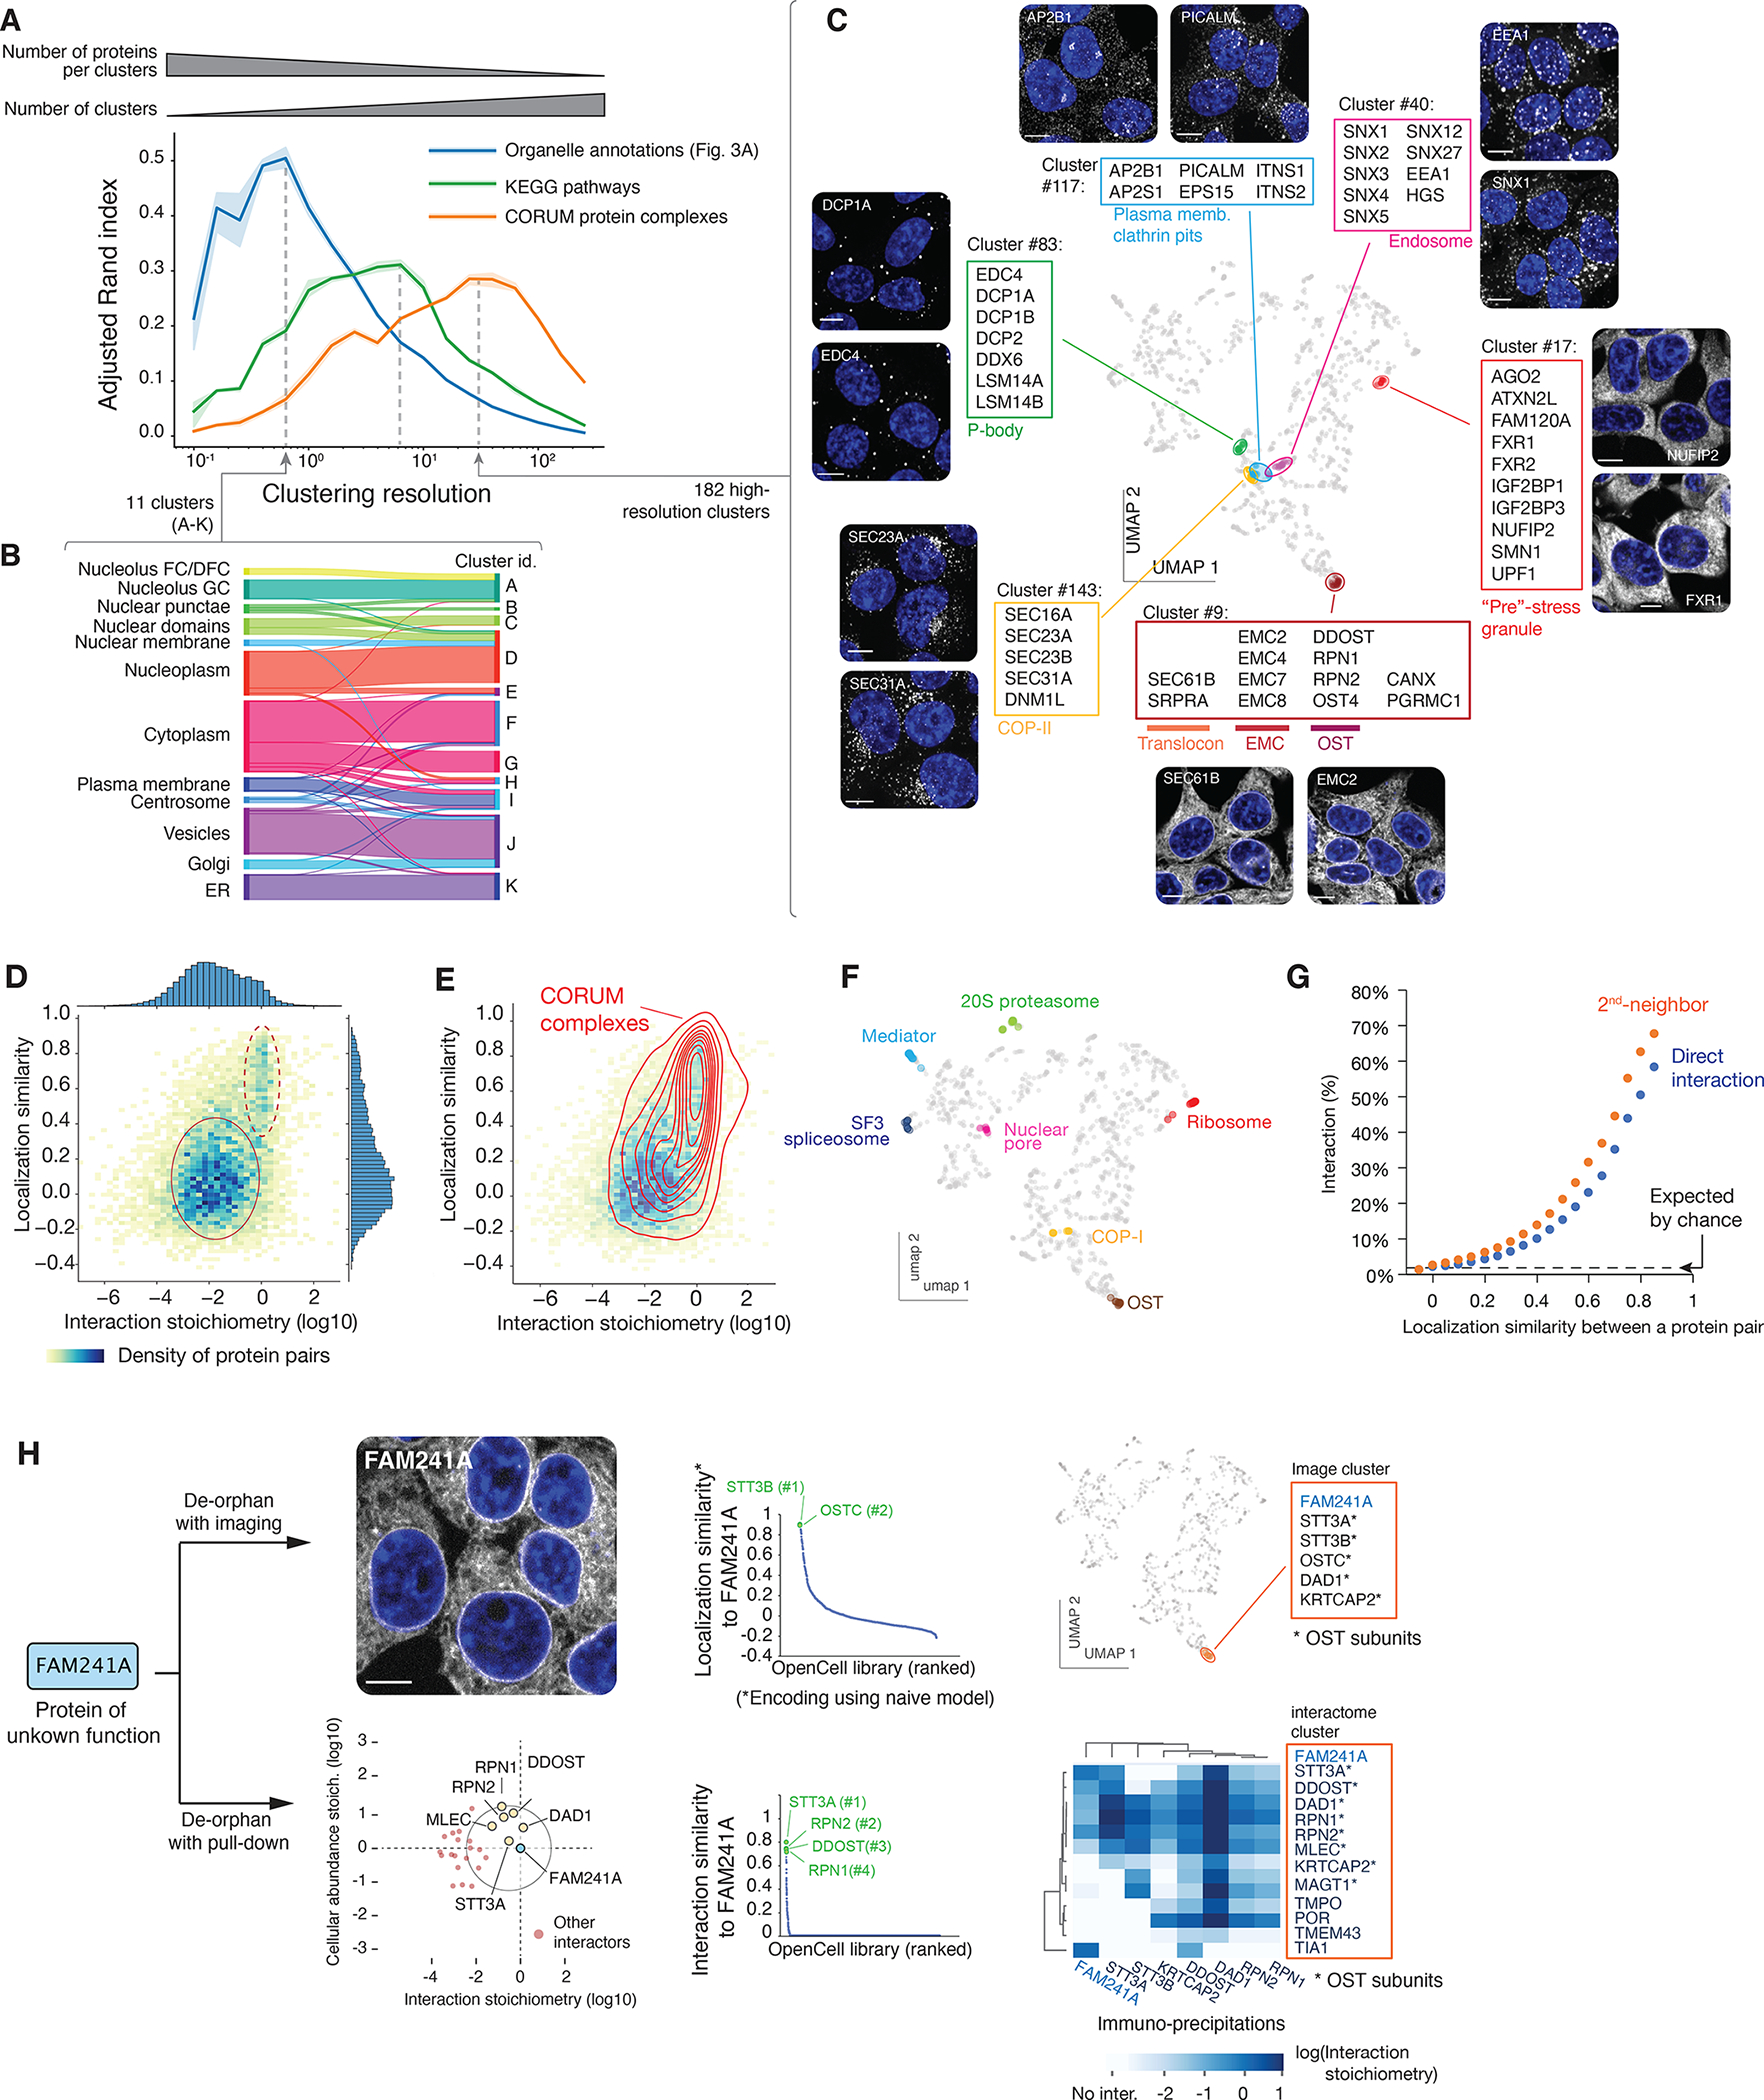
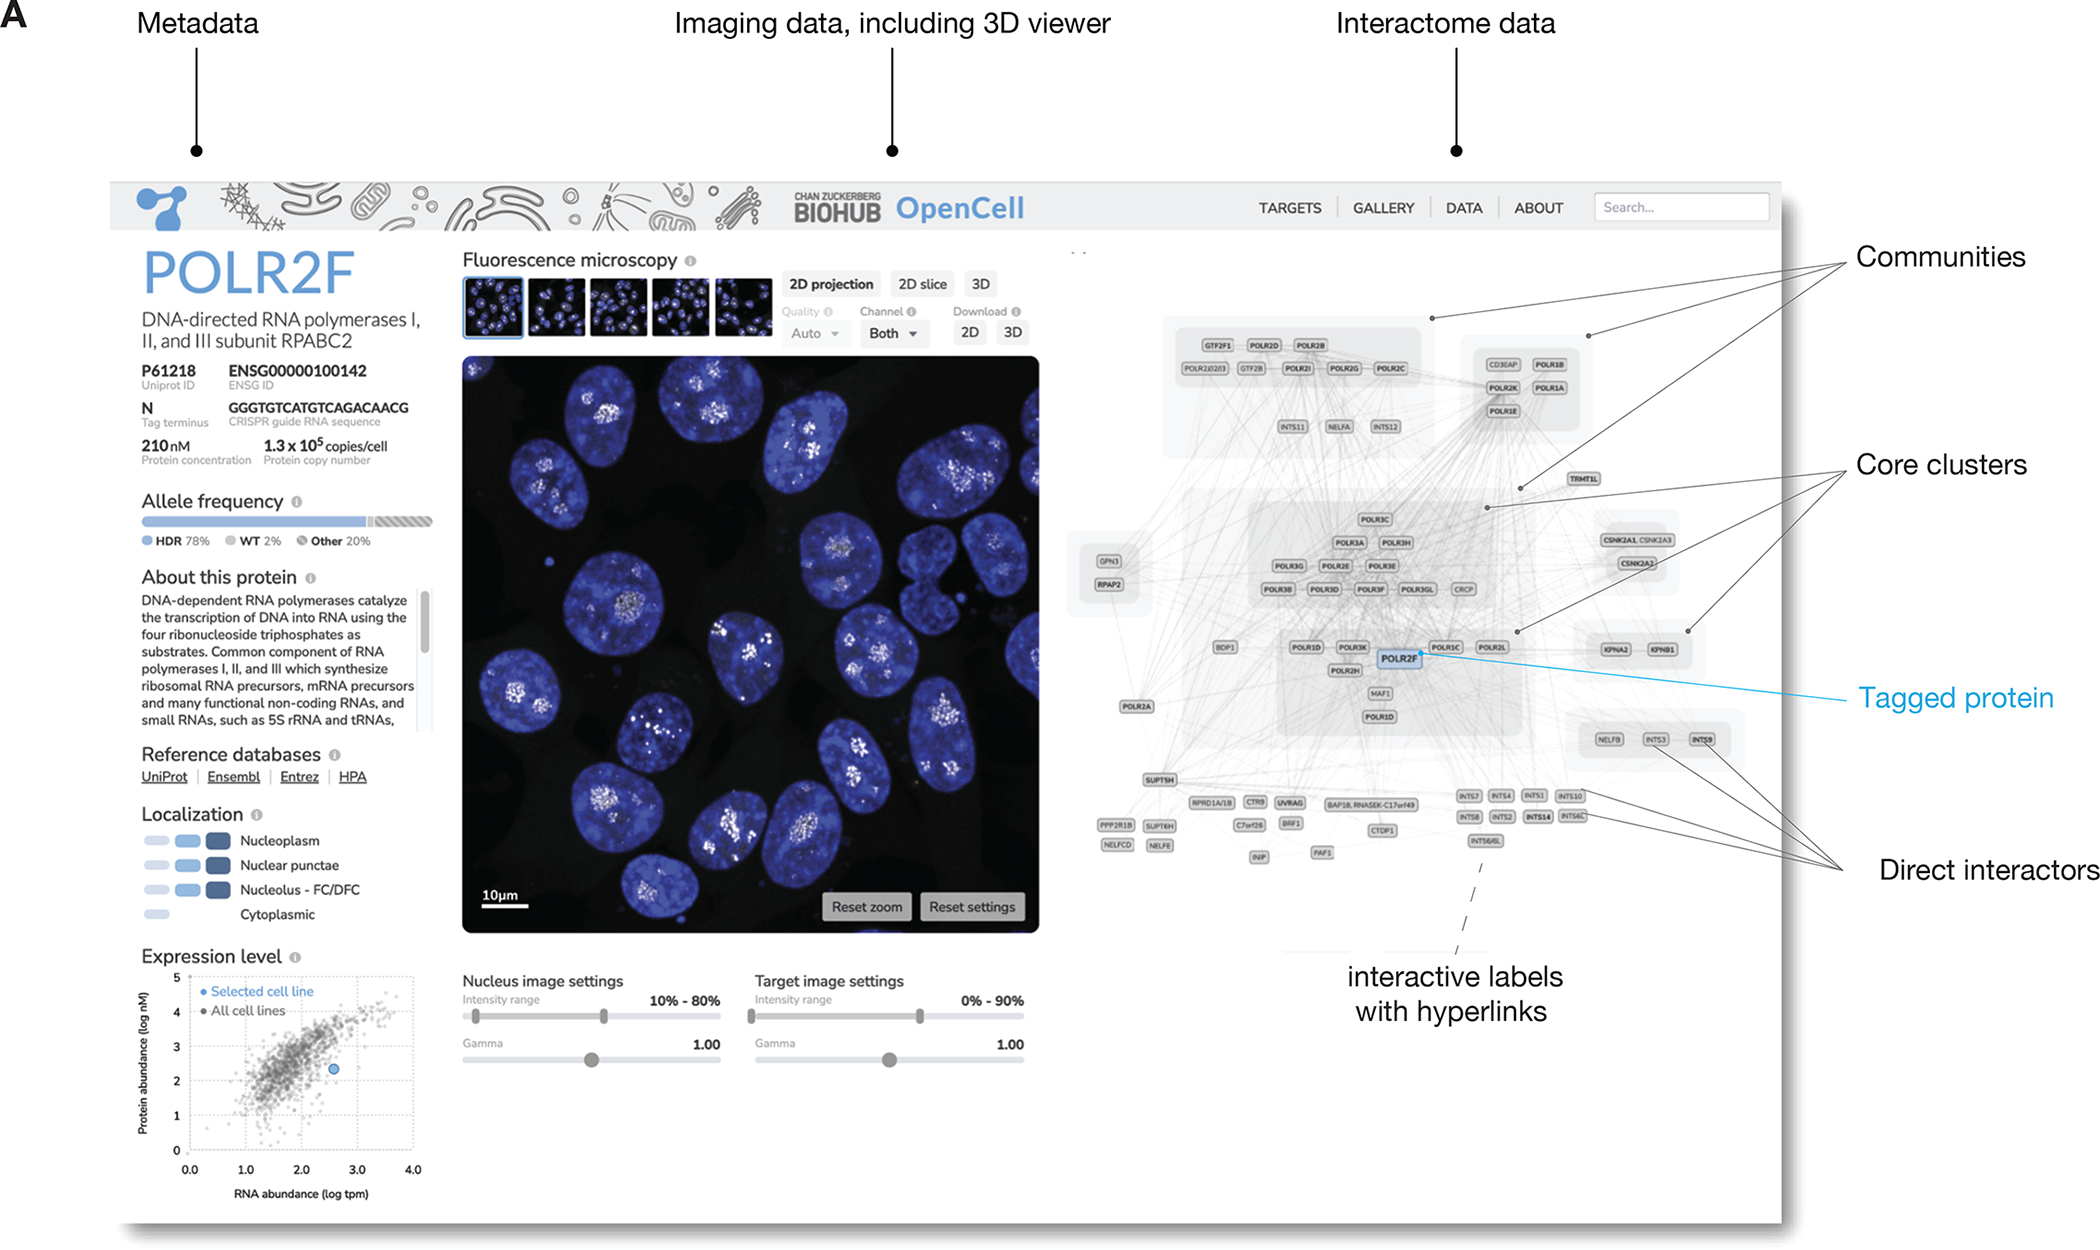
Elucidating the wiring diagram of the human cell is a central goal of the postgenomic era. We combined genome engineering, confocal live-cell imaging, mass spectrometry, and data science to systematically map the localization and interactions of human proteins. Our approach provides a data-driven description of the molecular and spatial networks that organize the proteome. Unsupervised clustering of these networks delineates functional communities that facilitate biological discovery. We found that remarkably precise functional information can be derived from protein localization patterns, which often contain enough information to identify molecular interactions, and that RNA binding proteins form a specific subgroup defined by unique interaction and localization properties. Paired with a fully interactive website (opencell.czbiohub.org), our work constitutes a resource for the quantitative cartography of human cellular organization.


Conflict of interest statement

Competing interests. J.S.W. declares outside interest in Chroma Therapeutics, KSQ Therapeutics, Maze Therapeutics, Amgen, Tessera Therapeutics and 5 AM Ventures. M. M. is an indirect shareholder in EvoSep Biosystems.

Figures

Figure 1:
Figure 1:. the OpenCell library.
(A) Functional tagging with split-mNeonGreen2. In this system, mNeonGreen2 is separated into two fragments: a short mNG11 fragment, which is fused to a protein of interest, and a large mNG21-10 fragment, which is expressed separately in trans (that is, tagging is done in cells that have been engineered to constitutively express mNG21-10). (B) Endogenous tagging strategy: mNG11 fusion sequences are inserted directly within genomic open reading frames (ORFs) using CRISPR-Cas9 gene editing and homologous recombination with single-stranded oligonucleotides donors (ssODN). (C) The OpenCell experimental pipeline. See text for details. (D) Successful detection of fluorescence in the OpenCell library. Out of 1757 genes that were originally targeted, fluorescent signal was successfully detected for 1310 (top panel). Low protein abundance is the main obstacle to successful detection. Bottom left panel shows the full distribution of abundance for all proteins expressed in HEK293T vs. successfully or unsuccessfully detected OpenCell targets; boxes represent 25th, 50th, and 75th percentiles, and whiskers represent 1.5x interquartile range. Median is indicated by a white line. P-value: Student’s t-test. (E) The OpenCell data analysis pipeline, described in subsequent sections.
Figure 2:
Figure 2:. Protein interactome.
(A) Overall description of the interactome. (B) Unsupervised Markov clustering of the interactome graph. (C) Example of community and core cluster definition for the translocon/EMC community. (D) The complete graph of connections between interactome communities. The density of protein-protein interactions between communities is represented by increased edge width. The numbers of targets included in each community is represented by circles of increasing diameters. (E) Distribution of occurrence in PubMed articles vs. RNA expression for all proteins found within interactome communities. The bottom 10th percentile of publication count (poorly characterized proteins) is highlighted. (F) NHSL1/NSHL2/KIAA1522 are part of the SCAR/WAVE community and share amino-acid sequence homology (right panel). (G) DMXL1/2, WDR7 and ROGDI form the human RAVE complex. Heatmaps represent the interaction stoichiometry of preys (lines) in the pull-downs of specific OpenCell targets (columns). See text for details.
Figure 3:
Figure 3:. live-cell image collection.
(A) The 15 cellular compartments segregated for annotating localization patterns. The localization of a representative protein belonging to each group is shown (greyscale, gene names in top left corners; scalebar: 10 μm). Nuclear stain (Hoechst) is shown in blue. “Nuclear domains” designate proteins with pronounced non-uniform nucleoplasmic localization, for example chromatin binding proteins. (B) Comparison of annotated localization for proteins included in both OpenCell and Human Protein Atlas datasets. In this flow diagram, colored bands represent groups of proteins that shared the same localization annotation in OpenCell, and the width of the band represents the number of proteins in each group. For readability, only the 12 most common localization groups are shown. Some multi-localization groups are included (e.g. “cytoplasm & nucleoplasm”). (C) Principle of localization encoding by self-supervised machine learning. See text for details. (D) UMAP representation of the OpenCell localization dataset, highlighting targets found to localize to a unique cellular compartment. (E) Representative images for 10 nuclear targets that exemplify the nuanced diversity of localization patterns across the proteome. Scale bars: 10 μm.
Figure 4:
Figure 4:. protein functional features derived from unsupervised image analysis.
(A) Comparison of image-based Leiden clusters with ground-truth annotations. The Adjusted Rand Index (ARI, (86)) of clusters relative to three ground-truth datasets is plotted as a function of the Leiden clustering resolution. ARI (a metric between 0 and 1, see Materials and Methods) measures how well the groups from a given partition (in our case, the groups of proteins delineated at different clustering resolutions) match groups defined in a reference set. The amplitude of the ARI curves is approximately equal to the number of pairs of elements that partition similarly between sets; the resolution at which each curve reaches its maximum corresponds to the resolution that best captures the information in each ground-truth dataset. At a low resolution, Leiden clustering delineates groups that recapitulate about half of the organellar localization annotations, while at increasing resolutions, clustering recapitulates about a third of pathways annotated in KEGG, or molecular protein complexes annotated in CORUM. Shaded regions show standard deviations calculated from 9 separate repeat rounds of clustering, and average values are shown as a solid line. (B) High correspondence between low-resolution image clusters and cellular organelles. (C) Examples of functional groups delineated by high-resolution image clusters, highlighted on the localization UMAP. (D) Heatmap distribution of localization similarity (defined as the Pearson correlation between two deep learning-derived encoding vectors) vs. interaction stoichiometry between all interacting pairs of OpenCell targets. Two discrete sub-groups are outlined: low stoichiometry/low localization similarity pairs (solid line) and high stoichiometry/high localization similarity pairs (dashed line). (E) Probability density distribution of CORUM interactions mapped on the graph from (D). Contours correspond to iso-proportions of density thresholds for each 10th percentile. (F) Localization patterns of different subunits from example stable protein complexes, represented on the localization UMAP. (G) Frequency of direct (1st-neighbor) or once-removed (2nd neighbor, having a direct interactor in common) protein-protein interactions between any two pairs of OpenCell targets sharing localization similarities above a given threshold (x-axis). (H) Parallel identification of FAM241A as a new OST subunit by imaging or mass-spectrometry. See text for details.
Figure 5:
Figure 5:. segregation of RNA-BPs in both interactome and imaging datasets.
(A) Hierarchical structure of the interactome dataset, see full description in Figure S9B. (B) Distribution of membrane-related (transmembrane or membrane-binding) and RNA-BPs within the three interactome branches. (C) Distribution of intrinsic disorder in the RNA-BP branch of the interactome hierarchy (related to Figure S10). Two separate scores are shown for completeness: IUPRED2 (87), and metapredict (88), a new aggregative disorder scoring algorithm. Boxes represent 25th, 50th, and 75th percentiles, and whiskers represent 1.5x inter-quartile range. Median is represented by a white line. ** p < 10–4 (Student’s t-test), exact p-values are shown. (D) Distribution of RNA-BP percentage across spatial clusters, comparing our data to a control in which the membership of proteins across clusters was randomized 1,000 times. Lines indicate parts of the distribution over-represented in our data vs control (**: p < 2×10⁻³, Fisher’s exact t-test). (E) Distribution of disorder score (IUPRED2) across spatial clusters, comparing our data to a control in which the membership of proteins across clusters was randomized 1,000 times. Lines indicate parts of the distribution over-represented in our data vs control (**: p < 2×10⁻³, Fisher’s exact t-test). (F) Ontology enrichment analysis of proteins contained in high-disorder spatial clusters (average disorder score > 0.45). Enrichment compares to the whole set of OpenCell targets (p-value: Fisher’s exact test). (G) Prevalence of proteins annotated to be involved in biomolecular condensation in high-disorder vs. other spatial clusters. Boxes represent 25th, 50th, and 75th percentiles, and whiskers represent 1.5x inter-quartile range. Median is represented by a white line. Note that for both distributions, the median is zero. (H) Distribution of high-disorder spatial clusters in the UMAP embedding from Fig. 3D. Individual nuclear clusters are not outlined for readability. Multiple high-disorder spatial clusters include compartments or proteins known to be characterized by biomolecular condensation behaviors, which are marked by an asterisk.
Figure 6:
Figure 6:. the OpenCell website.
Shown is an annotated screenshot from our web-app at http://opencell.czbiohub.org, which is described in more details in Suppl Fig. S12.

Comment in

  • The modular cell gets connected.
    Michnick SW, Levy ED. Michnick SW, et al. Science. 2022 Mar 11;375(6585):1093-1094. doi: 10.1126/science.abo2360. Epub 2022 Mar 10. Science. 2022. PMID: 35271323

Similar articles

  • Global organelle profiling reveals subcellular localization and remodeling at proteome scale.
    Hein MY, Peng D, Todorova V, McCarthy F, Kim K, Liu C, Savy L, Januel C, Baltazar-Nunez R, Sekhar M, Vaid S, Bax S, Vangipuram M, Burgess J, Njoya L, Wang E, Ivanov IE, Byrum JR, Pradeep S, Gonzalez CG, Aniseia Y, Creery JS, McMorrow AH, Sunshine S, Yeung-Levy S, DeFelice BC, Mehta SB, Itzhak DN, Elias JE, Leonetti MD. Hein MY, et al. Cell. 2025 Feb 20;188(4):1137-1155.e20. doi: 10.1016/j.cell.2024.11.028. Epub 2024 Dec 31. Cell. 2025. PMID: 39742809
  • Architecture of the human interactome defines protein communities and disease networks.
    Huttlin EL, Bruckner RJ, Paulo JA, Cannon JR, Ting L, Baltier K, Colby G, Gebreab F, Gygi MP, Parzen H, Szpyt J, Tam S, Zarraga G, Pontano-Vaites L, Swarup S, White AE, Schweppe DK, Rad R, Erickson BK, Obar RA, Guruharsha KG, Li K, Artavanis-Tsakonas S, Gygi SP, Harper JW. Huttlin EL, et al. Nature. 2017 May 25;545(7655):505-509. doi: 10.1038/nature22366. Epub 2017 May 17. Nature. 2017. PMID: 28514442 Free PMC article.
  • Dual proteome-scale networks reveal cell-specific remodeling of the human interactome.
    Huttlin EL, Bruckner RJ, Navarrete-Perea J, Cannon JR, Baltier K, Gebreab F, Gygi MP, Thornock A, Zarraga G, Tam S, Szpyt J, Gassaway BM, Panov A, Parzen H, Fu S, Golbazi A, Maenpaa E, Stricker K, Guha Thakurta S, Zhang T, Rad R, Pan J, Nusinow DP, Paulo JA, Schweppe DK, Vaites LP, Harper JW, Gygi SP. Huttlin EL, et al. Cell. 2021 May 27;184(11):3022-3040.e28. doi: 10.1016/j.cell.2021.04.011. Epub 2021 May 6. Cell. 2021. PMID: 33961781 Free PMC article.
  • Proteome-Scale Human Interactomics.
    Luck K, Sheynkman GM, Zhang I, Vidal M. Luck K, et al. Trends Biochem Sci. 2017 May;42(5):342-354. doi: 10.1016/j.tibs.2017.02.006. Epub 2017 Mar 8. Trends Biochem Sci. 2017. PMID: 28284537 Free PMC article. Review.
  • Identifying novel protein interactions: Proteomic methods, optimisation approaches and data analysis pipelines.
    Carneiro DG, Clarke T, Davies CC, Bailey D. Carneiro DG, et al. Methods. 2016 Feb 15;95:46-54. doi: 10.1016/j.ymeth.2015.08.022. Epub 2015 Aug 29. Methods. 2016. PMID: 26320829 Review.

Cited by

References

    1. Consortium IHGS, Finishing the euchromatic sequence of the human genome. Nature. 431, 931–945 (2004). - PubMed
    1. Hood L, Rowen L, The Human Genome Project: big science transforms biology and medicine. Genome Med. 5, 79 (2013). - PMC - PubMed
    1. Nurse P, Hayles J, The Cell in an Era of Systems Biology. Cell. 144, 850–854 (2011). - PubMed
    1. Mast FD, Ratushny AV, Aitchison JD, Systems cell biology. The Journal of Cell Biology. 206, 695–706 (2014). - PMC - PubMed
    1. Lundberg E, Borner GHH, Spatial proteomics: a powerful discovery tool for cell biology. Nature Reviews Molecular Cell Biology. 20, 285–302 (2019). - PubMed

Publication types