. 2022 Mar 11;375(6585):1182-1187.
doi: 10.1126/science.abl4430. Epub 2022 Mar 10.

Live cell tracking of macrophage efferocytosis during Drosophila embryo development in vivo

Affiliations

Live cell tracking of macrophage efferocytosis during Drosophila embryo development in vivo

Michael H Raymond et al. Science. .

Abstract

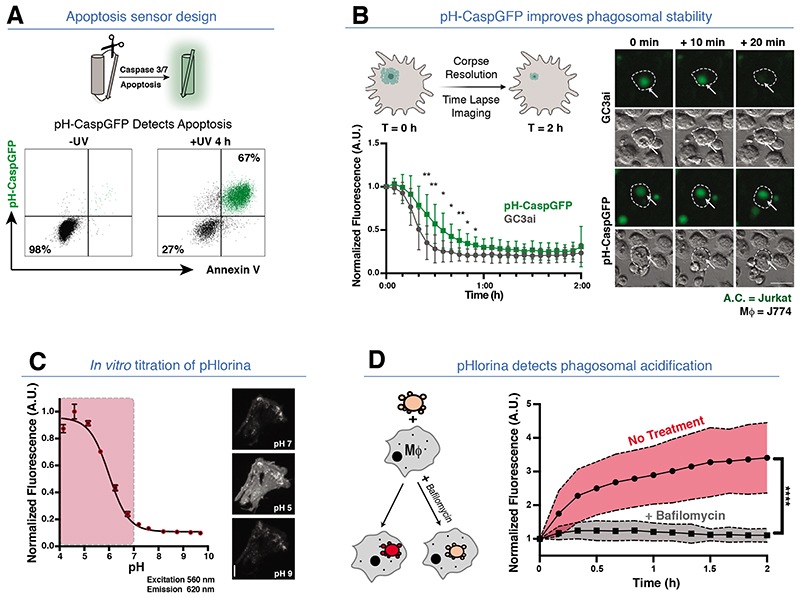
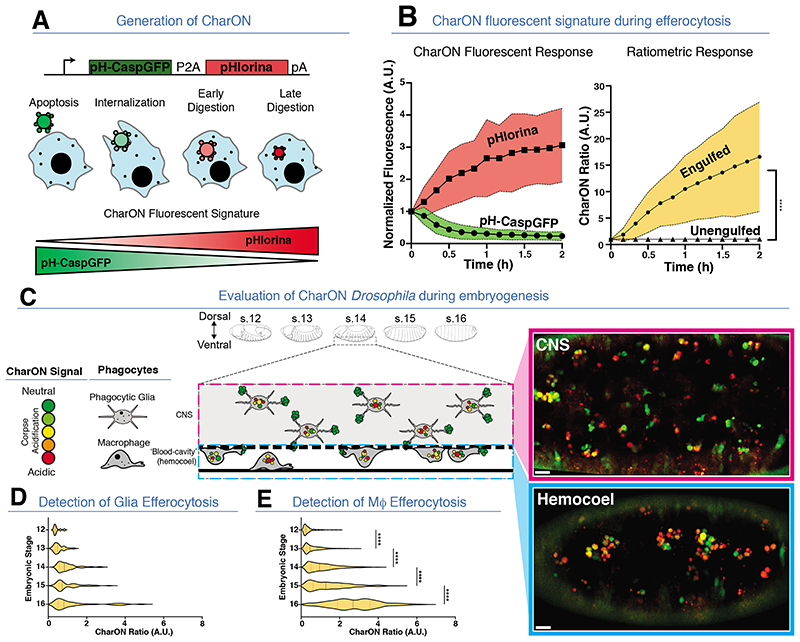
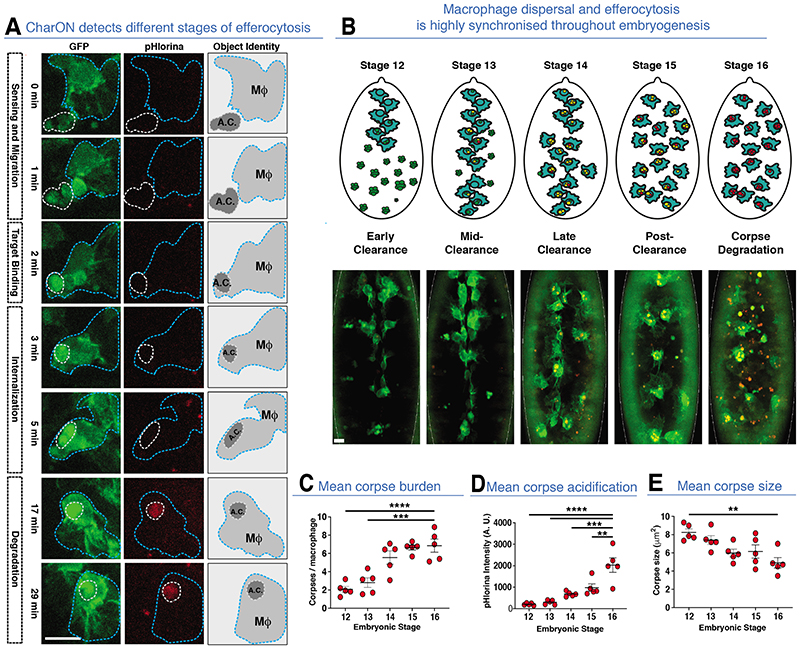
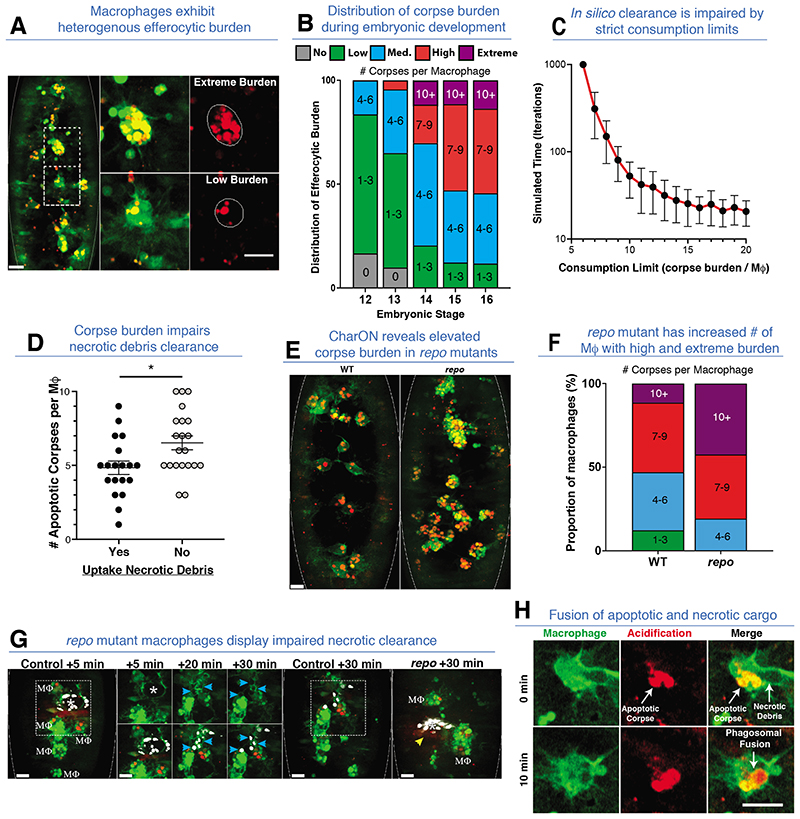
Apoptosis of cells and their subsequent removal through efferocytosis occurs in nearly all tissues during development, homeostasis, and disease. However, it has been difficult to track cell death and subsequent corpse removal in vivo. We developed a genetically encoded fluorescent reporter, CharON (Caspase and pH Activated Reporter, Fluorescence ON), that could track emerging apoptotic cells and their efferocytic clearance by phagocytes. Using Drosophila expressing CharON, we uncovered multiple qualitative and quantitative features of coordinated clearance of apoptotic corpses during embryonic development. When confronted with high rates of emerging apoptotic corpses, the macrophages displayed heterogeneity in engulfment behaviors, leading to some efferocytic macrophages carrying high corpse burden. Overburdened macrophages were compromised in clearing wound debris. These findings reveal known and unexpected features of apoptosis and macrophage efferocytosis in vivo.


Conflict of interest statement

Competing Interests

The authors declare no competing interests.

Figures

Fig. 1
Fig. 1. Engineering a pH-Stable apoptosis reporter and an RFP pH sensor.
(A) Apoptosis sensor design. (Top) Upon apoptosis, a Caspase-3/7 linker is cleaved, promoting GFP fluorescence. (Bottom) GFP/Annexin V positivity of pH-CaspGFP expressing Jurkat cells ± apoptosis (4 hours post UV-C). (B) pH-CaspGFP exhibits improved phagosomal stability. (Top left) Schematic of in vitro engulfment assay: GC3ai or pH-GC3ai apoptotic Jurkat cells were co-cultured with J774 macrophages. (Bottom left) Upon internalization, GFP fluorescence intensity was tracked. (Right) Time-Lapse images of (top) GC3ai or (bottom) pH-CaspGFP apoptotic Jurkat cells engulfed by J774 Macrophages (arrows). Three independent experiments, Two-Way ANOVA, ** =p<.0021, * =p<.0332. (C) In vitro validation of pHlorina. (Left) pH titration of purified pHlorina from pH 4-10. (excitation/emission =560 nm/620 nm). (Right) pHlorina fluorescence at pH 7.0, pH 5.0 and pH 9.0. Three independent experiments. (D) pHlorina detects phagosomal acidification during efferocytosis. (Left) Schematic of in vitro engulfment assay to track pHlorina fluorescence during efferocytosis ± bafilomycin (to inhibit phagosomal acidification). (Right) pHlorina signal in apoptotic Jurkat cells post-engulfment by J774 macrophages ± bafilomycin. Three independent experiments, Unpaired t-Test, **** = p<.0001. All scale bars =50 μm.
Fig. 2
Fig. 2. Caspase and pH Activated Reporter, Fluorescence ON (CharON) detects apoptosis and efferocytosis in vitro and in vivo.
(A) CharON design and rationale. (Top) CharON construct design. (Bottom) Fluorescence of an apoptotic CharON expressing cell (green/red) engulfed by a macrophage (blue). (B) CharON fluorescence during efferocytosis. (Left) CharON pH-CaspGFP and pHlorina fluorescence during engulfment. (Right) Ratiometric CharON (pHlorina/pH-CaspGFP) signal during engulfment. Three independent experiments, Two-Way ANOVA, Šidák’s multiple comparison test, **** =p<0.0001. (C) (Left) CharON activity during Drosophila embryogenesis. Embryo outlines highlight morphological changes during mid-late embryogenesis (stages 12-16) (36). Extensive apoptosis occurs within the developing CNS (dashed box), which is cleared by phagocytic glia (pink dashed box). The ventral-most corpses at the interface between the CNS and the underlying ‘blood-cavity’ (hemocoel) are cleared by the macrophages (blue dashed box). (Right) CharON visualises efferocytosis within (top) the CNS (pink box) and (bottom) the hemocoel of a stage 14 embryo. (D-E) Efferocytosis increases during CNS development. CharON ratio (pHlorina signal/pH-CaspGFP signal) of individual corpses within CNS (D) and hemocoel (E), during embryogenesis (stages 12-16). Five embryos/stage, One-Way ANOVA, **** =p<0.0001. All scale bars =10 μm.
Fig. 3
Fig. 3. CharON illuminates macrophage-mediated efferocytosis in vivo.
(A) CharON visualises the different stages of efferocytosis. A GFP-labelled macrophage (MΦ, blue dashed outline) engulfs a CharON-labelled apoptotic corpse (A.C., dashed outline) within the Drosophila embryo (stage 12). Apoptosis induces pH-CaspGFP (green) activation and macrophage (green) attraction, leading to target binding and uptake. Following internalisation, acidification/degradation of the corpse is detected through increasing pHlorina signal (red). (B) Efferocytosis increases during macrophage dispersal. (Top) Diagrams and (bottom) images highlighting the ventral dispersal of Drosophila macrophages (GFP, green) within the embryo (stages 12-16). During their stereotyped dispersal, macrophages clear CharON-labelled apoptotic corpses (green/red). The additional pHlorina-positive corpses are within unlabeled phagocytic glia deeper within the CNS. (C-E) Mean corpse number/macrophage (burden, C), pHlorina intensity/macrophage (acidification, D) and corpse area/macrophage (size, E) across stages 12-16 (embryo averages, 5 embryos/stage). One-Way ANOVA, ** =p<0.0021, *** =p<0.0002, **** =p<0.0001, error bars =S.E.M. All scale bar =10 μm.
Fig. 4
Fig. 4. Macrophage efferocytic heterogeneity.
(A) Macrophages exhibit variable corpse burden. (Left) A stage 16 embryo with GFP-labelled macrophages (green) and CharON-labelled apoptotic corpses (green/red). Two adjacent macrophages with contrasting corpse burdens are highlighted (dashed-boxes), magnified and outlined (middle and right). (B) Percentage of macrophages with indicated corpse burdens during embryogenesis (stages 12-16, 5 embryos/stage). (C) In silico clearance time is exponentially increased when equal sharing of corpses is enforced through consumption limits. Simulations run until clearance was completed or 1,000 iterations max and repeated 50x to yield standard deviations (error bars). (D) Macrophages with higher developmental apoptotic corpse burdens are significantly less likely to engulf necrotic debris at wounds (unpaired t-test, * =p<0.0332, 5 wounded embryos, error bars =S.E.M.). (E-F) Macrophages in repo mutants have elevated corpse burdens. (E) Wild-type (WT) and repo mutant stage 15 embryos (outlined) expressing CharON (green/red) and macrophage-specific GFP (green). (F) Percentage of macrophages with indicated corpse burdens in wild-type (WT) or repo mutant embryos (stage 15, 5 embryos/genotype). (G) repo mutant macrophages display impaired necrotic debris clearance. A necrotic stain (DRAQ7, white) was injected into control or repo mutant embryos (stage 15) expressing CharON (green/red) and macrophage (MΦ) specific GFP (green). Following laser-wounding (*), control macrophages cleared necrotic debris within 30 mins (blue arrows). In contrast, repo macrophages with extreme corpse burden failed to clear necrotic debris (yellow arrow). (H) Fusion of phagosomes containing apoptotic and necrotic cargo. A GFP-labelled macrophage (green) containing CharON-labelled apoptotic corpses (green/red) engulfs necrotic debris at a wound. Acidification of necrotic corpse was detected via pHlorina, occurring rapidly after interaction with an acidified apoptotic corpse. All scale bars =10 μm.

Publication types

LinkOut - more resources