. 2022 Mar 15;119(11):e2118285119.
doi: 10.1073/pnas.2118285119. Epub 2022 Mar 10.

A coherent FOXO3-SNAI2 feed-forward loop in autophagy

Affiliations

A coherent FOXO3-SNAI2 feed-forward loop in autophagy

Xiaowei Guo et al. Proc Natl Acad Sci U S A. .

Abstract

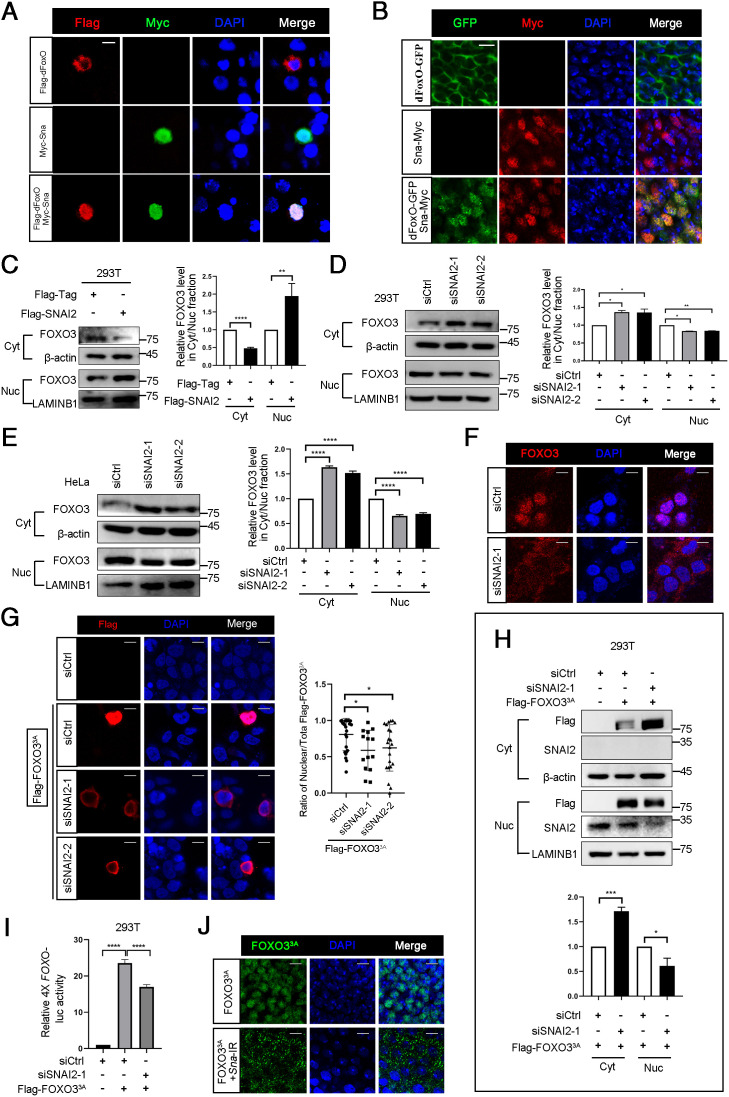
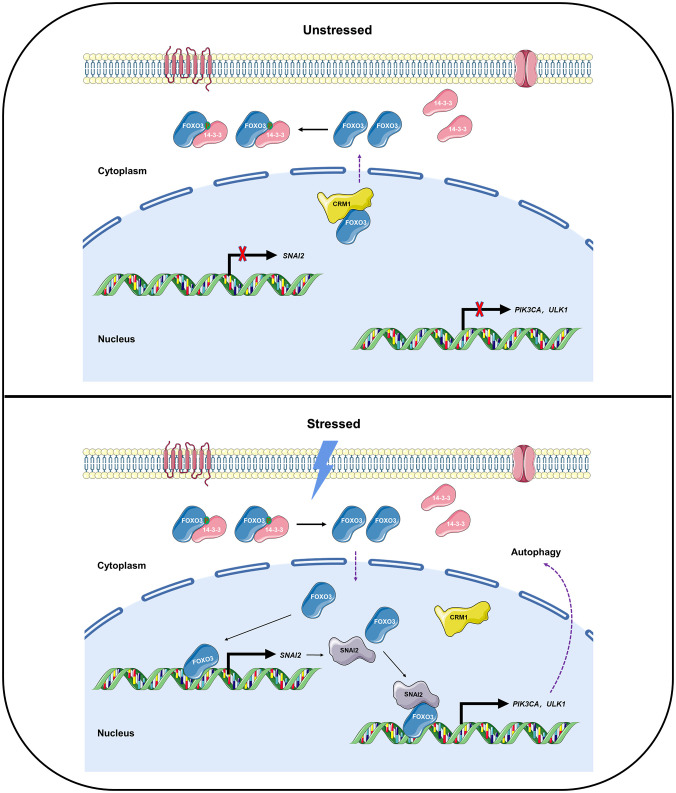
SignificanceUnderstanding autophagy regulation is instrumental in developing therapeutic interventions for autophagy-associated disease. Here, we identified SNAI2 as a regulator of autophagy from a genome-wide screen in HeLa cells. Upon energy stress, SNAI2 is transcriptionally activated by FOXO3 and interacts with FOXO3 to form a feed-forward regulatory loop to reinforce the expression of autophagy genes. Of note, SNAI2-increased FOXO3-DNA binding abrogates CRM1-dependent FOXO3 nuclear export, illuminating a pivotal role of DNA in the nuclear retention of nucleocytoplasmic shuttling proteins. Moreover, a dFoxO-Snail feed-forward loop regulates both autophagy and cell size in Drosophila, suggesting this evolutionarily conserved regulatory loop is engaged in more physiological activities.

Keywords: Drosophila; FOXO3; SNAI2; dFoxO; snail.


Conflict of interest statement

The authors declare no competing interest.

Figures

Fig. 1.
Fig. 1.
SNAI2 is identified as a positive regulator of autophagy. (A) Heatmap of statistically differential gene expression between dissect control, Torin1-A, Torin1-B treatment, or SF starvation HeLa cells, respectively. Columns in green indicate decreased genes, whereas columns in red demonstrate increased genes. A, 1 μM; B, 250 nM. (B) A Venn diagram shows overlapping up-regulated genes between 1-μM and 250-nM Torin1 treatment, compared with control. (C) RT-qPCR analysis of SNAI2 mRNA level. HeLa cells were treated with DMSO as negative control and 250 nM or 1 μM Torin1 for 4h. (D) Immunoblot analysis of SNAI2 protein level and LC3-II/LC3-I in HeLa cells treated by DMSO or 250nM Torin1 for 4 h. (E) Immunoblot analysis of SNAI2 protein level and LC3-II/LC3-I in 293T cells treated with or without 1 μM rapamycin for 4 h. (F) Immunoblot analysis of 250nM Torin1-induced autophagy in HeLa cells treated by nonspecific siRNA (siCtrl) or two independent siRNA targeting SNAI2 (referred to as siSNAI2-1 and siSNAI2-2). Cells were treated by 20 μM CQ for 24 h to inhibit lysosome activity. (G) Immunoblot analysis of rapamycin-induced autophagy in 293T cells treated by siCtrl or siSNAI2-1. 293T cells were treated by 1 μM Rapamycin for 4 h. (H) Immunoblot analysis of rapamycin-induced autophagy in 293T cells in the absence or presence of transiently transfected Flag-SNAI2 for 48 h. 293T cells were treated by 1 μM rapamycin for 2.5 h before harvest. DMSO acts as negative control for Torin 1 or rapamycin treatment in 293T or HeLa cells. ****P < 0.0001, ***P < 0.001, **P < 0.01, *P < 0.05. ns, no significant difference.
Fig. 2.
Fig. 2.
SNAI2 interacts with and promotes FOXO3-mediated autophagy. (A and B) Immunoblot analysis of FOXO3 in input (also termed as whole-cell lysate, WCL) and anti-Flag immunoprecipitates. The plasmids encoding Flag-SNAI1, Flag-SNAI2, and Flag-SNAI3 were transiently transfected into 293T or HeLa cells for 48 h. (C) Immunoblot analysis of LC3-II/LC3-I in the ectopically expressed Flag-FOXO3 with or without HA-SNAI2 coexpression in 293T cells. (D) Immunofluorescence analysis of LC3 in HeLa cells overexpressing Flag-FOXO3 or Flag-FOXO3A coupled with or without HA-SNAI2 overexpression. (Scale bar, 10 μm.) (E and F) Immunoblot analysis of LC3-II/LC3-I in 293T cells that ectopically expressed Flag-FOXO3 or Flag-FOXO3A with or without SNAI2 knockdown. (G and H) Empty control vector, Flag-FOXO3 or Flag-FOXO33A were transfected into siSNAI2 untreated or treated HeLa cells and immunoblot analysis of LC3-II/LC3-I was performed. (I) Immunofluorescence analysis of LC3 in HeLa cells overexpressing Flag-FOXO3 or Flag-FOXO3A with or without SNAI2 knockdown. (Scale bar, 10 μm.) ****P < 0.0001, ***P < 0.001, **P < 0.01, *P < 0.05.
Fig. 3.
Fig. 3.
SNAI2/FOXO3 synergistically activate transcription of autophagy genes. (A) RT-qPCR analysis of FOXO3 target genes related to autophagy. Flag-FOXO3 was transfected into 293T cells with or without coexpression of Flag-SNAI2 for 48 h. (B) ULK1 and PIK3CA mRNA level were judged by RT-qPCR analysis. Flag-FOXO33A was transfected into 293T cells with or without Flag-SNAI2. (C) Schematic view of PIK3CA promoter with three FOXO3 binding sites indicated as red bar. Four fragments were shown as amplicons. (D) Relative DNA enrichment in ChIP experiments. (E) Structure of the ULK1 locus. The third intron of ULK1 contains two FOXO3 binding sites indicated as red bar. A and B indicate amplicons used for ChIP. (F) ChIP-qPCR analysis of amplicon-A/B in Flag-IP reactions. (G) Relative DNA enrichment in ChIP experiments was determined by qPCR. (H and I) Analysis of FOXO-luc activity by SNAI2 with or without FOXO33A coexpression in HeLa and 293T cells. ****P < 0.0001, ***P < 0.001, **P < 0.01, *P < 0.05. ns, no difference.
Fig. 4.
Fig. 4.
Sna conservatively promotes autophagy in Drosophila. (A–N) Fluorescence micrographs of Drosophila wing imaginal discs are shown. Lysotracker staining or Atg8a-pmCherry puncta accumulation was performed as autophagy markers. (Scale bar, 20 μm.) (O) A schematic drawing summarizing the binding activities of all Sna and dFoxO fragments. In the right panel, symbols “+” and “−” indicate strong binding or weak binding/no binding, respectively. (P) Immunoblot analysis of Flag-dFoxO and Myc-Sna in input and anti-Flag or anti-Myc immunoprecipitates. Plasmids encoding Flag-dFoxO and Myc-Sna were transiently cotransfected into S2 cells for 48 h before harvest. (Q) Immunoblot analysis of interaction between full-length dFoxO with SnaC but not SnaN. (R) Flag-dFoxOA and Flag-dFoxOB but not Flag-dFoxOC interacts with Myc-SnaC. (S) Flag-dFoxOA+B but not Flag-dFoxOD interacts with Myc-SnaC. (T) Immunoblot analysis of Myc-SnaC in input and anti-Flag immunoprecipitates. Myc-SnaC interacts with Flag-dFoxOE.
Fig. 5.
Fig. 5.
Snail/SNAI2 conservatively promotes nuclear accumulation of dFoxO/FOXO3 from Drosophila to human. (A) Immunofluorescence analysis of Flag-dFoxO cellular localization in S2 cells with or without Myc-Sna overexpression. (Scale bar, 5 μm.) (B) Fluorescence micrographs of Drosophila eye imaginal discs showing subcellular localization of dFoxO-GFP and Sna-Myc. Areas posterior to the morphogenetic furrow are shown. (Scale bar, 5 μm.) (C) Nucleocytoplasmic separation analysis of cellular localization of endogenous FOXO3 in 293T cells transfected by Flag-SNAI2 for 48 h. Cyt, cytoplasm; Nuc, nucleus. (D) Nucleocytoplasmic separation analysis of cellular localization of endogenous FOXO3 in SNAI2 knockdown 293T cells. (E) Cellular localization of endogenous FOXO3 was determined by Nucleocytoplasmic separation analysis in SNAI2 knockdown HeLa cells. (F) Immunofluorescence analysis of FOXO3 cellular localization in SNAI2 knockdown HeLa cells. (Scale bar, 10 μm.) (G) SNAI2 was silenced by siRNA for 24 h and then Flag-FOXO33A was transiently transfected into HeLa cells for another 48 h. Immunofluorescence analysis of Flag-FOXO33A cellular localization change was performed. (Scale bar, 10 μm.) (H) Cellular localization of Flag-FOXO33A in 293T cells was measured by nucleocytoplasmic separation analysis. Flag-FOXO33A was transfected into 293T cells with SNAI2 knockdown by siRNA for 48 h. (I) Relative 4X FOXO-luc activity as measured by Double Luciferase Assay in Flag-FOXO33A overexpressing 293T cells with or without SNAI2 depletion. (J) Immunofluorescence analysis of FOXO33A cellular localization in the presence or absence of Sna in Drosophila eye imaginal discs are shown. (Scale bar, 5 μm.) Areas posterior to the morphogenetic furrow are shown. ****P < 0.0001, ***P < 0.001, **P < 0.01, *P < 0.05.
Fig. 6.
Fig. 6.
SNAI2 impedes FOXO3-CRM1 interaction via enhancing FOXO3-DNA binding. (A–C) Co-IP analysis of CRM1-FOXO3 interaction with or without coexpression of SNAI2 in 293T or HeLa cells. (D) Analysis of DNase I treatment on SNAI2-reduced interaction between CRM1 and FOXO3 in 293T cells. (E and F) Effects of exogenous FOXO-luc vector or synthetic DNA fragment containing 4X FOXO3 responsive element sequence (FOXO-RES) on CRM1–FOXO3 interaction in 293T or HeLa cells. Ctrl-luc vector or Ctrl-RES fragment without FOXO target sequence serves as the negative control for FOXO-luc or FOXO-RES, respectively. Ctr-RES: 5′-GGGGGGCTATAAAAGGGGGTGGGGGCGTTCGTCCTCACTCT-3′; FOXO-RES: 5′-CTCGATGATCAAGTAAACAACTATGTAAACAAGATCAAGTAAACAACTATGTAAACAAGCGCG-3′.
Fig. 7.
Fig. 7.
FOXO3 mediates energy stress-induced SNAI2 up-regulation. (A) RT-qPCR analysis of SNAI2 mRNA level. FOXO3 knockdown or control HeLa cells were subject to 0.25-μM Torin1 treatment for 4 h. (B) Immunoblot analysis of SNAI2 protein level in FOXO3 knockdown or control HeLa cells with or without 0.25-μM Torin1 treatment for 4 h. (C) RT-qPCR analysis of SNAI2 mRNA level in HeLa and 293T cells with or without Flag-FOXO33A expression. (D) Immunoblot analysis of SNAI2 protein level. Control or Flag-FOXO33A was transfected into 293T or HeLa cells for 48 h. (E) Schematic view of SNAI2 promoter. The red bar represents presumptive FOXO3 binding sites, the green fragment shows the ChIP assay target regions. E1 and E2 (deleting core sequence) were fragments used to drive luciferase reporters in Double Luciferase Assay. (F) Relative luciferase activity driven by E1 or E2 in the absence or presence of FOXO33A. (G) Relative DNA enrichment in ChIP experiments was determined by qPCR. (H) RT-qPCR analysis of SNAI2 mRNA level in response to normal or SF medium for 4 h. (I) Immunoblot analysis of SNAI2 protein level in FOXO3 knockdown or control HeLa cells with or without SF medium treatment for 4 h. (J) RT-qPCR analysis of sna mRNA in ptc > dFoxO or FOXO33A fly wing imaginal discs. ****P < 0.0001, ***P < 0.001, **P < 0.01, *P < 0.05.
Fig. 8.
Fig. 8.
Model for a conserved FOXO3-SNAI2 feed-forward loop in autophagy. Under normal conditions (unstressed), CRM1-dependent nuclear exported-FOXO3 is phosphorylated and then sequestered in cytoplasm via interaction with 14-3-3. Upon energy stress conditions like starvation (Stressed), dephosphorylated FOXO3 translocates into nucleus and activates SNAI2 transcription. Then SNAI2 interacts with and enhances FOXO3 binding affinity to response elements in autophagy-related genes like PIK3CA and ULK1 for autophagy induction. More notably, the mechanism underlying SNAI2-decreased FOXO3 nuclear export lies in increased FOXO3-DNA binding in the nucleus. Hence, we propose the model of a coherent FOXO3-SNAI2 feed-forward loop in autophagy, which is conserved from Drosophila to human.

Similar articles

Cited by

References

    1. Mizushima N., Autophagy: Process and function. Genes Dev. 21, 2861–2873 (2007). - PubMed
    1. Klionsky D. J., Autophagy: From phenomenology to molecular understanding in less than a decade. Nat. Rev. Mol. Cell Biol. 8, 931–937 (2007). - PubMed
    1. López-Otín C., Kroemer G., Hallmarks of health. Cell 184, 33–63 (2021). - PubMed
    1. Klionsky D. J., et al. , Guidelines for the use and interpretation of assays for monitoring autophagy (3rd edition). Autophagy 12, 1–222 (2016). - PMC - PubMed
    1. Levine B., Kroemer G., Biological functions of autophagy genes: A disease perspective. Cell 176, 11–42 (2019). - PMC - PubMed

MeSH terms

LinkOut - more resources