. 2022 Apr 22;7(8):e156048.
doi: 10.1172/jci.insight.156048.

Heterogeneity and clonality of kidney-infiltrating T cells in murine lupus nephritis

Affiliations

Heterogeneity and clonality of kidney-infiltrating T cells in murine lupus nephritis

Shuchi Smita et al. JCI Insight. .

Abstract

We previously found that kidney-infiltrating T cells (KITs) in murine lupus nephritis (LN) resembled dysfunctional T cells that infiltrate tumors. This unexpected finding raised the question of how to reconcile the "exhausted" phenotype of KITs with ongoing tissue destruction in LN. To address this, we performed single-cell RNA-Seq and TCR-Seq of KITs in murine lupus models. We found that CD8+ KITs existed first in a transitional state, before clonally expanding and evolving toward exhaustion. On the other hand, CD4+ KITs did not fit into current differentiation paradigms but included both hypoxic and cytotoxic subsets with a pervasive exhaustion signature. Thus, autoimmune nephritis is unlike acute pathogen immunity; rather, the kidney microenvironment suppresses T cells by progressively inducing exhausted states. Our findings suggest that LN, a chronic condition, results from slow evolution of damage caused by dysfunctional T cells and their precursors on the way to exhaustion. These findings have implications for both autoimmunity and tumor immunology.

Keywords: Autoimmune diseases; Autoimmunity; Immunology; T cells.


Conflict of interest statement

Conflict of interest: The authors have declared that no conflict of interest exists.

Figures

Figure 1
Figure 1. Low-resolution clustering of T cells from lupus-prone mice.
(A) Schematic of experimental design encompassing tissue source, sorting algorithm, marking with HTOs, number of mice used in each experimental cohort, and a description of downstream analytic techniques. (B) UMAP of T cells from mice in Main-Seq, outlining 14 clusters. (C) HTO-based assignment of cell source was mapped onto the UMAP. MRL/lpr, MRL.Faslpr; B6, C57BL/6; UMAP, uniform manifold approximation and projection; TF, transcription factor.
Figure 2
Figure 2. High-resolution clustering of CD4+ T cells uncovers unique transcriptional programs in KITs.
(A) UMAP of CD4+ T cells from Main-Seq outlining 13 clusters, with the right panel exhibiting assignment of cell source as determined by HTO. (BD) Gene set enrichment analysis (GSEA) performed in each cell by Wilcoxon’s test (–log10 [P value]) using published reference gene signatures (Supplemental Table 1) and related TF expression were overlaid onto the UMAP to identify CD4 phenotypes. This included (B) Treg gene signature and Foxp3 expression, (C) Th1 signature and Tbx21/Tbet expression, and (D) Th2 signature and Gata3 expression.
Figure 3
Figure 3. TF analysis suggests overarching transcriptional regulation of infiltrating CD4+ T cell clusters.
(A) Heatmap representing z-scored regulon activity of top TFs inferred by SCENIC and association with CD4+ T cell clusters. (B) Expression of selected TFs overlaid onto the CD4 UMAP as depicted in Figure 2.
Figure 4
Figure 4. CD4+ KITs exhibit a progressive transcriptional phenotype from cytotoxicity to hypoxia/dysfunction through pseudotime.
GSEA performed in each cell by Wilcoxon’s test (–log10 [P value]) using published reference genes signature (Supplemental Table 1) overlaid onto the UMAP from Figure 2A. (A) Hypoxia signature, exhaustion signature, and cytotoxic CD4 signature. (B) Dot plots show the distribution of exhaustion score in each CD4+ T cell, grouped by cluster number. Dots are colored according to the source of cells they represent. Statistics were calculated by Kruskal-Wallis rank test. (C) Monocle trajectory mapping of CD4+ KITs wherein time 0 (dark purple) represents lineage origination with progression to most differentiated (yellow), with cell source mapping. (D) Gene signature mapping for the indicated signatures as defined in A.
Figure 5
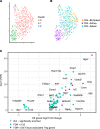
Figure 5. Kidney-infiltrating Tregs exhibit features of tissue reprogramming.
(A) High-resolution reclustering of Tregs identified as cluster 6 in Figure 2 (Main-Seq) identifies 3 unique clusters as illustrated by color-coding. (B) HTO-based identification of splenic (B6 and MRL/lpr) and KIT Tregs. (C) Volcano plot shows top significant (FDR < 0.05) DEGs that are upregulated or downregulated in KITs compared with splenic MRL/lpr Tregs, with genes in pink having been previously associated with tissue-resident Tregs (30).
Figure 6
Figure 6. High-resolution clustering of CD8+ T cells identifies unique functional phenotypes.
(A) UMAP of CD8+ T cells from Main-Seq delineating 9 clusters. (B) UMAP with overlay exhibiting assignment of cell source as determined by HTO. (C) Heatmap shows top significant (FDR < 0.01) DEGs associated with each CD8+ cluster and their expression at single-cell level in columns. (DI) GSEA performed in each cell by Wilcoxon’s test (–log10 [P value]) using published reference gene signatures (Supplemental Table 1), overlaid onto the UMAP to identify CD8 phenotypes. Clusters are outlined as per A. This included gene signatures for (D) resident memory (TRM), (E) circulating/lymphoid (Tperiph), (F) exhaustion (TEX), (G) effector memory (TEM), (H) central memory (TCM), and (I) hypoxia.
Figure 7
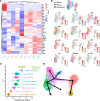
Figure 7. TF and lineage progression analysis of CD8+ KITs.
(A) Heatmap represents z-scored regulon activity of top TFs inferred by SCENIC (rows) and association with CD8+ T cell clusters (columns). (B) Representative TFs were mapped onto CD8 UMAPs; TF selection was based on known regulatory functions or due to identification via SCENIC analysis. Outlines highlight spleen-derived, kidney-infiltrating, and exhausted cells, with dot red color intensity representing log2 expression. (C) CD8+ T cells grouped into 9 distinct clusters and ordered by Slingshot pseudotime trajectory. (D) Slingshot lineage overlay on CD8+ T cell UMAP.
Figure 8
Figure 8. CD8+ KITs are clonally expanded, with clones and proliferation spanning the exhausted and transitional compartments.
(A) UMAP of all 3 scRNA-Seq cohorts (see Figure 1 for cohorts), integrated using Harmony, followed by projection of individual cohorts onto this “combined UMAP.” (B) Main-Seq–defined CD8+ clusters labeled by cluster name (Figure 6), mapped onto the combined UMAP. (C) Combined UMAP with all putative clusters as outlined in B. (D) High-frequency clones (defined as clones representing the top quartile of expressed TCRs) from each cohort are mapped onto the combined UMAP. (E) Exhaustion gene set enrichment calculated using Wilcoxon’s test overlaid onto the combined UMAP. (F) Dot plots represent exhaustion scores for cells grouped based on clonal frequency among MRL/lpr and FcγR2B–/–.Yaa KITs, with exhaustion scores for B6 naive, early TEX, and terminal TEX shown at left for reference (*P = 0.05, **P < 0.01, ****P < 0.0001 as determined by 1-way ANOVA with Tukey’s test for multiple comparisons). Horizontal bars represent medians. (G) Pie charts represent the relative cluster distribution of unique TCR T cells as compared with high-frequency TCRs from MRL/lpr (top) and FcγR2B–/–.Yaa (bottom) models with the relative distribution of these clones within the putative T cell clusters as defined in B and C. (H) Cell cycle state was assessed over all cells for each cluster using GSEA for genes indicative of G1, G2/M, and S phases. Proliferative potential was analyzed for enrichment of G2/M and S phase genes, comparing individual clusters with the total T cell population. (G and H) Data were analyzed using χ2 analysis and corrected for multiple comparisons for 9 comparison groups (*P = 0.05, ***P < 0.005, ****P < 0.0001). Green indicates enrichment of G2/M/S phase genes, and red indicates enrichment of G1 genes.

Similar articles

Cited by

References

    1. Hope HC, Salmond RJ. Targeting the tumor microenvironment and T cell metabolism for effective cancer immunotherapy. Eur J Immunol. 2019;49(8):1147–1152. - PubMed
    1. Jiang Y, et al. T-cell exhaustion in the tumor microenvironment. Cell Death Dis. 2015;6:e1792. doi: 10.1038/cddis.2015.162. - DOI - PMC - PubMed
    1. Scharping NE, et al. Mitochondrial stress induced by continuous stimulation under hypoxia rapidly drives T cell exhaustion. Nat Immunol. 2021;22(2):205–215. doi: 10.1038/s41590-020-00834-9. - DOI - PMC - PubMed
    1. Clark MR, et al. The pathogenesis and therapeutic implications of tubulointerstitial inflammation in human lupus nephritis. Semin Nephrol. 2015;35(5):455–464. doi: 10.1016/j.semnephrol.2015.08.007. - DOI - PMC - PubMed
    1. Hsieh C, et al. Predicting outcomes of lupus nephritis with tubulointerstitial inflammation and scarring. Arthritis Care Res (Hoboken) 2011;63(6):865–874. doi: 10.1002/acr.20441. - DOI - PMC - PubMed

Publication types