. 2022 Apr 15;132(8):e152187.
doi: 10.1172/JCI152187.

The Eph receptor A4 plays a role in demyelination and depression-related behavior

Affiliations

The Eph receptor A4 plays a role in demyelination and depression-related behavior

Yuan Li et al. J Clin Invest. .

Erratum in

Abstract

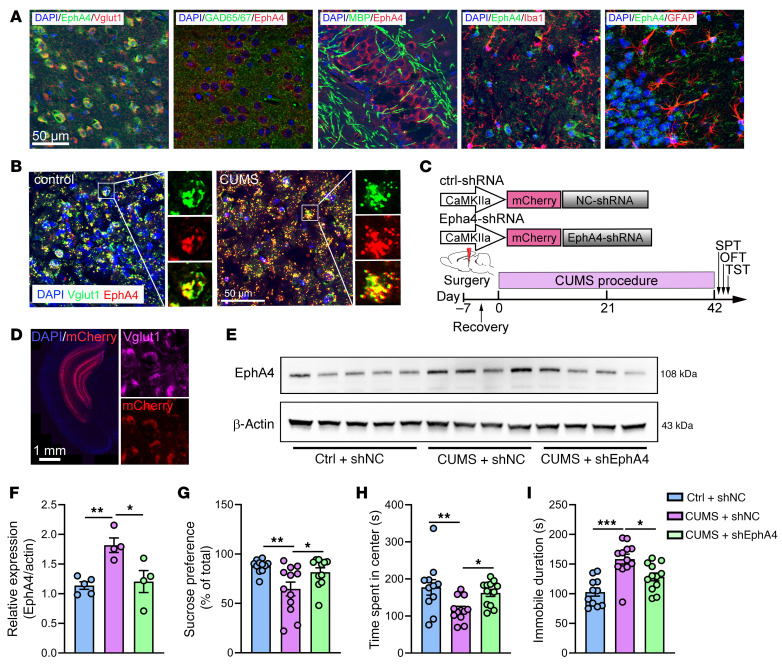
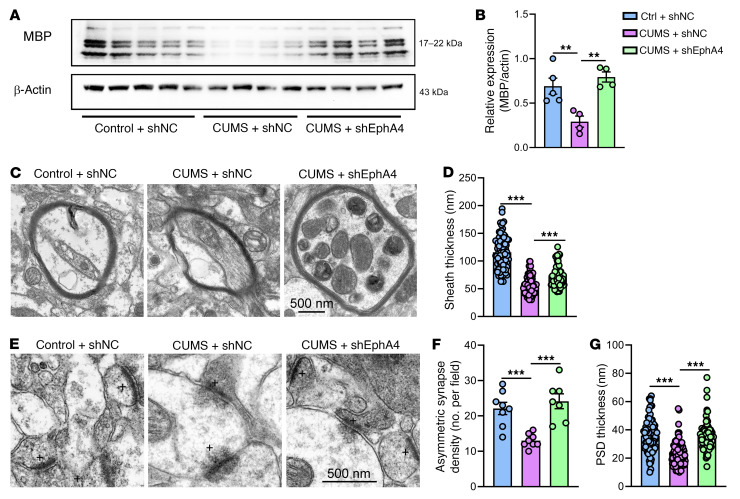
Proper myelination of axons is crucial for normal sensory, motor, and cognitive function. Abnormal myelination is seen in brain disorders such as major depressive disorder (MDD), but the molecular mechanisms connecting demyelination with the pathobiology remain largely unknown. We observed demyelination and synaptic deficits in mice exposed to either chronic, unpredictable mild stress (CUMS) or LPS, 2 paradigms for inducing depression-like states. Pharmacological restoration of myelination normalized both synaptic deficits and depression-related behaviors. Furthermore, we found increased ephrin A4 receptor (EphA4) expression in the excitatory neurons of mice subjected to CUMS, and shRNA knockdown of EphA4 prevented demyelination and depression-like behaviors. These animal data are consistent with the decrease in myelin basic protein and the increase in EphA4 levels we observed in postmortem brain samples from patients with MDD. Our results provide insights into the etiology of depressive symptoms in some patients and suggest that inhibition of EphA4 or the promotion of myelination could be a promising strategy for treating depression.

Keywords: Cell Biology; Demyelinating disorders; Molecular biology; Neuroscience.


Conflict of interest statement

Conflict of interest: The authors have declared that no conflict of interest exists.

Figures

Figure 1
Figure 1. Decreased myelination was observed in mouse models for the study of depression.
(A and B) Representative immunofluorescence images of MBP expression in brain sections from control (A) and CUMS (B) mice. Panels on the right are higher-magnification images of the ventral hippocampus (vHip) and external capsule (ec). Scale bar: 1 mm; original magnification, ×100 (enlarged insets). (C) Quantification of MBP fluorescence intensity in the ventral hippocampus (t10 = 5.681) and the external capsule (t10 = 6.130). n = 6 slices from 3 animal brains/group. (D and E) Representative images of LFB histological staining. Scale bar: 1 mm; original magnification, ×200 (enlarged insets). (F) Quantification results of LFB staining of the ventral hippocampus (t22 = 4.410) and the external capsule (t22 = 12.40). n = 12 slices from 4 animal brains/group. (GJ) Western blots and analysis showing lower MBP expression in ventral hippocampus from CUMS mice (G and H) (t10 = 2.446, n = 6 brains/group) and LPS-treated mice (I and J) (t10 = 2.291, n = 6 brains/group) mice. β-Actin was used as the loading control. Data are shown as the mean ± SEM. *P < 0.05 and ***P < 0.001, by unpaired Student’s t test (C, F, H, and J).
Figure 2
Figure 2. Demyelination and altered synaptic protein expression are observed in mouse models relevant to depression.
(A) Schematic diagram of the myelin sheath, showing the nodes of Ranvier, the paranode, and the juxtaparanode, with Caspr 1 expressed mainly in the paranode. (B) Representative images showing Caspr-positive, red-stained paranodal regions in the ventral hippocampus. Scale bar: 20 μm. n = 4 mice/group. (C) High-magnification images of Caspr staining from B. Original magnification, ×400. (D) Nodal lengths were increased in CUMS mice, based on measurements of Caspr-stained regions (n = 50 nodes from 3 different mice/group). (E) Histograms showing the frequency distribution of nodal length, which differed between control and CUMS mice. (F) Representative electron microscopic images showing demyelination in CUMS mice. Scale bar: 500 nm. (G) Thinner myelin sheaths were observed in CUMS mice, as measured by electron microscopy. The total number of myelin sheaths analyzed in the control and CUMS groups was 73 and 87, respectively (n = 15 images from 5 mice/group, t158 = 3.361). (H and I) Representative blots showing decreased PSD95 protein expression in CUMS mice and results of the densitometric analysis. Na+K+ATPase was used as the loading control (n = 6 mice/group, t10 = 3.798). (J and K) Representative blots showing decreased PSD95 protein expression in LPS-treated mice and results of the densitometric analysis (n = 6 mice/group, t10 = 3.866). Data are shown as the mean ± SEM. **P < 0.01 and ***P < 0.001, by unpaired Student’s t test (D, G, I, and K).
Figure 3
Figure 3. Clemastine promotes myelination and rescues depression-related behaviors in mice.
(A) Schematic outline of clemastine treatment experiment in CUMS mice. (BD) Behavioral testing of CUMS mice and clemastine treatment: (B) SPT [F (2, 34) = 4.657, CUMS plus vehicle: n = 12 mice; CUMS plus clemastine: n = 14 mice; control plus vehicle: n = 11 mice]; (C) OFT [F (2, 39) = 4.843]; and (D) TST [F (2, 39) = 5.197, CUMS plus vehicle: n = 15 mice; CUMS plus clemastine: n = 15 mice; control plus vehicle: n = 12 mice in the OFT and TST]. (E) Schematic outline of clemastine treatment experiment in LPS-treated mice. (FH) Behavioral testing of LPS-treated mice and clemastine treatment: (F) SPT [F (2, 33) = 8.388]; (G) OFT [F (2, 33) = 12.13]; and (H) TST [F (2, 33) = 5.023] (n = 12 mice/group). (I and J) Western blots and analysis showing lower levels of MBP that were restored by clemastine treatment in CUMS mice [n = 3 brains/group, F (2, 6) = 7.113]. (K and L) Western blots and analysis showing that clemastine treatment restored the diminished expression of MBP caused by LPS [n = 4–5 brains/group, F (2, 10) = 6.098]. (M) Representative electron microscopic images of ventral hippocampus myelinated axons from CUMS mice treated with clemastine and from control groups (n = 8 images from 3 mice/group). Scale bar: 500 nm. (N) Clemastine restored decreased myelin sheath thickness in CUMS mice, based on measurements from electron microscopic images [F (2, 85) = 18.81]. (O) The g-ratio of the inner to outer diameter of myelin sheaths plotted against the axon diameter. Data are shown as the mean ± SEM. *P < 0.05, **P < 0.01, and ***P < 0.001, by 1-way ANOVA with Dunnett’s post hoc comparison.
Figure 4
Figure 4. Clemastine reverses synaptic deficits.
(A) Representative electron microscopic images of CUMS mice showing synaptic deficits that were rescued by clemastine (n = 3 mice/group). Scale bar: 500 nm. (B) The reduction in asymmetric synapses resulting from CUMS was rescued by clemastine [F (2, 16) = 6.063]. (C) Frequency distributions of PSD thickness. (D) Clemastine treatment normalized PSD thickness in CUMS mice to control levels [n = 40 asymmetric synapses from 3 mice in control and vehicle-treated groups; n = 42 asymmetric synapses from 3 mice in CUMS plus the vehicle group; n = 43 asymmetric synapses from 3 mice in the CUMS plus the clemastine-treated group, F (2, 122) = 14.50]. Data are shown as the mean ± SEM. *P < 0.05 and ***P < 0.001, by 1-way ANOVA with Dunnett’s post hoc comparison test.
Figure 5
Figure 5. EphA4 knockdown rescues CUMS-induced depression-related phenotypes in mice.
(A) Volcano plot of DEGs in CUMS mice versus controls. Cutoff values for the adjusted P value and fold change were set at 0.05 and 1.5, respectively. (B and C) Western blot and analysis showing increased EphA4 in hippocampus after CUMS (n = 6 mice/group, t10 = 2.756). (D and E) Western blot and analysis showing increased EphA4 in hippocampus after LPS injection (n = 6 mice/group, t10 = 3.080). (F and G) The level of ubiquitinated EphA4 was dramatically decreased in CUMS mice (n = 5–6 mice/group, t9 = 6.918). (H) Diagram outlining the layout of the AAV shRNA vector used to knock down EphA4 and the experimental timeline. (I and K) Behavioral effects of EphA4 knockdown in the (I) SPT [F (2, 30) = 8.580]; (J) OFT [F (2, 26) = 4.712; and (K) TST [F (2, 30) = 4.961] in CUMS mice (n = 9–11 mice/group). Data are shown as the mean ± SEM. *P < 0.05, **P < 0.01, and ***P < 0.001, by 1-way ANOVA with Dunnett’s post hoc comparisons test (IK) and unpaired Student’s t test (C, E, and G).
Figure 6
Figure 6. EphA4 knockdown in mice rescues synaptic deficits caused by CUMS.
(A and B) Western blot analysis showing lower levels of MBP in CUMS mice restored by EphA4 knockdown [n = 3 brains/group, F (2, 6) = 7.264]. (C) Representative Western blot images of PSD95 protein levels; Na+K+ATPase was used as the protein loading control. (D) Densitometric analysis of PSD95 levels shows that EphA4 knockdown restored the decrease caused by CUMS versus control levels [n = 3 brains/group, F (2, 6) = 8.407]. (E) Representative electron microscopic images of ultrastructure of synapses from the 3 treatment groups. Scale bar: 1.0 μm. (F) Quantification of asymmetric synapse density, showing that EphA4 rescued the decrease caused by CUMS [n = 11 images from 3 mice/group, F (2, 30) = 7.500]. (G) Histograms showing the differential distribution patterns of the PSD thickness. (H) EphA4 knockdown restored the reduced PSD thickness caused by CUMS [n = 61 asymmetric synapses analyzed from 3 mice in the control plus the shNC group, n = 62 asymmetric synapses from 3 mice in CUMS plus the shNC and CUMS plus shEpha4 groups, F (2, 182) = 21.79]. Data are shown are shown as the mean ± SEM. *P < 0.05, **P < 0.01, ***P < 0.001, by 1-way ANOVA with Dunnett’s post hoc comparison (B, D, F, and H). ctrl, control.
Figure 7
Figure 7. Specific knockdown EphA4 expression in excitatory neurons can rescue the depressive phenotypes in mice induced by CUMS.
(A) EphA4 was mainly colabeled with Vglut1 in the ventral hippocampus of normal mice. (B) EphA4 expression in excitatory neurons was markedly increased by CUMS. Scale bars: 50 μm (n = 5 mice/group). (C) Diagram outlining the layout of the AAV shRNA vector used and the experimental timeline. (D) Representative images demonstrating that the AAV vectors can specifically infect excitatory neurons in the ventral hippocampus. Scale bar: 1 mm. (E) Knockdown efficiency of EphA4 shRNA vectors. (F) Increased levels of EphA4 in CUMS mice were restored by EphA4 shRNA treatment [n = 4–5 brains/group, F (2, 10) = 8.812 ]. (GI) Behavioral effects of EphA4 knockdown in excitatory neurons in the (G) SPT [F (2, 31) = 5.814]; (H) OFT [F (2, 32) = 5.210]); and (I) TST [F (2, 32) = 14.18] in CUMS mice (n = 11–12 mice/group). *P < 0.05, **P < 0.01, ***P < 0.001.
Figure 8
Figure 8. Specific knockdown of EphA4 expression in excitatory neurons in mice can inhibit demyelination and rescue the synaptic deficits induced by CUMS.
(A and B) Lower levels of MBP in CUMS mice restored by EphA4 knockdown in excitatory neurons [n = 4–5 brains/group, F (2, 10) = 11.51]. (C) Representative electron microscopic images of myelinated axons. Scale bar: 500 nm. (D) Specific knockdown of EphA4 in excitatory neurons restored decreased myelin sheath thickness in CUMS mice [n = 85 myelinated axons from 3 mice/group, (F (2, 252) = 166.1]. (E) Representative electron microscopic images of synapses from 3 treatment groups. Scale bar: 500 nm. (F and G) EphA4 knockdown in excitatory neurons restored the reduced asymmetric synapse numbers (F) [F (2, 20) = 14.32] and PSD thickness (G) [n = 85 asymmetric synapses analyzed from 3 mice/group, F (2, 252) = 44.57] caused by CUMS. Data are shown as the mean ± SEM. **P < 0.01 and ***P < 0.001, by 1-way ANOVA with post hoc comparisons with Dunnett’s test.
Figure 9
Figure 9. Altered levels of MBP, PSD95, and EphA4 in postmortem brain tissue from patients with MDD.
(A) Representative Western blot images of MBP protein extracted from postmortem brain tissues donated by patients with MDD versus unaffected controls. (B) Densitometric analysis of MBP protein levels (t28 = 2.102). (C) Representative Western blot images of PSD95 protein extracted from postmortem brain tissues donated by patients with MDD versus unaffected control individuals. (D) Densitometric analysis of PSD95 protein levels (t28 = 2.171). (E) Representative Western blot images of EphA4 protein extracted from postmortem brain tissues donated by patients with MDD versus unaffected control individuals. (F) Densitometric analysis of EphA4 protein levels (t28 = 2.577). α-Tubulin was used as a loading control for all blots in this figure and n = 15 for all analyses. Data are shown as the mean ± SEM. *P < 0.05, by unpaired Student’s t test.

Similar articles

Cited by

References

    1. Nagy C, et al. Single-nucleus transcriptomics of the prefrontal cortex in major depressive disorder implicates oligodendrocyte precursor cells and excitatory neurons. Nat Neurosci. 2020;23(6):771–781. doi: 10.1038/s41593-020-0621-y. - DOI - PubMed
    1. Inskip HM, et al. Lifetime risk of suicide for affective disorder, alcoholism and schizophrenia. Br J Psychiatry. 1998;172:35–37. doi: 10.1192/bjp.172.1.35. - DOI - PubMed
    1. Otte C, et al. Major depressive disorder. Nat Rev Dis Primers. 2016;2:16065. doi: 10.1038/nrdp.2016.65. - DOI - PubMed
    1. Sinyor M, et al. The sequenced treatment alternatives to relieve depression (STAR*D) trial: a review. Can J Psychiatry. 2010;55(3):126–135. doi: 10.1177/070674371005500303. - DOI - PubMed
    1. Rush AJ, et al. Bupropion-SR, sertraline, or venlafaxine-XR after failure of SSRIs for depression. N Engl J Med. 2006;354(12):1231–1242. doi: 10.1056/NEJMoa052963. - DOI - PubMed

Publication types

Substances