

Characterization of fin whale song off the Western Antarctic Peninsula
- PMID: 35271610
- PMCID: PMC8912240
- DOI: 10.1371/journal.pone.0264214
Characterization of fin whale song off the Western Antarctic Peninsula
Abstract
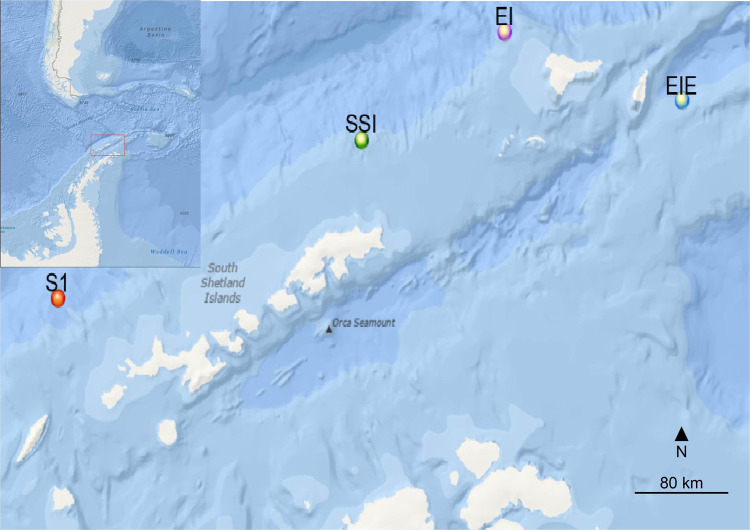
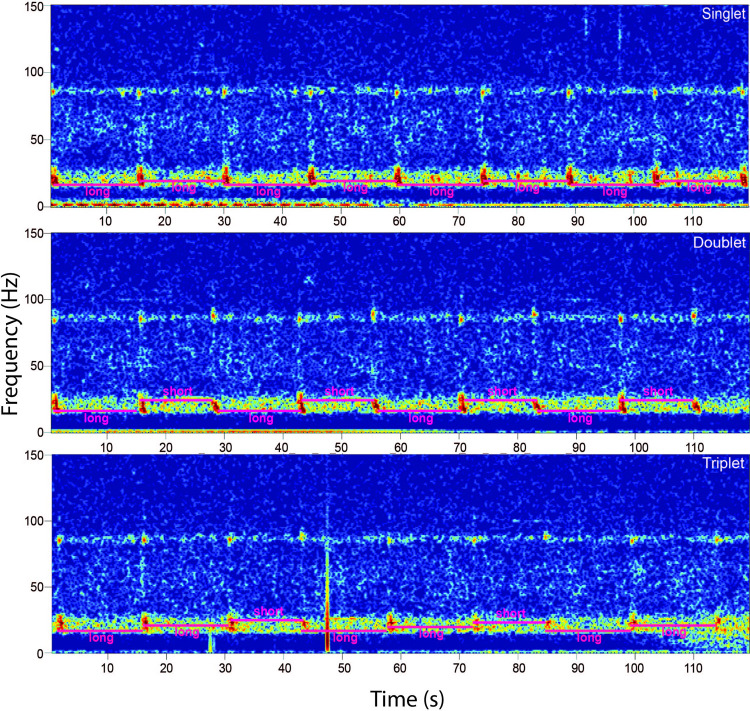
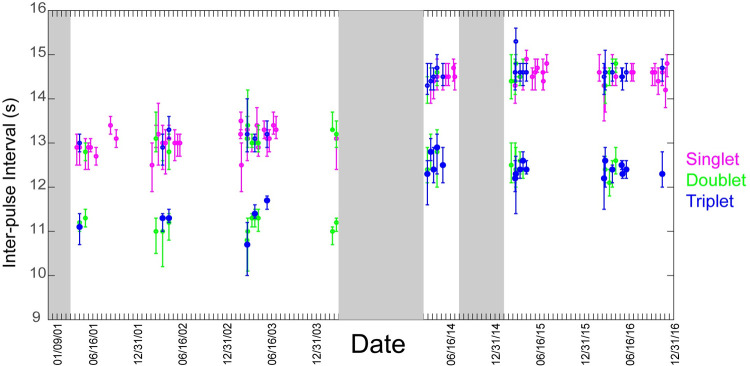
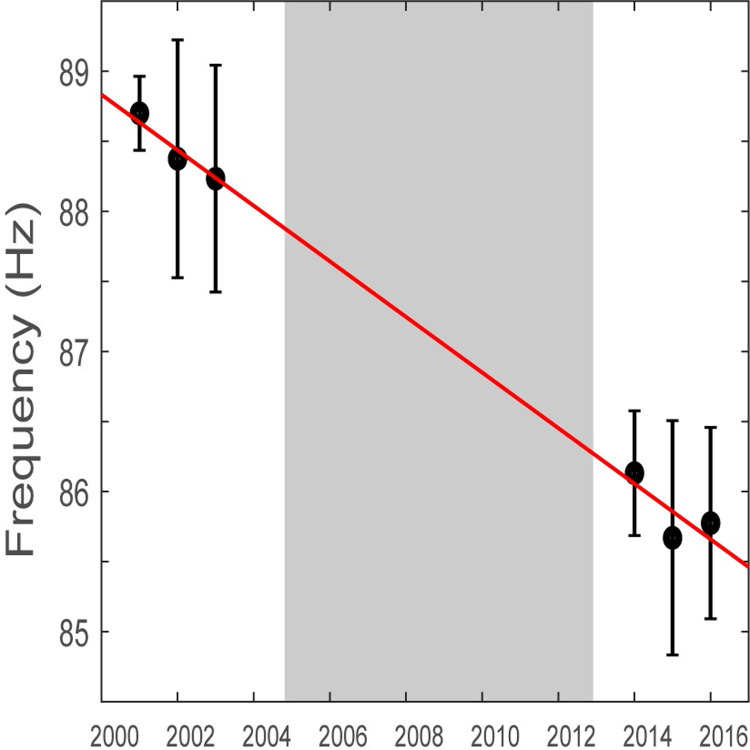
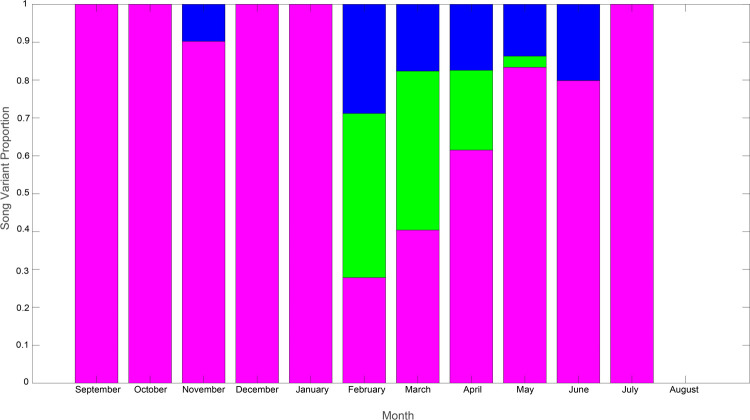
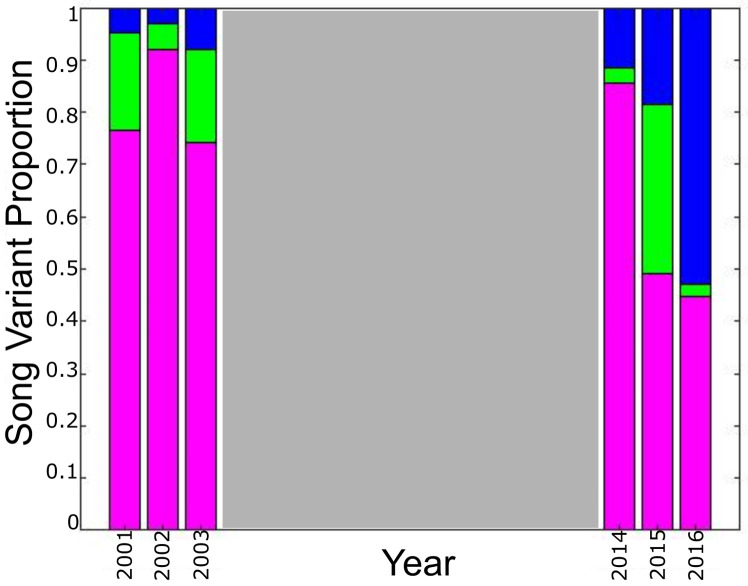
Song is produced by a variety of terrestrial and marine animals and is particularly common among baleen whales. Fin whale (Balaenoptera physalus) song is comprised of relatively simple 20 Hz pulses produced at regular intervals. The timing of these intervals, in addition to the presence and frequency of overtones, appears to be unique to each population. The purpose of this study was to characterize Western Antarctic Peninsula fin whale song and describe temporal pattern variations in song type and occurrence. Recordings were collected in the area from 2001-2004 and again 2014-2016. One song type was identified with a primary inter-pulse interval (IPI) of approximately 14 s and secondary IPI of 12.5 s. This song occurred in three pattern variants: singlet, doublet, and long triplet. The interval between pulses increased by 1.5 s between recording periods while the frequency of the overtones decreased from 89 Hz to 86 Hz. Song was never recorded in August and while it was recorded at other times in some years, it was consistently present in recordings from April through June across all years. While multiple pattern variants were present each year, singlets were generally the most prevalent variant. Doublets and triplets occurred from February through June, with highest levels of variants in February. In later years the triplet variant presence increased and in 2016 it comprised 53% of recorded song bouts. Further research is needed to understand the reasons why song changes over time and to examine the feasibility of using song to delineate and identify populations.
Conflict of interest statement
The authors have declared that no competing interests exist.
Figures
Similar articles
-
Temporal evolution of the Mediterranean fin whale song.Sci Rep. 2022 Aug 9;12(1):13565. doi: 10.1038/s41598-022-15379-0. Sci Rep. 2022. PMID: 35945237 Free PMC article.
-
Synchronous seasonal change in fin whale song in the North Pacific.PLoS One. 2014 Dec 18;9(12):e115678. doi: 10.1371/journal.pone.0115678. eCollection 2014. PLoS One. 2014. PMID: 25521493 Free PMC article.
-
Fin whale song variability in southern California and the Gulf of California.Sci Rep. 2017 Aug 31;7(1):10126. doi: 10.1038/s41598-017-09979-4. Sci Rep. 2017. PMID: 28860617 Free PMC article.
-
Seasonal and geographical patterns of fin whale song in the western North Atlantic Ocean.J Acoust Soc Am. 2012 Aug;132(2):1207-12. doi: 10.1121/1.4730890. J Acoust Soc Am. 2012. PMID: 22894239
-
Fin whale acoustic populations present in New Zealand waters: Description of song types, occurrence and seasonality using passive acoustic monitoring.PLoS One. 2021 Jul 14;16(7):e0253737. doi: 10.1371/journal.pone.0253737. eCollection 2021. PLoS One. 2021. PMID: 34260603 Free PMC article.
Cited by
-
Historical Mitogenomic Diversity and Population Structuring of Southern Hemisphere Fin Whales.Genes (Basel). 2023 May 3;14(5):1038. doi: 10.3390/genes14051038. Genes (Basel). 2023. PMID: 37239398 Free PMC article.
-
Fin whale song characteristics and potential subpopulation identity in the New York Bight.Sci Rep. 2024 Feb 13;14(1):2931. doi: 10.1038/s41598-024-52228-8. Sci Rep. 2024. PMID: 38351184 Free PMC article.
-
Fin whale song evolution in the North Atlantic.Elife. 2024 Jan 9;13:e83750. doi: 10.7554/eLife.83750. Elife. 2024. PMID: 38192202 Free PMC article.
-
First evidence for fin whale migration into the Pacific from Antarctic feeding grounds at Elephant Island.R Soc Open Sci. 2022 Sep 21;9(9):220721. doi: 10.1098/rsos.220721. eCollection 2022 Sep. R Soc Open Sci. 2022. PMID: 36147939 Free PMC article.
-
Temporal evolution of the Mediterranean fin whale song.Sci Rep. 2022 Aug 9;12(1):13565. doi: 10.1038/s41598-022-15379-0. Sci Rep. 2022. PMID: 35945237 Free PMC article.
References
-
- Au WWL, Hastings MC. Principles of Marine Bioacoustics. New York: Springer; 2008.
Publication types
MeSH terms
LinkOut - more resources
Full Text Sources
Miscellaneous
