

Targeting the somatosensory system with AAV9 and AAV2retro viral vectors
- PMID: 35271639
- PMCID: PMC8912232
- DOI: 10.1371/journal.pone.0264938
Targeting the somatosensory system with AAV9 and AAV2retro viral vectors
Abstract
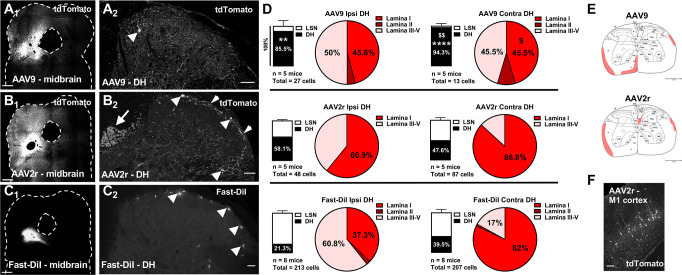
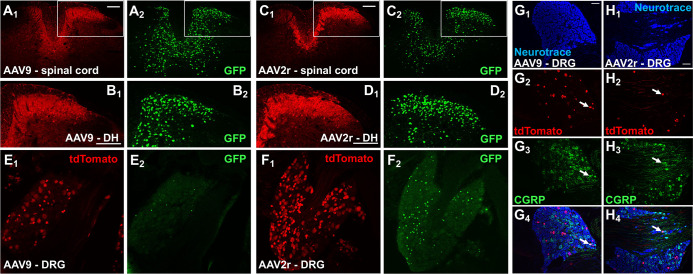
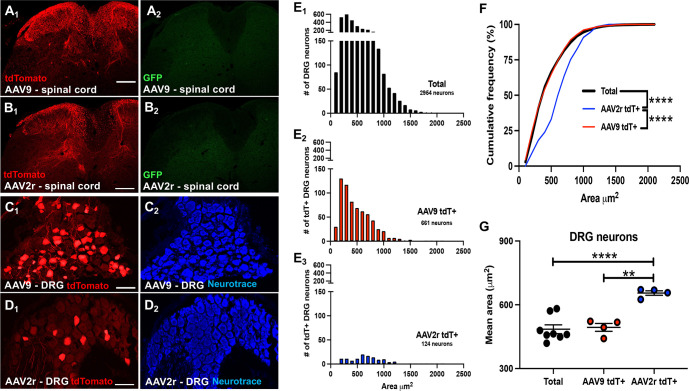
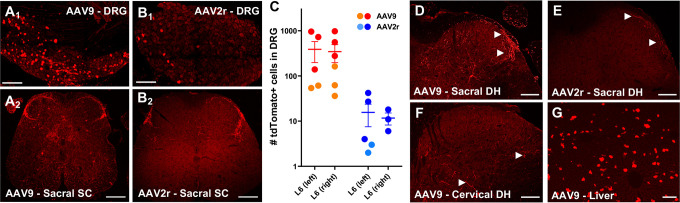
Adeno-associated viral (AAV) vectors allow for site-specific and time-dependent genetic manipulation of neurons. However, for successful implementation of AAV vectors, major consideration must be given to the selection of viral serotype and route of delivery for efficient gene transfer into the cell type being investigated. Here we compare the transduction pattern of neurons in the somatosensory system following injection of AAV9 or AAV2retro in the parabrachial complex of the midbrain, the spinal cord dorsal horn, the intrathecal space, and the colon. Transduction was evaluated based on Cre-dependent expression of tdTomato in transgenic reporter mice, following delivery of AAV9 or AAV2retro carrying identical constructs that drive the expression of Cre/GFP. The pattern of distribution of tdTomato expression indicated notable differences in the access of the two AAV serotypes to primary afferent neurons via peripheral delivery in the colon and to spinal projections neurons via intracranial delivery within the parabrachial complex. Additionally, our results highlight the superior sensitivity of detection of neuronal transduction based on reporter expression relative to expression of viral products.
Conflict of interest statement
The authors have declared that no competing interests exist.
Figures
Similar articles
-
Atrial-Specific Gene Delivery Using an Adeno-Associated Viral Vector.Circ Res. 2019 Jan 18;124(2):256-262. doi: 10.1161/CIRCRESAHA.118.313811. Circ Res. 2019. PMID: 30582449 Free PMC article.
-
Cellular selectivity of AAV serotypes for gene delivery in neurons and astrocytes by neonatal intracerebroventricular injection.PLoS One. 2017 Dec 15;12(12):e0188830. doi: 10.1371/journal.pone.0188830. eCollection 2017. PLoS One. 2017. PMID: 29244806 Free PMC article.
-
Differential adeno-associated virus mediated gene transfer to sensory neurons following intrathecal delivery by direct lumbar puncture.Mol Pain. 2010 May 28;6:31. doi: 10.1186/1744-8069-6-31. Mol Pain. 2010. PMID: 20509925 Free PMC article.
-
Comparison of high-dose intracisterna magna and lumbar puncture intrathecal delivery of AAV9 in mice to treat neuropathies.Brain Res. 2020 Jul 15;1739:146832. doi: 10.1016/j.brainres.2020.146832. Epub 2020 Apr 11. Brain Res. 2020. PMID: 32289279 Free PMC article. Review.
-
The advent of AAV9 expands applications for brain and spinal cord gene delivery.Expert Opin Biol Ther. 2012 Jun;12(6):757-66. doi: 10.1517/14712598.2012.681463. Epub 2012 Apr 20. Expert Opin Biol Ther. 2012. PMID: 22519910 Free PMC article. Review.
Cited by
-
Targeting dorsal root ganglia and primary sensory neurons for the treatment of chronic pain: an update.Expert Opin Ther Targets. 2023 Jul-Dec;27(8):665-678. doi: 10.1080/14728222.2023.2247563. Epub 2023 Aug 22. Expert Opin Ther Targets. 2023. PMID: 37574713 Free PMC article. Review.
-
Gut-innervating nociceptors regulate the intestinal microbiota to promote tissue protection.Cell. 2022 Oct 27;185(22):4170-4189.e20. doi: 10.1016/j.cell.2022.09.008. Epub 2022 Oct 14. Cell. 2022. PMID: 36240781 Free PMC article.
-
Evaluating the transduction efficiency of systemically delivered AAV vectors in the rat nervous system.Front Neurosci. 2023 Jan 23;17:1001007. doi: 10.3389/fnins.2023.1001007. eCollection 2023. Front Neurosci. 2023. PMID: 36755734 Free PMC article.
-
A chemogenetic screen reveals that Trpv1-expressing neurons control regulatory T cells in the gut.Science. 2024 Aug 2;385(6708):eadk1679. doi: 10.1126/science.adk1679. Epub 2024 Aug 2. Science. 2024. PMID: 39088603 Free PMC article.
-
AAV-mediated gene transfer to colon-innervating primary afferent neurons.Front Pain Res (Lausanne). 2023 Aug 4;4:1225246. doi: 10.3389/fpain.2023.1225246. eCollection 2023. Front Pain Res (Lausanne). 2023. PMID: 37599864 Free PMC article.
References
-
- Schuster DJ, Dykstra JA, Riedl MS, Kitto KF, Belur LR, McIvor RS, et al.. Biodistribution of adeno-associated virus serotype 9 (AAV9) vector after intrathecal and intravenous delivery in mouse. Frontiers in neuroanatomy. 2014;8:42. doi: 10.3389/fnana.2014.00042 ; PubMed Central PMCID: PMC4051274. - DOI - PMC - PubMed
-
- Vulchanova L, Schuster DJ, Belur LR, Riedl MS, Podetz-Pedersen KM, Kitto KF, et al.. Differential adeno-associated virus mediated gene transfer to sensory neurons following intrathecal delivery by direct lumbar puncture. Molecular pain. 2010;6:31. Epub 2010/06/01. doi: 10.1186/1744-8069-6-31 ; PubMed Central PMCID: PMC2900238. - DOI - PMC - PubMed
-
- Gallaher ZR, Steward O. Modest enhancement of sensory axon regeneration in the sciatic nerve with conditional co-deletion of PTEN and SOCS3 in the dorsal root ganglia of adult mice. Experimental neurology. 2018;303:120–33. Epub 2018/02/20. doi: 10.1016/j.expneurol.2018.02.012 ; PubMed Central PMCID: PMC5864562. - DOI - PMC - PubMed
-
- Zhang Z, Zheng B, Du S, Han G, Zhao H, Wu S, et al.. Eukaryotic initiation factor 4 gamma 2 contributes to neuropathic pain through downregulation of Kv1.2 and the mu opioid receptor in mouse primary sensory neurones. Br J Anaesth. 2020. Epub 2020/12/12. doi: 10.1016/j.bja.2020.10.032 - DOI - PMC - PubMed
Publication types
MeSH terms
Grants and funding
LinkOut - more resources
Full Text Sources
Research Materials
