. 2022 Mar 10;17(3):e0265255.
doi: 10.1371/journal.pone.0265255. eCollection 2022.

Modelling of human torso shape variation inferred by geometric morphometrics

Affiliations

Modelling of human torso shape variation inferred by geometric morphometrics

Michael Thelwell et al. PLoS One. .

Abstract

Traditional body measurement techniques are commonly used to assess physical health; however, these approaches do not fully represent the complex shape of the human body. Three-dimensional (3D) imaging systems capture rich point cloud data that provides a representation of the surface of 3D objects and have been shown to be a potential anthropometric tool for use within health applications. Previous studies utilising 3D imaging have only assessed body shape based on combinations and relative proportions of traditional body measures, such as lengths, widths and girths. Geometric morphometrics (GM) is an established framework used for the statistical analysis of biological shape variation. These methods quantify biological shape variation after the effects of non-shape variation-location, rotation and scale-have been mathematically held constant, otherwise known as the Procrustes paradigm. The aim of this study was to determine whether shape measures, identified using geometric morphometrics, can provide additional information about the complexity of human morphology and underlying mass distribution compared to traditional body measures. Scale-invariant features of torso shape were extracted from 3D imaging data of 9,209 participants form the LIFE-Adult study. Partial least squares regression (PLSR) models were created to determine the extent to which variations in human torso shape are explained by existing techniques. The results of this investigation suggest that linear combinations of body measures can explain 49.92% and 47.46% of the total variation in male and female body shape features, respectively. However, there are also significant amounts of variation in human morphology which cannot be identified by current methods. These results indicate that Geometric morphometric methods can identify measures of human body shape which provide complementary information about the human body. The aim of future studies will be to investigate the utility of these measures in clinical epidemiology and the assessment of health risk.


Conflict of interest statement

The authors have declared that no competing interests exist.

Figures

Fig 1
Fig 1. Identification of anterior and posterior torso landmarks.
(a) Extracted data points from 3D image, (b) Identification of anterior and posterior landmarks within point slice data.
Fig 2
Fig 2. Landmarks used to segment the torso and create a local co-ordinate system within each 3D image.
Fig 3
Fig 3. Torso shape principal components (PCs).
First 9 PCs capturing 90.6% of variation in torso shape in the LIFE-Adult cohort, shown as the maximum positive (left) and negative (right) deviations from the sample mean. Blue and red regions represent areas that protrude less, or more than the average torso shape, respectively.
Fig 4
Fig 4. Correlation matrix of male participant measures.
Strength of linear relationships between traditional body measures and shape PCs for male participants. Dark red panels indicate a strong positive correlation, dark blue panels indicate a strong negative correlation, lighter panels indicate weak correlation.
Fig 5
Fig 5. Correlation matrix of female participant measures.
Strength of linear relationships between traditional body measures and shape PCs for female participants. Dark red panels indicate a strong positive correlation, dark blue panels indicate a strong negative correlation, lighter panels indicate weak correlation.
Fig 6
Fig 6. Variable importance in projection (VIP) of body measures within PLS regression models.
Comparison of calculated VIP statistic values within the PLS regression model for each torso shape PC between male and females.
Fig 7
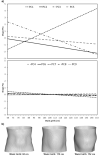
Fig 7. Relationship between body measures and shape PCs for male participants.
(a) Predicted changes in shape PCs according to PLSR models. (b) Reconstructed torso shapes for males with waist girths of 68, 110 and 152 cm.
Fig 8
Fig 8. Relationship between body measures and shape PCs for female participants.
(a) Predicted changes in shape PCs according to PLSR models. (b) Reconstructed torso shapes for females with waist girths of 59, 102 and 143 cm.
Fig 9
Fig 9. Proportions of total torso shape variation within LIFE dataset explained and unexplained by each torso shape PC for males and females.

Similar articles

Cited by

References

    1. Stewart AD. Kinanthropometry and body composition: A natural home for three-dimensional photonic scanning. Journal of Sports Sciences. 2010;28(5):455–7. doi: 10.1080/02640411003661304 - DOI - PubMed
    1. Loeffler M, Engel C, Ahnert P, Alfermann D, Arelin K, Baber R, et al.. The LIFE-Adult-Study: Objectives and design of a population-based cohort study with 10,000 deeply phenotyped adults in Germany. BMC Public Health. 2015;15(1):1–14. doi: 10.1186/s12889-015-1983-z - DOI - PMC - PubMed
    1. Treleaven P. Sizing us up. IEEE Spectrum. 2004;41(April):29–31.
    1. Piché ME, Poirier P, Lemieux I, Després JP. Overview of Epidemiology and Contribution of Obesity and Body Fat Distribution to Cardiovascular Disease: An Update. Progress in Cardiovascular Diseases. 2018;61(2):103–13. doi: 10.1016/j.pcad.2018.06.004 - DOI - PubMed
    1. Duren DL, Sherwood RJ, Czerwinski SA, Lee M, Choh AC, Siervogel RM, et al.. Body composition methods: Comparisons and interpretation. Journal of Diabetes Science and Technology. 2008;2(6):1139–46. doi: 10.1177/193229680800200623 - DOI - PMC - PubMed

Publication types