

Combining chest X-rays and electronic health record (EHR) data using machine learning to diagnose acute respiratory failure
- PMID: 35271711
- PMCID: PMC9093032
- DOI: 10.1093/jamia/ocac030
Combining chest X-rays and electronic health record (EHR) data using machine learning to diagnose acute respiratory failure
Abstract
Objective: When patients develop acute respiratory failure (ARF), accurately identifying the underlying etiology is essential for determining the best treatment. However, differentiating between common medical diagnoses can be challenging in clinical practice. Machine learning models could improve medical diagnosis by aiding in the diagnostic evaluation of these patients.
Materials and methods: Machine learning models were trained to predict the common causes of ARF (pneumonia, heart failure, and/or chronic obstructive pulmonary disease [COPD]). Models were trained using chest radiographs and clinical data from the electronic health record (EHR) and applied to an internal and external cohort.
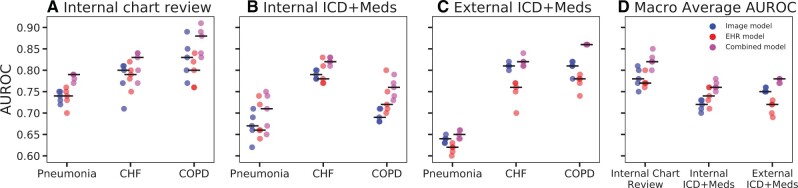
Results: The internal cohort of 1618 patients included 508 (31%) with pneumonia, 363 (22%) with heart failure, and 137 (8%) with COPD based on physician chart review. A model combining chest radiographs and EHR data outperformed models based on each modality alone. Models had similar or better performance compared to a randomly selected physician reviewer. For pneumonia, the combined model area under the receiver operating characteristic curve (AUROC) was 0.79 (0.77-0.79), image model AUROC was 0.74 (0.72-0.75), and EHR model AUROC was 0.74 (0.70-0.76). For heart failure, combined: 0.83 (0.77-0.84), image: 0.80 (0.71-0.81), and EHR: 0.79 (0.75-0.82). For COPD, combined: AUROC = 0.88 (0.83-0.91), image: 0.83 (0.77-0.89), and EHR: 0.80 (0.76-0.84). In the external cohort, performance was consistent for heart failure and increased for COPD, but declined slightly for pneumonia.
Conclusions: Machine learning models combining chest radiographs and EHR data can accurately differentiate between common causes of ARF. Further work is needed to determine how these models could act as a diagnostic aid to clinicians in clinical settings.
Keywords: acute respiratory failure; chest X-ray; electronic health record; machine learning.
© The Author(s) 2022. Published by Oxford University Press on behalf of the American Medical Informatics Association. All rights reserved. For permissions, please email: journals.permissions@oup.com.
Figures
Similar articles
-
Development and External Validation of a Detection Model to Retrospectively Identify Patients With Acute Respiratory Distress Syndrome.Crit Care Med. 2025 Jun 1;53(6):e1224-e1234. doi: 10.1097/CCM.0000000000006662. Epub 2025 Apr 8. Crit Care Med. 2025. PMID: 40197621
-
Multicentre validation of a machine learning model for predicting respiratory failure after noncardiac surgery.Br J Anaesth. 2024 Jun;132(6):1304-1314. doi: 10.1016/j.bja.2024.01.030. Epub 2024 Feb 26. Br J Anaesth. 2024. PMID: 38413342
-
Democratizing EHR analyses with FIDDLE: a flexible data-driven preprocessing pipeline for structured clinical data.J Am Med Inform Assoc. 2020 Dec 9;27(12):1921-1934. doi: 10.1093/jamia/ocaa139. J Am Med Inform Assoc. 2020. PMID: 33040151 Free PMC article.
-
Lung Ultrasound for the Emergency Diagnosis of Pneumonia, Acute Heart Failure, and Exacerbations of Chronic Obstructive Pulmonary Disease/Asthma in Adults: A Systematic Review and Meta-analysis.J Emerg Med. 2019 Jan;56(1):53-69. doi: 10.1016/j.jemermed.2018.09.009. Epub 2018 Oct 9. J Emerg Med. 2019. PMID: 30314929
-
Comments on Contemporary Uses of Machine Learning for Electronic Health Records.N C Med J. 2024 Jun;85(4):263-265. doi: 10.18043/001c.120570. N C Med J. 2024. PMID: 39466097 Review.
Cited by
-
Chinese experts' consensus on the application of intensive care big data.Front Med (Lausanne). 2024 Jan 8;10:1174429. doi: 10.3389/fmed.2023.1174429. eCollection 2023. Front Med (Lausanne). 2024. PMID: 38264049 Free PMC article.
-
Artificial intelligence-aided diagnosis model for acute respiratory distress syndrome combining clinical data and chest radiographs.Digit Health. 2022 Aug 15;8:20552076221120317. doi: 10.1177/20552076221120317. eCollection 2022 Jan-Dec. Digit Health. 2022. PMID: 35990108 Free PMC article.
-
Machine Learning Augmented Interpretation of Chest X-rays: A Systematic Review.Diagnostics (Basel). 2023 Feb 15;13(4):743. doi: 10.3390/diagnostics13040743. Diagnostics (Basel). 2023. PMID: 36832231 Free PMC article. Review.
-
Multimodal biomedical AI.Nat Med. 2022 Sep;28(9):1773-1784. doi: 10.1038/s41591-022-01981-2. Epub 2022 Sep 15. Nat Med. 2022. PMID: 36109635 Review.
-
Uncovering the effects of model initialization on deep model generalization: A study with adult and pediatric chest X-ray images.PLOS Digit Health. 2024 Jan 17;3(1):e0000286. doi: 10.1371/journal.pdig.0000286. eCollection 2024 Jan. PLOS Digit Health. 2024. PMID: 38232121 Free PMC article.
References
-
- HCUP Fast Stats. Healthcare Cost and Utilization Project (HCUP). Agency for Healthcare Research and Quality, Rockville, MD. 2021. www.hcup-us.ahrq.gov/faststats/national/inpatientcommondiagnoses.jsp?yea.... Accessed October 28, 2021.
-
- Lien CT, Gillespie ND, Struthers AD, McMurdo ME. Heart failure in frail elderly patients: diagnostic difficulties, co-morbidities, polypharmacy and treatment dilemmas. Eur J Heart Fail 2002; 4 (1): 91–8. - PubMed
Publication types
MeSH terms
Grants and funding
LinkOut - more resources
Full Text Sources
Medical
