

Chromosome size affects sequence divergence between species through the interplay of recombination and selection
- PMID: 35271737
- PMCID: PMC9314927
- DOI: 10.1111/evo.14467
Chromosome size affects sequence divergence between species through the interplay of recombination and selection
Abstract
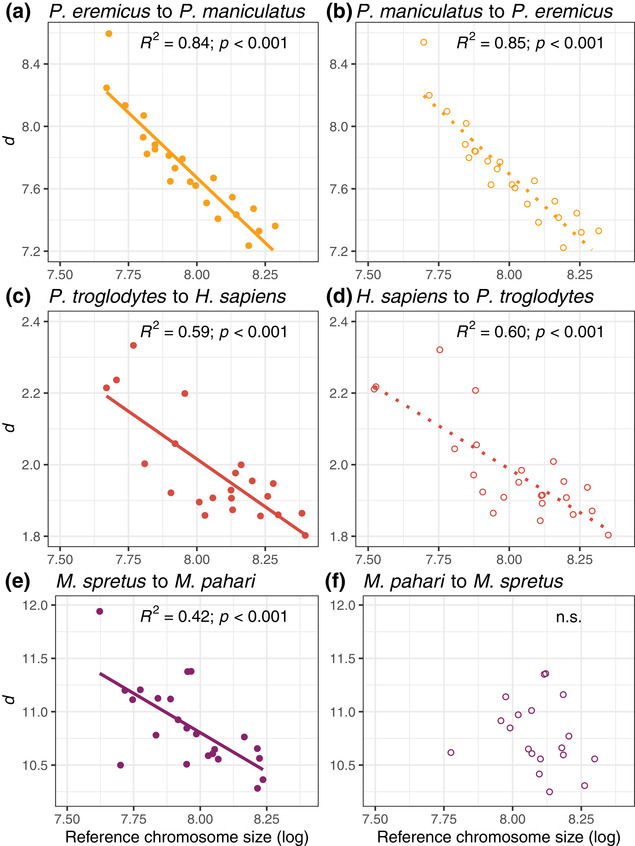
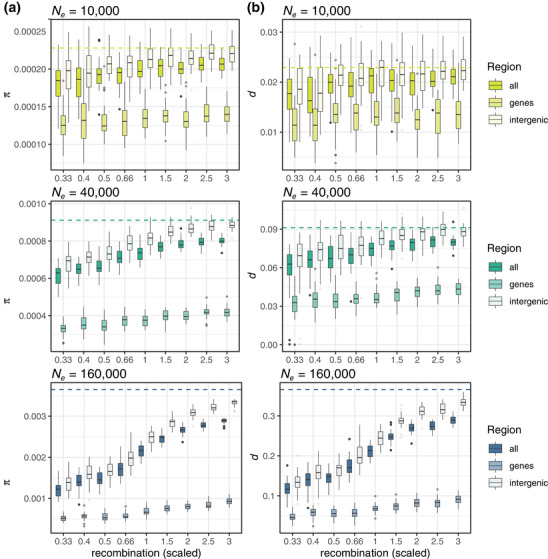
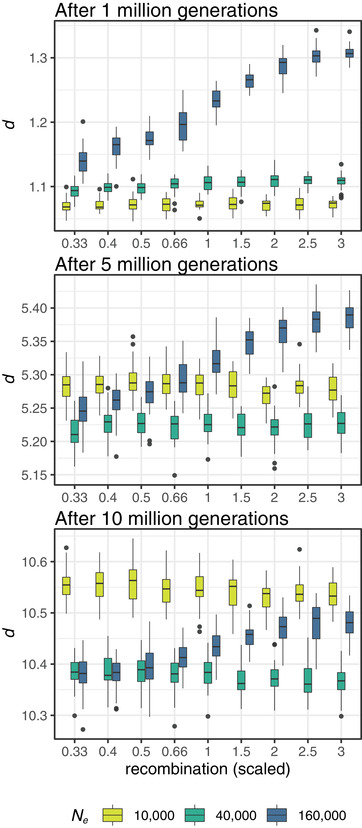
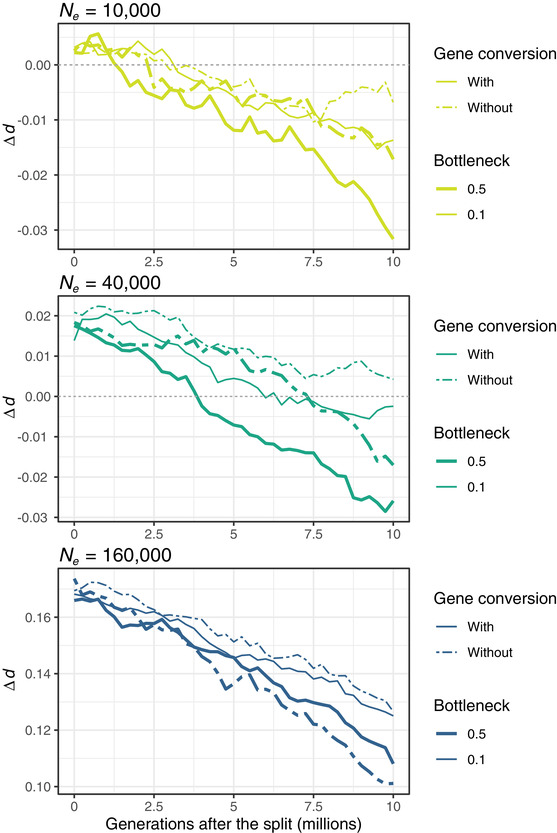
The structure of the genome shapes the distribution of genetic diversity and sequence divergence. To investigate how the relationship between chromosome size and recombination rate affects sequence divergence between species, we combined empirical analyses and evolutionary simulations. We estimated pairwise sequence divergence among 15 species from three different mammalian clades-Peromyscus rodents, Mus mice, and great apes-from chromosome-level genome assemblies. We found a strong significant negative correlation between chromosome size and sequence divergence in all species comparisons within the Peromyscus and great apes clades but not the Mus clade, suggesting that the dramatic chromosomal rearrangements among Mus species may have masked the ancestral genomic landscape of divergence in many comparisons. Our evolutionary simulations showed that the main factor determining differences in divergence among chromosomes of different sizes is the interplay of recombination rate and selection, with greater variation in larger populations than in smaller ones. In ancestral populations, shorter chromosomes harbor greater nucleotide diversity. As ancestral populations diverge, diversity present at the onset of the split contributes to greater sequence divergence in shorter chromosomes among daughter species. The combination of empirical data and evolutionary simulations revealed that chromosomal rearrangements, demography, and divergence times may also affect the relationship between chromosome size and divergence, thus deepening our understanding of the role of genome structure in the evolution of species divergence.
Keywords: Mus; Peromyscus; genome assembly; genome evolution; great apes; mammal.
© 2022 The Authors. Evolution published by Wiley Periodicals LLC on behalf of The Society for the Study of Evolution.
Conflict of interest statement
The authors declare no conflict of interest.
Figures
References
-
- Barko, V. A. , and Feldhamer G. A.. 2002. Cotton mice (Peromyscus gossypinus) in southern Illinois: evidence for hybridization with white‐footed mice (Peromyscus leucopus). The American Midland Naturalist 147:109–115.
-
- Begun, D. J. , and Aquadro C. F.. 1992. Levels of naturally occurring DNA polymorphisms correlate with recombination rates in D. melanogaster . Nature 356:519–520. - PubMed
-
- Booker, T. R. , Yeaman S., and Whitlock M. C.. 2020. Variation in recombination rate affects the detection of outliers in genome scans under neutrality. Mol. Ecol. 29:4274–4279. - PubMed
-
- Burri, R. , Nater A., Kawakami T., Mugal C. F., Olason P. I., Smeds L., Suh A., Dutoit L., Bureš S., Garamszegi L. Z., et al. 2015. Linked selection and recombination rate variation drive the evolution of the genomic landscape of differentiation across the speciation continuum of Ficedula flycatchers. Genome Res. 25:1656–1665. - PMC - PubMed