. 2022 Jun;162(7):2047-2062.
doi: 10.1053/j.gastro.2022.02.035. Epub 2022 Mar 7.

IRAK4 Signaling Drives Resistance to Checkpoint Immunotherapy in Pancreatic Ductal Adenocarcinoma

Affiliations

IRAK4 Signaling Drives Resistance to Checkpoint Immunotherapy in Pancreatic Ductal Adenocarcinoma

Vikas K Somani et al. Gastroenterology. 2022 Jun.

Abstract

Background & aims: Checkpoint immunotherapy is largely ineffective in pancreatic ductal adenocarcinoma (PDAC). The innate immune nuclear factor (NF)-κB pathway promotes PDAC cell survival and stromal fibrosis, and is driven by Interleukin-1 Receptor Associated Kinase-4 (IRAK4), but its impact on tumor immunity has not been directly investigated.

Methods: We interrogated The Cancer Genome Atlas data to identify the correlation between NF-κB and T cell signature, and a PDAC tissue microarray (TMA) to correlate IRAK4 activity with CD8+ T cell abundance. We performed RNA sequencing (RNA-seq) on IRAK4-deleted PDAC cells, and single-cell RNA-seq on autochthonous KPC (p48-Cre/TP53f/f/LSL-KRASG12D) mice treated with an IRAK4 inhibitor. We generated conditional IRAK4-deleted KPC mice and complementarily used IRAK4 inhibitors to determine the impact of IRAK4 on T cell immunity.

Results: We found positive correlation between NF-κB activity, IRAK4 and T cell exhaustion from The Cancer Genome Atlas. We observed inverse correlation between phosphorylated IRAK4 and CD8+ T cell abundance in a PDAC tissue microarray. Loss of IRAK4 abrogates NF-κB activity, several immunosuppressive factors, checkpoint ligands, and hyaluronan synthase 2, all of which drive T cell dysfunction. Accordingly, conditional deletion or pharmacologic inhibition of IRAK4 markedly decreased tumor desmoplasia and increased the abundance and activity of infiltrative CD4+ and CD8+ T cells in KPC tumors. Single-cell RNA-seq showed myeloid and fibroblast reprogramming toward acute inflammatory responses following IRAK4 inhibition. These changes set the stage for successful combination of IRAK4 inhibitors with checkpoint immunotherapy, resulting in excellent tumor control and markedly prolonged survival of KPC mice.

Conclusion: IRAK4 drives T cell dysfunction in PDAC and is a novel, promising immunotherapeutic target.

Keywords: CA-4948; HAS2; NF-κB; PD-L1; T cell exhaustion.


Conflict of interest statement

the authors have declared no conflict of interests.

Figures
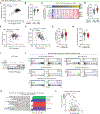
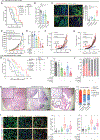
Figure 1.
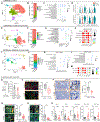
Figure 1.. NF-κB and IRAK4 activation correlate with T cell dysfunction.
(A) Correlation scatter plot with Pearson coefficient (r) of activated stroma vs. NF-κB signature scores (Log2 RNAseqV2, BE norm.) in PDAC samples from TCGA. (B) Violin plot showing activated stroma scores in PDAC samples with high vs. low (by median) NF-κB scores. (C) Heatmaps depicting NF-κB signature score and expression of genes associated with T cell exhaustion across TCGA PDAC samples. (D) Violin plot showing T cell exhaustion scores in high vs. low NF-κB samples. Three outliers were removed for RELA expression by ROUT (Q = 5%). Gene sets lists are provided in Supplementary Table 1. (E, F) Correlation scatter plots of activated and normal stroma signatures vs. RELA mRNA expression in PDAC samples from TCGA. (G, H) Violin plots showing T cell exhaustion or Pro-T cell abundance CAF signature scores in high vs. low (by median) RELA PDAC samples. (I) Western blots showing IRAK4 expression in CRISPR-mediated IRAK4-KO (sgIRAK4) and mIRAK4-rescued KP2 cells. (J) GSEA plots of selected gene signatures using “C6: Oncogenic Signatures” and “Hallmarks” gene-set databases in WT, IRAK4-KO and mIRAK4-rescue KP2 cells. (K) Bar graph depicting Log2 fold change of various GO signatures in IRAK4-KO vs. control KP2 cells. (L) Correlation scatter plot of CD8+ T abundance vs. p-IRAK4 H-score in a Wash U PDAC TMA consisting of 130 patients. (*P < .05, **P < .01, ***P < .001, ****P < .0001 by ANOVA or two-tailed unpaired t-test).
Figure 2.
Figure 2.. IRAK4 controls expression of T cell suppressive factors.
(A, B) Correlation and violin plots of T cell exhaustion score vs. IRAK4 expression from PDAC TCGA data. (C) Primary RNAseq data showing changes in expression of the selected genes (FDR<0.05) in IRAK4-KO relative to control KP2 cells. (D) Western blots showing reduced PD-L1 expression in KP2 cells treated with two different IRAK4i for 24 hours. (E) Experimental schematics and weights of WT vs. IRAK4-KO KP2 tumors from Nur77-GFP reporter mice harvested 14 days after subcutaneous inoculation (N=9 mice/arm). (F) Representative co-IF images and quantification of dual-positive Nur77-GFP+ (green) and CD8+ (red) T cells in WT or IRAK4-KO tumors. (G) Schematics and weights of tumors from FVB/NJ mice orthotopically inoculated with KI cells and treated with vehicle or CA-4948 (N=9 mice/arm). (H, I) Representative co-IF images and quantification of dual-positive Pan-CK and Nectin2 or PD-L1 areas in vehicle- or CA-4948-treated tumors. (J, K) FACS-based quantification of intratumoral CD4+, CD8+, CD4+ effector (CD4+Foxp3CD44high), T regulatory cells (CD4+Foxp3+), CD4+ Teff/Treg ratio, and CD8+ effector (CD8+CD44high) in vehicle- or CA-4948-treated tumors. (L) Bar graph showing enrichment of selected immunologic gene signatures in vehicle- or CA-4948-treated KI tumors by RNAseq. “C7: Immunologic Signature” database was used from MSigDB. (*P < .05, **P < .01, ***P < .001, ****P < .0001 by ANOVA or two-tailed unpaired t-test; scale bars 50μM).
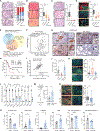
Figure 3.
Figure 3.. Pharmacologic IRAK4 inhibition leads to inflammatory and T cell supportive TME.
(A) UMAP plot, (B) relative abundance, (C) changes in selected MsigDB Hallmark signaling pathways and (D) expression of IL6 and CXCL1 of different subtypes of isolated CAFs from integrated vehicle- and CA-4948-treated KPC tumors (N=4 mice/arm). (E) UMAP plot, (F) relative abundance, (G) changes in selected MsigDB Hallmark signaling pathways and (H) DotPlot showing expression of the selected inflammatory chemokines of different myeloid populations (TAMs, DCs, neutrophils, and monocytes) in isolated CD45+ leukocytes isolated from integrated vehicle-and CA-4948-treated KPC tumors. (I) UMAP plot, (J) relative abundance, (K, L) changes in selected MsigDB Hallmark signaling pathways and (M) DotPlot showing expression of the selected inflammatory chemokines in different adaptive immune cell populations (B cells, plasma cells and different T subsets), isolated CD45+ leukocytes from integrated vehicle-and CA-4948-treated KPC tumors. For all UMAP plots, colors represent clusters identified by Seurat clustering and/or by canonical gene expression. For al DotPlots, dot size represents average LogFC in CA-4948-treated tumors compared to vehicle-treated and colors represent adjusted P values. (N) Experimental schematics on autochthonous KPC mice treated as indicated and final tumor weights (N=6 mice/arm). Representative co-IF or IHC images and quantification of (O) α-SMA; (P) Ly6G; (Q) Nectin2; (R) PD-L1 abundance in vehicle- or CA-4948-treated KPC tumors (N=6/arm). (S) FACS-based quantification of the indicated intratumoral T cell subsets harvested from KPC mice in (N). (*P < .05, **P < .01, ***P < .001, ****P < .0001 by ANOVA or two-tailed unpaired t-test; scale bars 50μM).
Figure 4.
Figure 4.. IRAK4 enhances HAS2 expression and stromal hyaluronan to impair T cell response.
(A-D) Representative images and quantification of H&E histopathological features, Sirius red, Alcian blue and hyaluronan staining in the pancreata of KPC mice treated as indicated until humane endpoints. (E) Venn diagram of selected genes (>2-fold expression differences and FDR<0.1) in control vs. IRAK4-KO cells or IRAK4-KO-rescue vs. IRAK4-KO KP2 cells. Ten genes (*) fit the criteria and were listed. (F) Correlation plot of HAS2 vs. IRAK4 mRNA expression in TCGA PDAC database (generated from GEPIA 2). (G) Representative HAS2 IHC images in human PanIN and PDAC tissues, and in KPC tumors treated with vehicle or CA-4948 for two weeks. (H) Kaplan-Meier survival of PDAC patients from TCGA stratified by HAS2 mRNA expression using FPKM (fragments per kilobase of exon model per million reads mapped). (I) Correlation plot of HAS2 mRNA expression vs. T-cell exhaustion score in TCGA PDAC samples. (J) Final weights of KP2 tumors expressing vector, an sgIRAK4, or sgIRAK4 plus ectopic murine HAS2 expression after 28 days from inoculation in C57BL/6J mice (N=6 mice/arm). (K) Representative co-IF images and quantification of CD8+ T cells (red) in the indicated KP2 tumors. (L) Quantitative RT-PCR showing changes expression of the indicated genes in KP2 cells treated with DMSO or 4-MU 100μM for 72 hours. (M) Experimental schematic and (N) representative co-IF images and quantification of CD8+T cells in control vs. HAS2-overexpressing KP2 tumors. (O) FACS-based quantification of the indicated myeloid subsets in control vs. HAS2-overexpressing KP2 tumors (N-8/arm) in a separate experiment. (*P < .05, **P < .01, ***P < .001, ****P < .0001 by ANOVA or two-tailed unpaired t-test; scale bars 50μM).
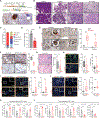
Figure 5.
Figure 5.. Conditional deletion of tumor IRAK4 produces PDAC with increased T cell infiltration.
(A) Conditional knockout strategy of IRAK4 gene in KPC mice and IHC picture confirming loss of tumor-intrinsic IRAK4 protein in IRAK4f/f KPC mice. (B) Serial age-matched H&E images, (C,D) quantification of different histologic stages and final weights of end-staged pancreata of WT vs. IRAK4f/f KPC mice (blinded analysis by GI pathologist). (E) Representative IHC images and quantification of amylase IHC in the pancreata of 6- and end-staged WT vs. IRAK4f/f KPC mice. (F) Representative HAS2 IHC images and H-score measured using automated scanner and HALO software in the pancreata of end-staged WT vs. IRAK4f/f KPC mice. (G-J) Representative IHC and IF images and quantification of Alcian blue, Pan-CK, CD45, CD4 and CD8, dual Ki-67/CD4+ and Ki-67/CD8 staining in the pancreata of WT and IRAK4f/f KPC mice. (K) FACS-based quantification comparing the percentage of peripheral blood CD8+ T cells expressing high levels of intracellular TNF, IFNγ or IL-2 from WT and IRAK4f/f KPC mice (N=6/arm). (L) FACS-based quantification of the percentage of intracellular TNF or IL-2 expressing CD8+ T cell, the titers of these cytokines, and expression of exhaustion markers from WT and IRAK4f/f KPC tumors (N=6/arm). For T cell subsets that express these cytokines, mean fluorescence intensity (MFI) was measured as levels of TNF and IFNγ expression. (*P < .05, **P < .01, ***P < .001, ****P < .0001 by ANOVA or two-tailed unpaired t-test; scale bars 50μM).
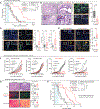
Figure 6.
Figure 6.. Conditional IRAK4-deleted KPC mice respond to checkpoint immunotherapy.
(A) Kaplan-Meier survival analysis of WT and IRAK4f/f KPC mice treated with vehicle or immunotherapy (anti-CTLA4 plus anti-PD1) biweekly for 5 doses starting from six weeks of age. (B) Representative H&E pictures showing presence of abundant immune cells characterized by scant cytoplasm and prominent blue round nuclei in IRAK4f/f, but not WT, KPC tumors treated with immunotherapy. (C-E) Representative co-IF images and quantification showing reduced tumor burden (pan-CK area), increased infiltrative CD45+ leukocytes, CD4+ T cells, CD8+ T cells, dual Ki-67+CD4+ T cells and Ki-67+CD8+ T cells in end-staged IRAK4f/f KPC tumors compared to WT tumors treated with immunotherapy. (F) Growth kinetics of the indicated WT or IRAK4f/f KPC cell lines (two each) grown subcutaneously in syngeneic C57BL/6J (six each) and treated with vehicle or immunotherapy biweekly for five doses. (G) Representative H&E, co-IF and Sirius red images, and quantification of Pan-CK, hyaluronan and Sirius red areas of end-staged tumors from WT and global heterozygous IRAK4+/− KPC littermates euthanized at humane endpoints (N=6/arm, 5–7 random 200X fields were used for analysis by ImageJ). (H) Kaplan-Meier survival analysis of WT and global heterozygous IRAK4+/− KPC littermates treated with vehicle or immunotherapy (anti-CTLA4 plus anti-PD1) biweekly for five doses starting from six weeks of age. (*P < .05, **P < .01, ***P < .001, ****P < .0001 by ANOVA or two-tailed unpaired t-test; scale bars 50μM).
Figure 7.
Figure 7.. Preclinical efficacy of IRAK4 inhibitor-based therapeutic strategies in PDAC.
(A) Kaplan-Meier survival analysis and (B) final weights of the pancreata of KPC mice treated as indicated starting from six weeks of age until humane endpoints. (C) Representative co-IF images and quantification of Pan-CK+ and cleaved caspase-3+ cells in KPC tumors from different treatment arms. (D, E) Growth kinetics and final tumor weights of KI tumors grown subcutaneously in syngeneic FVB/NJ mice and treated as indicated. (F, G) Growth kinetics of individual KI tumors grown in FVB/NJ mice treated with vehicle or CA-4948+anti-CTLA4+anti-PD-1 without and with concurrent neutralizing anti-CD4+ or anti-CD8+ antibodies intended to deplete CD4+ or CD8+ T cells, respectively (N=4–6/arm). (H) Kaplan-Meier analysis, (I) final pancreas weights and (J) ascites status of end-staged KPC mice treated with as indicated. (K) Representative H&E pictures and histopathologic quantification of end-stage pancreata from KPC mice treated as indicated. Highlighted areas were lymphoid aggregate or necrotic area identified by pathologist MBR. (L) Representative co-IF images of CK19 (green), and CD4+ or CD8+ (red), and quantification of CD4+ or CD8+ T cells in the indicated pancreata of end-staged KPC mice treated as indicated. (*P < .05, **P < .01, ***P < .001, ****P < .0001 by ANOVA or two-tailed unpaired t-test, L: scale bars 50μM, K: scale bars 500μM).

Comment in

References

    1. Wattenberg MM, Beatty GL. Overcoming immunotherapeutic resistance by targeting the cancer inflammation cycle. Semin Cancer Biol 2020. - PMC - PubMed
    1. Ochi A, Graffeo CS, Zambirinis CP, et al. Toll-like receptor 7 regulates pancreatic carcinogenesis in mice and humans. J Clin Invest 2012;122:4118–29. - PMC - PubMed
    1. Zambirinis CP, Levie E, Nguy S, et al. TLR9 ligation in pancreatic stellate cells promotes tumorigenesis. J Exp Med 2015;212:2077–94. - PMC - PubMed
    1. Ling J, Kang Y, Zhao R, et al. KrasG12D-induced IKK2/beta/NF-kappaB activation by IL-1alpha and p62 feedforward loops is required for development of pancreatic ductal adenocarcinoma. Cancer Cell 2012;21:105–20. - PMC - PubMed
    1. Dunne A, O’Neill LA. The interleukin-1 receptor/Toll-like receptor superfamily: signal transduction during inflammation and host defense. Sci STKE 2003;2003:re3. - PubMed

Publication types

MeSH terms

Substances