. 2022 Mar 10;22(1):256.
doi: 10.1186/s12885-022-09344-3.

An integrative gene expression signature analysis identifies CMS4 KRAS-mutated colorectal cancers sensitive to combined MEK and SRC targeted therapy

Affiliations

An integrative gene expression signature analysis identifies CMS4 KRAS-mutated colorectal cancers sensitive to combined MEK and SRC targeted therapy

Mingli Yang et al. BMC Cancer. .

Abstract

Background: Over half of colorectal cancers (CRCs) are hard-wired to RAS/RAF/MEK/ERK pathway oncogenic signaling. However, the promise of targeted therapeutic inhibitors, has been tempered by disappointing clinical activity, likely due to complex resistance mechanisms that are not well understood. This study aims to investigate MEK inhibitor-associated resistance signaling and identify subpopulation(s) of CRC patients who may be sensitive to biomarker-driven drug combination(s).

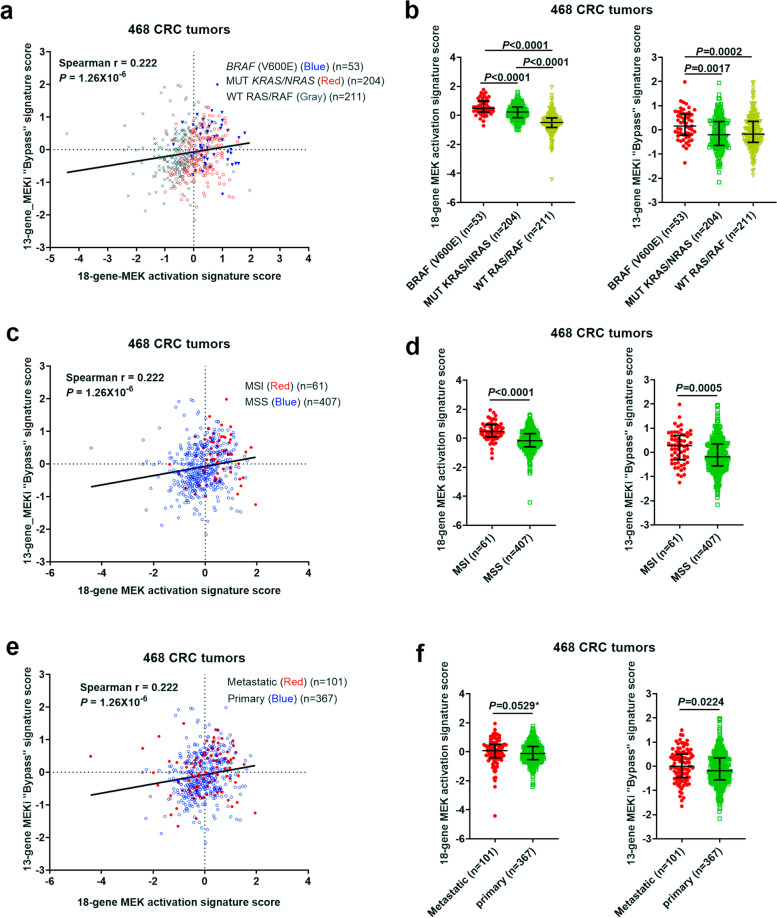
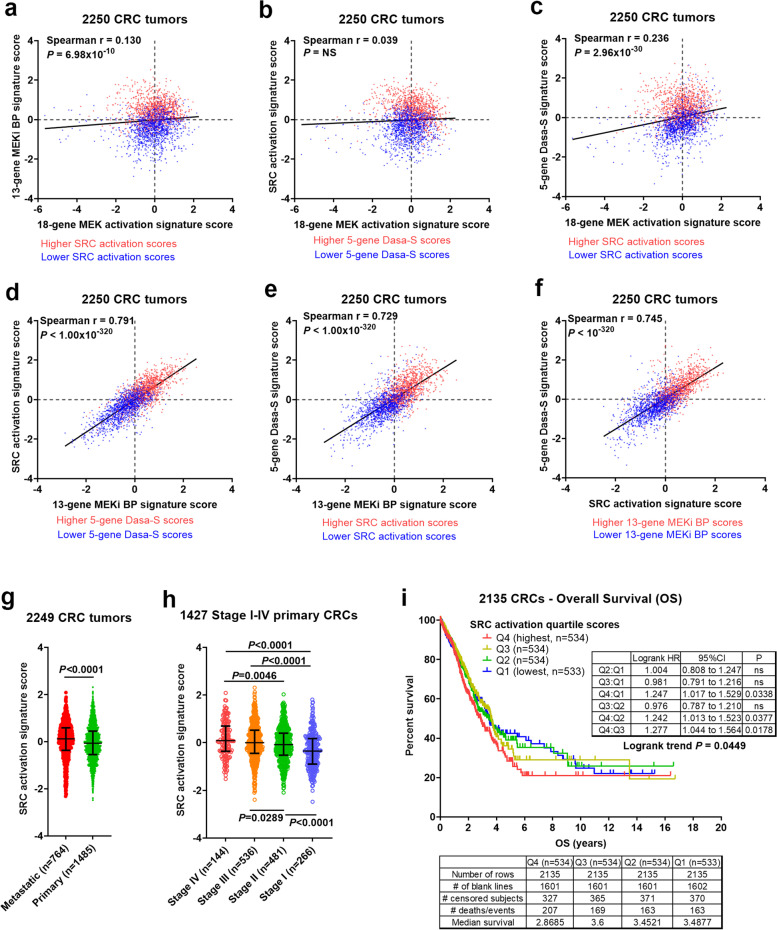
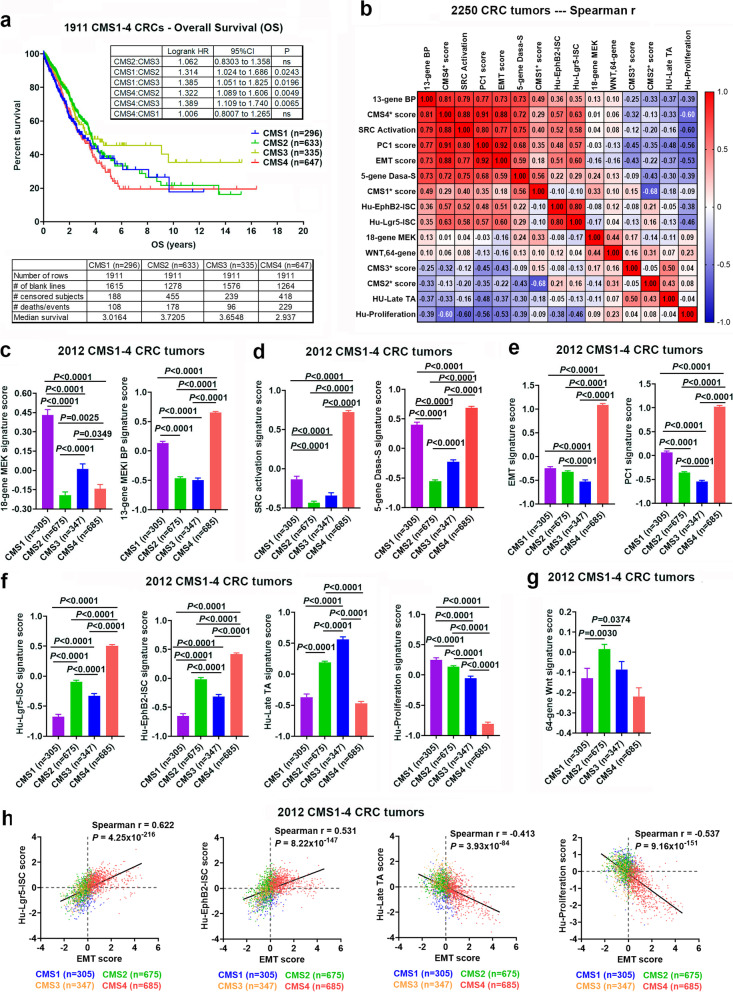
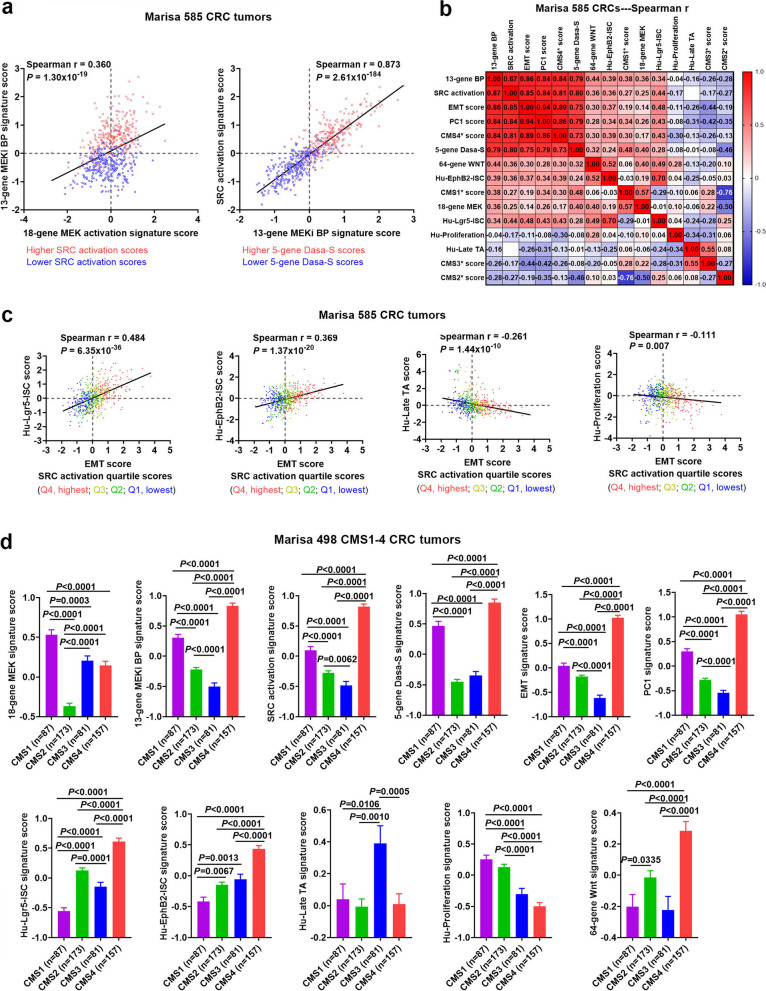
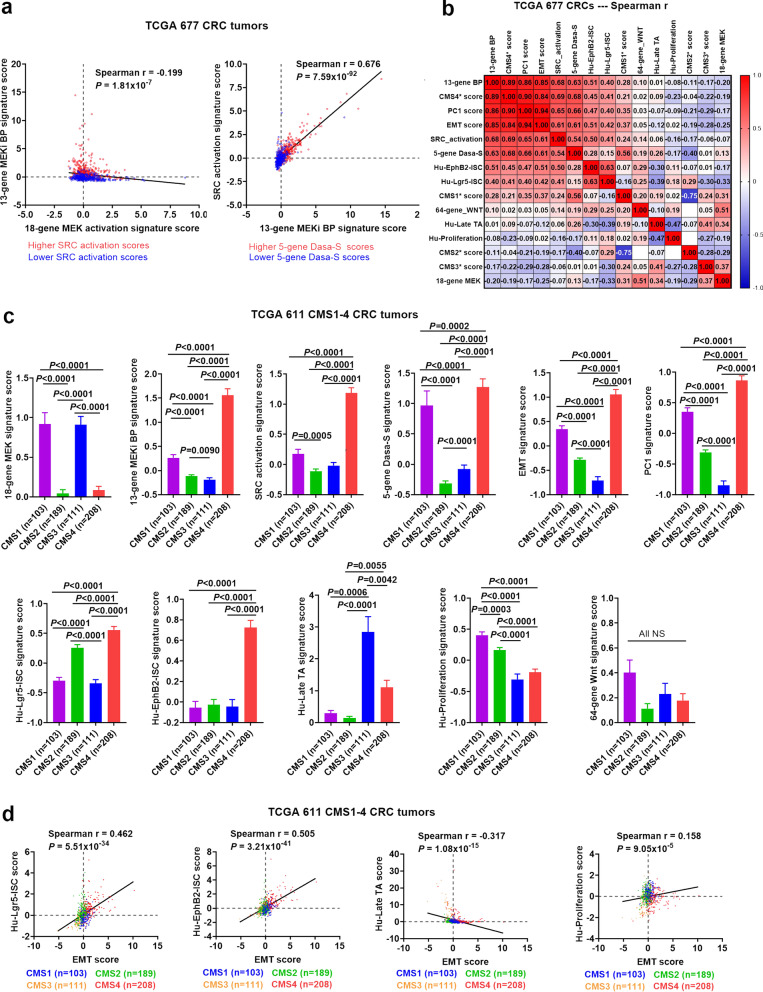
Methods: We classified 2250 primary and metastatic human CRC tumors by consensus molecular subtypes (CMS). For each tumor, we generated multiple gene expression signature scores measuring MEK pathway activation, MEKi "bypass" resistance, SRC activation, dasatinib sensitivity, EMT, PC1, Hu-Lgr5-ISC, Hu-EphB2-ISC, Hu-Late TA, Hu-Proliferation, and WNT activity. We carried out correlation, survival and other bioinformatic analyses. Validation analyses were performed in two independent publicly available CRC tumor datasets (n = 585 and n = 677) and a CRC cell line dataset (n = 154).

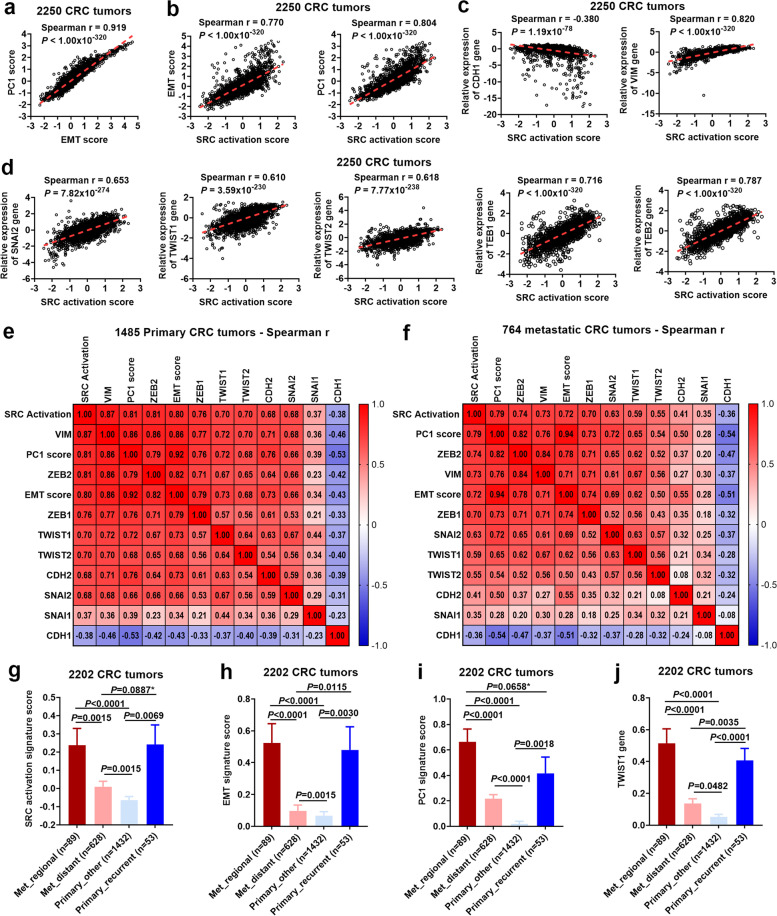
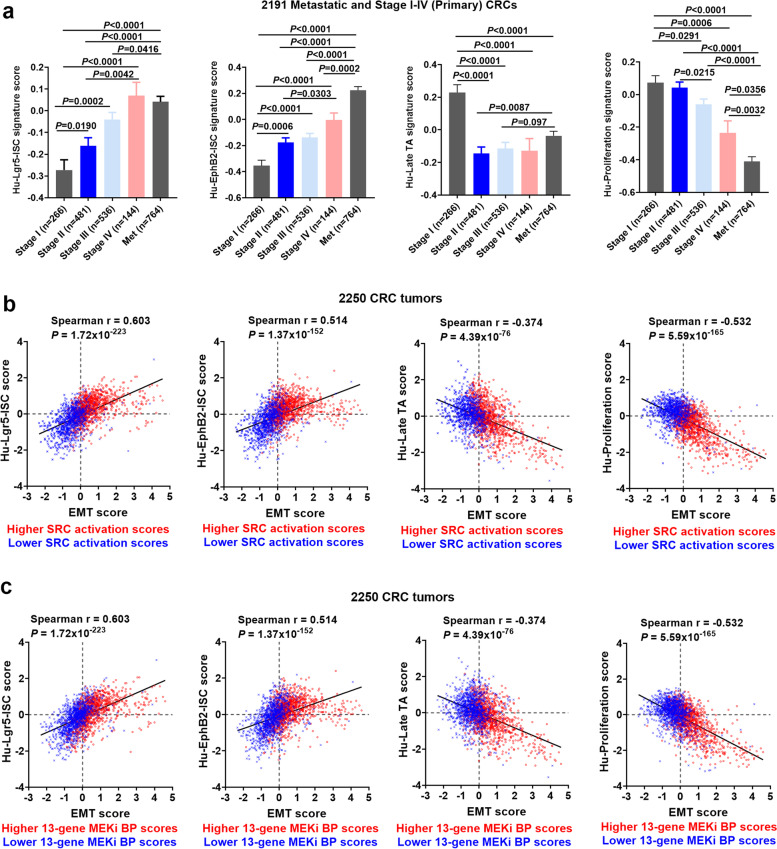
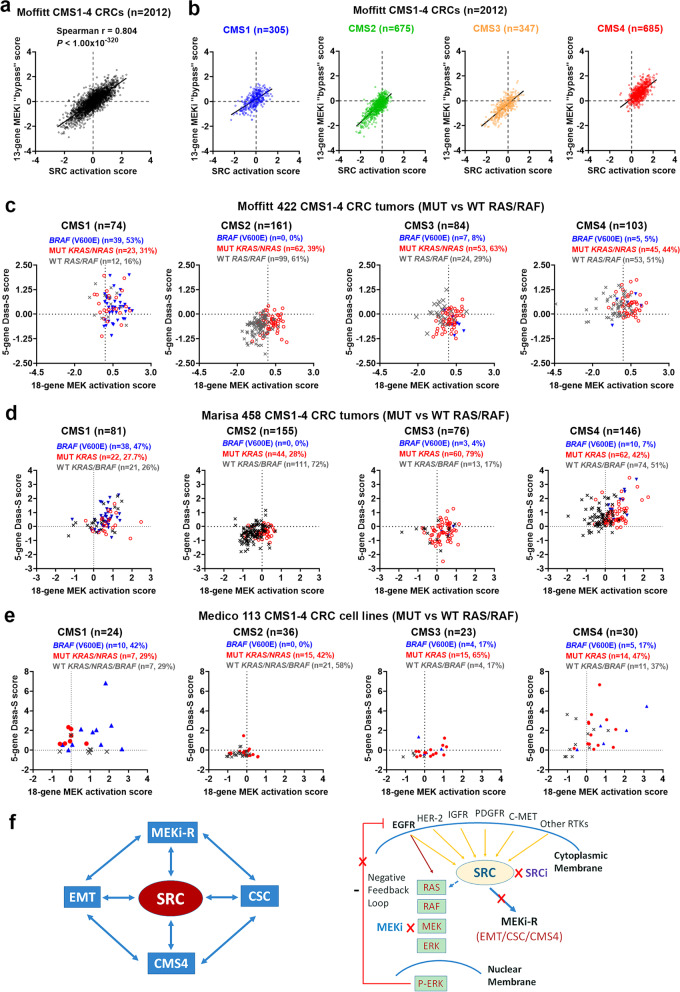
Results: Here we report a central role of SRC in mediating "bypass"-resistance to MEK inhibition (MEKi), primarily in cancer stem cells (CSCs). Our integrated and comprehensive gene expression signature analyses in 2250 CRC tumors reveal that MEKi-resistance is strikingly-correlated with SRC activation (Spearman P < 10-320), which is similarly associated with EMT (epithelial to mesenchymal transition), regional metastasis and disease recurrence with poor prognosis. Deeper analysis shows that both MEKi-resistance and SRC activation are preferentially associated with a mesenchymal CSC phenotype. This association is validated in additional independent CRC tumor and cell lines datasets. The CMS classification analysis demonstrates the strikingly-distinct associations of CMS1-4 subtypes with the MEKi-resistance and SRC activation. Importantly, MEKi + SRCi sensitivities are predicted to occur predominantly in the KRAS mutant, mesenchymal CSC-like CMS4 CRCs.

Conclusions: Large human tumor gene expression datasets representing CRC heterogeneity can provide deep biological insights heretofore not possible with cell line models, suggesting novel repurposed drug combinations. We identified SRC as a common targetable node--an Achilles' heel--in MEKi-targeted therapy-associated resistance in mesenchymal stem-like CRCs, which may help development of a biomarker-driven drug combination (MEKi + SRCi) to treat problematic subpopulations of CRC.

Keywords: CMS; Cancer stem cell; Colorectal cancer; EMT; Gene expression signature; MEK inhibitor; SRC; Targeted therapy.


Conflict of interest statement

The authors declare no competing interests.

Figures

Fig. 1
Fig. 1
Analysis of an 18-gene MEK pathway activation signature score versus a 13-gene MEKi “bypass” resistance signature score in 468 human CRCs. (a,b) mutant vs WT RAS/BRAF; (c,d) MSI vs MSS tumors; (e,f) primary vs metastatic tumors. Spearman correlation of 18-gene vs 13-gene scores is shown (left panels). (Right panels) bars represent Median with interquartile range and P values are for two-tailed Mann Whitney test. The 18 gene MEK activation and the 13 gene MEKi bypass signature scores show a poor correlation indicating that these two scores measure independent properties
Fig. 2
Fig. 2
The 13-gene MEKi “bypass” resistance score–-but not the 18-gene MEK pathway activation signature score–-was strongly correlated with SRC activation and 5-gene dasatinib sensitivity (Dasa-S) signature scores in 2250 human CRCs. (a-f) Spearman correlation analyses of the 18-gene MEK activation, 13-gene MEKi bypass, SRC activation and 5-gene Dasa-S signature scores in 2250 CRCs. Higher (> 0 median) vs lower (< 0, median) scores are indicated by red vs blue colors. Comparison of SRC activation scores in 2249 primary vs metastatic tumors (g) and in 1427 Stage I vs II vs III vs IV primary tumors (h). Bars represent Median with interquartile range. P values are for two-tailed Mann Whitney test (right panels). (i) The Kaplan–Meier (KM) survival analysis of SRC activation quartile scores in 2135 CRCs which had corresponding overall survival (OS) data. SRC activation/dependency is a prominent feature of tumors expressing the 13-gene bypass-resistance pathway activities. The SRC activation signature score was significantly associated with metastasis and primary tumor stage I-IV progression and poor overall survival
Fig. 3
Fig. 3
SRC activation was highly correlated with EMT and its associated genes and was strongly associated with regional metastasis and disease recurrence. Spearman correlation analyses in 2250 CRC tumors: (a) PC1 vs EMT signature scores and (b-d) SRC activation vs EMT, PC1, and CDH1 (an epithelial marker), VIM (a mesenchymal marker), as well as EMT-genes SMAIL2, TWIST1, TWIST2, ZEB1, and ZEB2, respectively. Signature cores were standardized by subtracting the score median and dividing by the score IQR (interquartile range). The gene expression levels of individual EMT-related genes were also similarly standardized to give relative gene expression levels (median expression was set to 0). Spearman correlation heatmaps in (e) 1485 primary tumors and (f) 764 metastatic tumors. Comparison of (g) SRC activation, (h) EMT, and (i) PC1 signature scores as well as (j) TWIST1 gene among 2202 metastatic (regional, distant) vs primary tumors (recurrent, other). Note that among 2250 tumors, 48 tumors without approximate data were excluded from analysis. Bars represent Mean with standard errors (SEM). P values are for two-tailed Mann Whitney test
Fig. 4
Fig. 4
The SRC activation and 13-gene MEKi “bypass” resistance signature scores were associated with “mesenchymal-like” stemness. (a) Comparison of Hu-Lgr5-ISC, Hu-EphB2-ISC, Hu-Late TA, and Hu-Proliferation signature scores among 2191 metastatic vs primary Stage IV vs III vs II vs I tumors. Bars represent Mean with standard errors (SEM). P values are for two-tailed Mann Whitney test. (b,c) Scatter plots of Hu-Lgr5-ISC, Hu-EphB2-ISC, Hu-Late TA, and Hu-Proliferation vs EMT signature scores, respectively (n = 2250 CRCs). Higher (> 0 median) vs lower (< 0, median) scores are indicated by red vs blue colors for (b) SRC activation and (c) 13-gene MEKi bypass resistance signatures
Fig. 5
Fig. 5
Correlation analysis of the signature scores with the CMS1-4 subtypes. (a) The CMS classification system was used to classify 2250 CRC tumors: CMS1 (n = 305), CMS2 (n = 675), CMS3 (n = 347) and CMS4 (n = 685) as well as CMS-NA (n = 238) (that are not applicable to any single CMS1-4 subtype). The Kaplan–Meier (KM) survival analysis shows that the CMS1 and CMS4 tumors (vs CMS2 and CMS3 tumors) were significantly associated with poor overall survival (OS). (b) Spearman correlation heatmap of the signature scores with CMS1*, CMS2*, CMS3* and CMS4* scores (measuring a propensity of a tumor to fall into CMS1, CMS2, CMS2 and CMS4 classes, respectively) in 2250 CRC tumors. 13-gene BP –- 13-gene MEKi bypass resistance; 5-gene Dasa-S –- 5-gene dasatinib sensitivity; 18-gene MEK –- 18-gene MEK pathway activation. (c-g) Comparison of the signature scores among the CMS1-4 subtypes (n = 2012). Bars represent Mean with standard errors (SEM). P values are for two-tailed Mann Whitney test. (h) Scatter plots of Hu-Lgr5-ISC, Hu-EphB2-ISC, Hu-Late TA, and Hu-Proliferation vs EMT signature scores. The CMS1-4 subtypes are indicated by red (CMS4) vs orange (CMS3) vs green (CMS2) vs blue (CMS1) colors
Fig. 6
Fig. 6
Validation analysis using the Marisa 585 CRC tumor dataset. (a) Scatter plots of the 18-gene MEK activation vs. the 13-gene MEKi bypass (BP) and the 13-gene MEKi BP vs. SRC activation signature scores in Marisa 585 CRCs. Higher (> 0 median) vs lower (< 0, median) scores are indicated by red vs blue colors. (b) Spearman correlation heatmap of the signature scores and CMS1*, CMS2*, CMS3* and CMS4* scores (measuring a propensity of a tumor to fall into CMS1, CMS2, CMS2 and CMS4 classes, respectively) in Marisa 585 CRC tumors. (c) Scatter plots of Hu-Lgr5-ISC, Hu-EphB2-ISC, Hu-Late TA, and Hu-Proliferation vs EMT signature scores, respectively (n = 585 CRCs). The quartile scores (Q1-Q4) of SRC activation signature are indicated by different colors (Q1, blue; Q2, green; Q3, yellow; Q4 red). (d) Comparison of the signature scores among the CMS1-4 subtypes (n = 498). Bars represent Mean with standard errors (SEM). P values are for two-tailed Mann Whitney test
Fig. 7
Fig. 7
Validation analysis using the TCGA 677 CRC tumor dataset. (a) Scatter plots of the 18-gene MEK activation vs. the 13-gene MEKi bypass (BP) and the 13-gene MEKi BP vs. SRC activation signature scores in TCGA 677 CRCs. Higher (> 0 median) vs lower (< 0, median) scores are indicated by red vs blue colors. (b) Spearman correlation heatmap of the signature scores and CMS1*, CMS2*, CMS3* and CMS4* scores (measuring a propensity of a tumor to fall into CMS1, CMS2, CMS2 and CMS4 classes, respectively) in TCGA 677 CRC tumors. (c) Comparison of the signature scores among the CMS1-4 subtypes (n = 611). Bars represent Mean with standard errors (SEM). P values are for two-tailed Mann Whitney test. (d) Scatter plots of Hu-Lgr5-ISC, Hu-EphB2-ISC, Hu-Late TA, and Hu-Proliferation vs EMT signature scores. The CMS1-4 subtypes are indicated by red (CMS4) vs orange (CMS3) vs green (CMS2) vs blue (CMS1) colors
Fig. 8
Fig. 8
MEKi + SRCi were predicted to occur predominantly in the KRAS-mutant, CMS4 CRCs. (a) Spearman correlation analysis of the 13-gene MEKi bypass vs. SRC activation signature scores in Moffitt 2012 CMS1-4 CRCs. (b) Scatter plots of 13-gene MEKi bypass vs. SRC activation scores are shown in CMS1 (n = 305), CMS2 (n = 675), CMS3 (n = 347) and CMS4 (n = 685), respectively, which clearly illustrate that CMS4 CRCs were preferentially associated with both higher 13-gene MEKi bypass and higher SRC activation scores (see the “CMS4” panel, the “right and upper” quadrant). (c) The 18-gene MEK activation versus the 5-gene Dasa-S signature scores were plotted in each of the CMS1-4 subtypes (n = 422 Moffitt CRC tumors with the mutation status of KRAS/NRAS/BRAF). BRAF (V600E) (blue); MUT KRAS/NRAS (red); WT RAS/RAF (gray). The 18-gene MEK activation versus the 5-gene Dasa-S signature scores were plotted in each of the CMS1-4 subtypes in (d) Marisa 458 CMS1-4 CRC tumors with MUT and WT KRAS/BRAF data and (e) Medico 113 CMS1-4 CRC cell lines with MUT and WT KRAS/BRAF data. These data suggest problematic RAS-mutant CMS4 stem-like tumors may be sensitive to the novel drug combination of a SRCi + MEKi. f. A proposed model illustrates a central role of SRC in mediating resistance to MEK inhibition in mesenchymal-like cancer stem cells. SRC may serve as a common targetable node, suggesting potential for a new biomarker-driven (MEKi + SRCi) drug combination targeting problematic SRC-mediated, mesenchymal CSCs, especially KRAS-mutant CMS4 CRCs

Similar articles

Cited by

References

    1. Schubbert S, Shannon K, Bollag G. Hyperactive Ras in developmental disorders and cancer. Nat Rev Cancer. 2007;7(4):295–308. - PubMed
    1. Cancer Genome Atlas N Comprehensive molecular characterization of human colon and rectal cancer. Nature. 2012;487(7407):330–7. - PMC - PubMed
    1. Schell MJ, Yang M, Teer JK, Lo FY, Madan A, Coppola D, et al. A multigene mutation classification of 468 colorectal cancers reveals a prognostic role for APC. Nat Commun. 2016;7:11743. - PMC - PubMed
    1. Schell MJ, Yang M, Missiaglia E, Delorenzi M, Soneson C, Yue B, et al. A Composite Gene Expression Signature Optimizes Prediction of Colorectal Cancer Metastasis and Outcome. Clin Cancer Res. 2016;22(3):734–745. - PMC - PubMed
    1. Caunt CJ, Sale MJ, Smith PD, Cook SJ. MEK1 and MEK2 inhibitors and cancer therapy: the long and winding road. Nat Rev Cancer. 2015;15(10):577–592. - PubMed

MeSH terms

Substances