

Functional feeds marginally alter immune expression and microbiota of Atlantic salmon (Salmo salar) gut, gill, and skin mucosa though evidence of tissue-specific signatures and host-microbe coadaptation remain
- PMID: 35272695
- PMCID: PMC8908560
- DOI: 10.1186/s42523-022-00173-0
Functional feeds marginally alter immune expression and microbiota of Atlantic salmon (Salmo salar) gut, gill, and skin mucosa though evidence of tissue-specific signatures and host-microbe coadaptation remain
Abstract
Background: Mucosal surfaces of fish provide cardinal defense against environmental pathogens and toxins, yet these external mucosae are also responsible for maintaining and regulating beneficial microbiota. To better our understanding of interactions between host, diet, and microbiota in finfish and how those interactions may vary across mucosal tissue, we used an integrative approach to characterize and compare immune biomarkers and microbiota across three mucosal tissues (skin, gill, and gut) in Atlantic salmon receiving a control diet or diets supplemented with mannan-oligosaccharides, coconut oil, or both. Dietary impacts on mucosal immunity were further evaluated by experimental ectoparasitic sea lice (Lepeophtheirus salmonis) challenge.
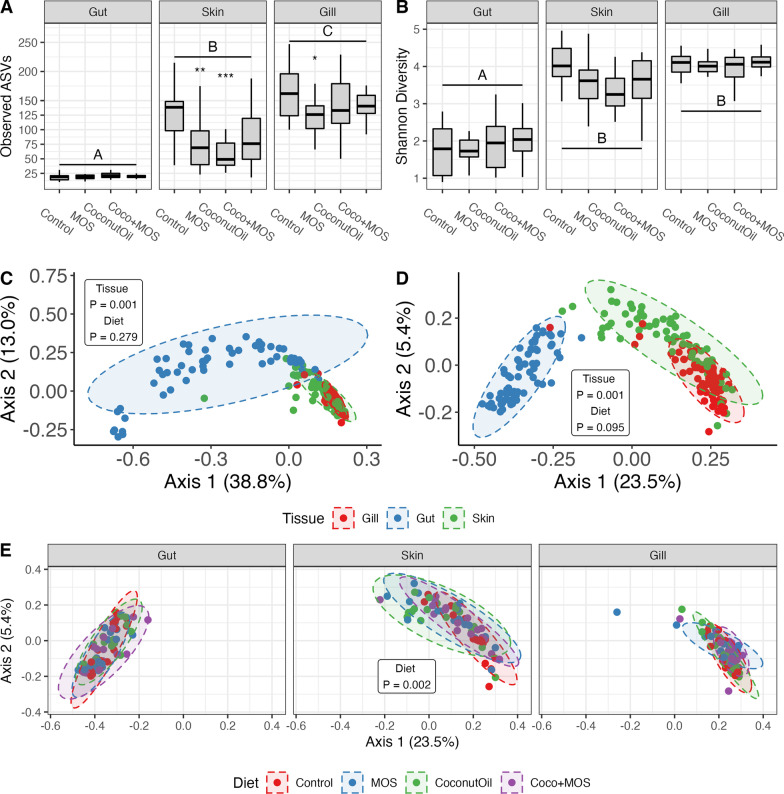
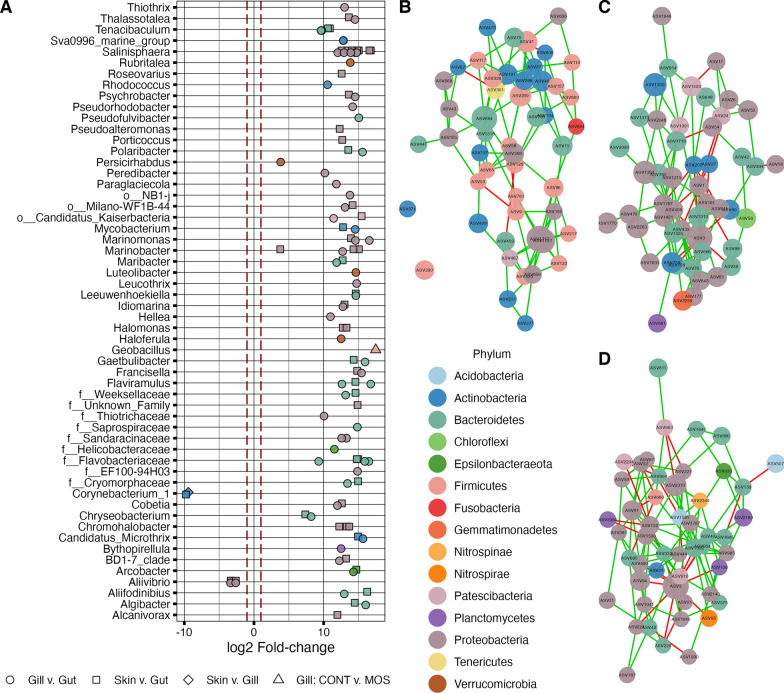
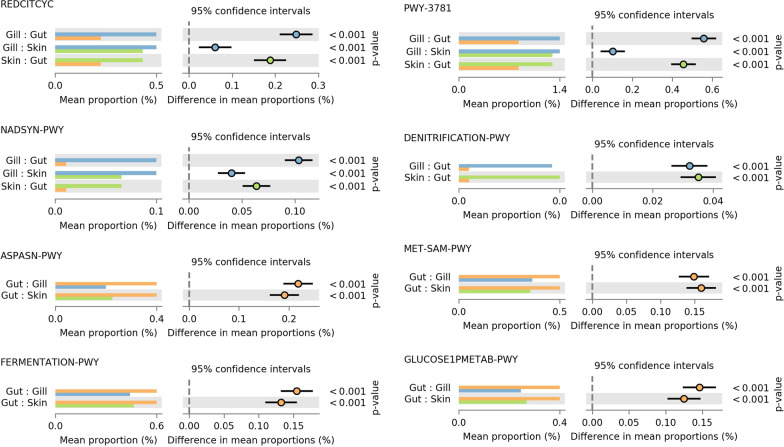
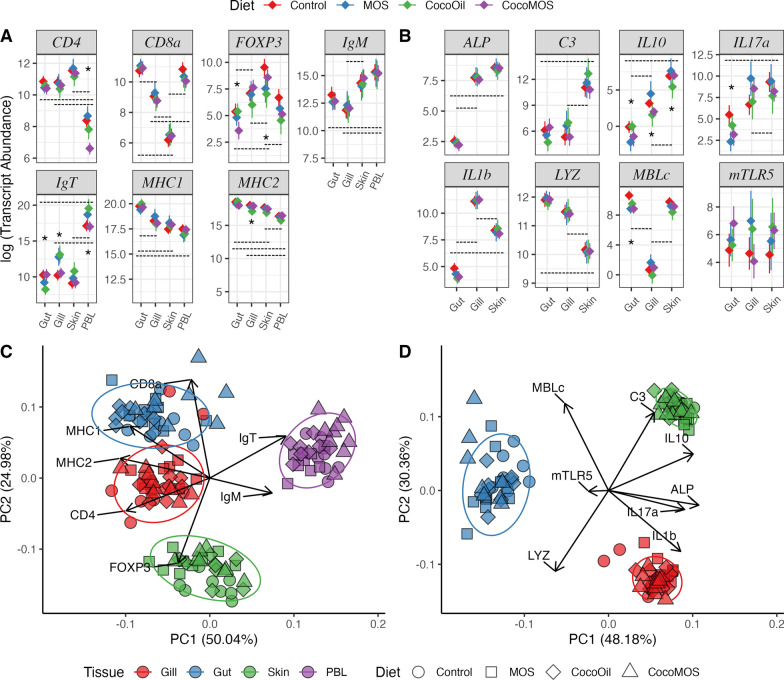
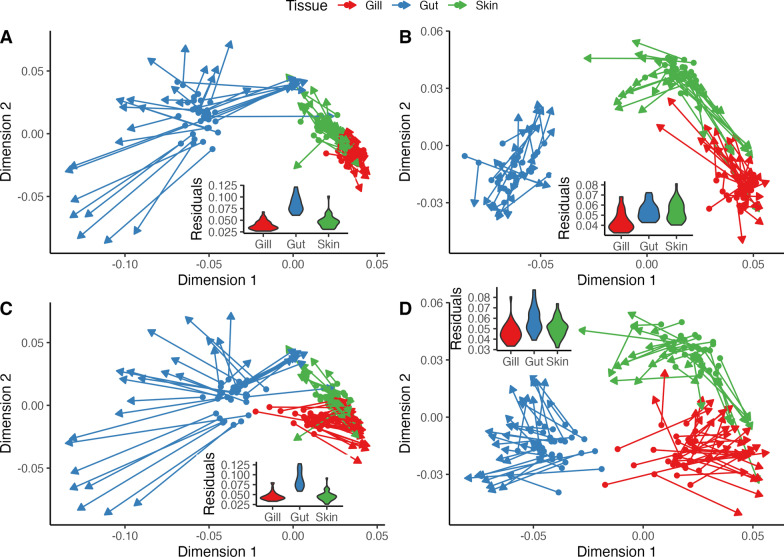
Results: Fish grew to a final size of 646.5 g ± 35.8 during the 12-week trial, with no dietary effects on growth or sea lice resistance. Bacterial richness differed among the three tissues with the highest richness detected in the gill, followed by skin, then gut, although dietary effects on richness were only detected within skin and gill. Shannon diversity was reduced in the gut compared to skin and gill but was not influenced by diet. Microbiota communities clustered separately by tissue, with dietary impacts on phylogenetic composition only detected in the skin, although skin and gill communities showed greater overlap compared to the gut according to overall composition, differential abundance, and covariance networks. Inferred metagenomic functions revealed preliminary evidence for tissue-specific host-microbiota coadaptation, as putative microbiota functions showed ties to the physiology of each tissue. Immune gene expression profiles displayed tissue-specific signatures, yet dietary effects were also detected within each tissue and peripheral blood leukocytes. Procrustes analysis comparing sample-matched multivariate variation in microbiota composition to that of immune expression profiles indicated a highly significant correlation between datasets.
Conclusions: Diets supplemented with functional ingredients, namely mannan-oligosaccharide, coconut oil, or a both, resulted in no difference in Atlantic salmon growth or resistance to sea lice infection. However, at the molecular level, functional ingredients caused physiologically relevant changes to mucosal microbiota and host immune expression. Putative tissue-specific metagenomic functions and the high correlation between expression profiles and microbiota composition suggest host and microbiota are interdependent and coadapted in a tissue-specific manner.
Keywords: Atlantic salmon; Coconut oil; Fish microbiome; Functional feeds; Gene expression; Host–microbiota interactions; Immune regulation; Mannan-oligosaccharides; Sea lice.
© 2022. The Author(s).
Conflict of interest statement
The authors declare no competing interests.
Figures
Similar articles
-
Transcriptome Analysis of Atlantic Salmon (Salmo salar) Skin in Response to Sea Lice and Infectious Salmon Anemia Virus Co-Infection Under Different Experimental Functional Diets.Front Immunol. 2022 Jan 3;12:787033. doi: 10.3389/fimmu.2021.787033. eCollection 2021. Front Immunol. 2022. PMID: 35046944 Free PMC article.
-
Alternative Protein Sources in the Diet Modulate Microbiota and Functionality in the Distal Intestine of Atlantic Salmon (Salmo salar).Appl Environ Microbiol. 2017 Feb 15;83(5):e02615-16. doi: 10.1128/AEM.02615-16. Print 2017 Mar 1. Appl Environ Microbiol. 2017. PMID: 27986728 Free PMC article.
-
Microbial Ecology of Atlantic Salmon (Salmo salar) Hatcheries: Impacts of the Built Environment on Fish Mucosal Microbiota.Appl Environ Microbiol. 2020 Jun 2;86(12):e00411-20. doi: 10.1128/AEM.00411-20. Print 2020 Jun 2. Appl Environ Microbiol. 2020. PMID: 32303543 Free PMC article.
-
Enhanced transcriptomic responses in the Pacific salmon louse Lepeophtheirus salmonis oncorhynchi to the non-native Atlantic Salmon Salmo salar suggests increased parasite fitness.BMC Genomics. 2017 Jan 30;18(1):110. doi: 10.1186/s12864-017-3520-1. BMC Genomics. 2017. PMID: 28137252 Free PMC article.
-
Recreating Human Skin In Vitro: Should the Microbiota Be Taken into Account?Int J Mol Sci. 2024 Jan 18;25(2):1165. doi: 10.3390/ijms25021165. Int J Mol Sci. 2024. PMID: 38256238 Free PMC article. Review.
Cited by
-
Microbial community structure and functional characteristics across the mucosal surfaces of olive flounder (Paralichthys olivaceus).Front Microbiol. 2025 May 21;16:1587288. doi: 10.3389/fmicb.2025.1587288. eCollection 2025. Front Microbiol. 2025. PMID: 40469739 Free PMC article.
-
Comparative study of the gut microbial communities collected by scraping and swabbing in a fish model: a comprehensive guide to promote non-lethal procedures for gut microbial studies.Front Vet Sci. 2024 Mar 22;11:1374803. doi: 10.3389/fvets.2024.1374803. eCollection 2024. Front Vet Sci. 2024. PMID: 38585300 Free PMC article.
-
Dietary Chlorella vulgaris supplementation modulates health, microbiota and the response to oxidative stress of Atlantic salmon.Sci Rep. 2024 Oct 10;14(1):23674. doi: 10.1038/s41598-024-72531-8. Sci Rep. 2024. PMID: 39389986 Free PMC article.
-
Impacts of environmentally relevant concentrations of antibiotic cocktails on the skin microbiome of Eurasian carp (Cyprinus carpio).Anim Microbiome. 2025 Jul 8;7(1):73. doi: 10.1186/s42523-025-00434-8. Anim Microbiome. 2025. PMID: 40629427 Free PMC article.
-
Analyzing bacterial networks and interactions in skin and gills of Sparus aurata with microalgae-based additive feeding.Sci Rep. 2024 Dec 30;14(1):31696. doi: 10.1038/s41598-024-81822-z. Sci Rep. 2024. PMID: 39738183 Free PMC article.
References
-
- Adams A. Progress, challenges and opportunities in fish vaccine development. Fish Shellfish Immunol. 2019;90:210–214. - PubMed
-
- Ángeles Esteban M. An overview of the immunological defenses in fish skin. ISRN Immunol 2012.
-
- Ashtiani M, Mirzaie M, Jafari M. CINNA: an R/CRAN package to decipher central informative nodes in network analysis. Bioinformatics. 2019;35:1436–1437. - PubMed
-
- Austbø L, Aas IB, König M, Weli SC, Syed M, Falk K, Koppang EO. Transcriptional response of immune genes in gills and the interbranchial lymphoid tissue of Atlantic salmon challenged with infectious salmon anemia virus. Dev Comp Immunol. 2014;45:107–114. - PubMed
Grants and funding
LinkOut - more resources
Full Text Sources