. 2022 Mar 10:376:e068208.
doi: 10.1136/bmj-2021-068208.

Global, regional, and national burden of diseases and injuries for adults 70 years and older: systematic analysis for the Global Burden of Disease 2019 Study

Collaborators

Global, regional, and national burden of diseases and injuries for adults 70 years and older: systematic analysis for the Global Burden of Disease 2019 Study

GBD 2019 Ageing Collaborators. BMJ. .

Abstract

Objectives: To use data from the Global Burden of Diseases, Injuries, and Risk Factors Study 2019 (GBD 2019) to estimate mortality and disability trends for the population aged ≥70 and evaluate patterns in causes of death, disability, and risk factors.

Design: Systematic analysis.

Setting: Participants were aged ≥70 from 204 countries and territories, 1990-2019.

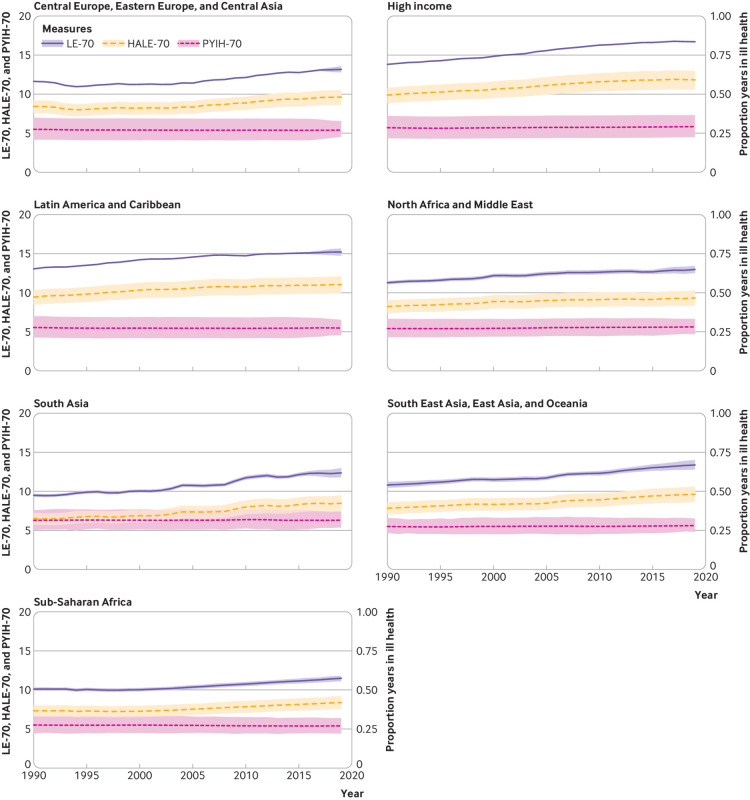
Main outcomes measures: Years of life lost, years lived with disability, disability adjusted life years, life expectancy at age 70 (LE-70), healthy life expectancy at age 70 (HALE-70), proportion of years in ill health at age 70 (PYIH-70), risk factors, and data coverage index were estimated based on standardised GBD methods.

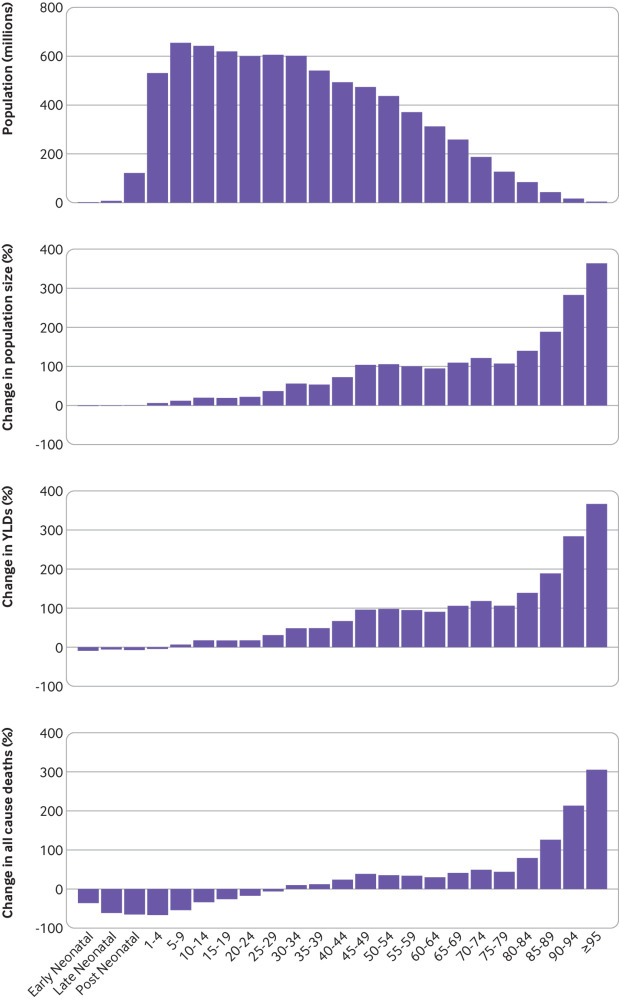
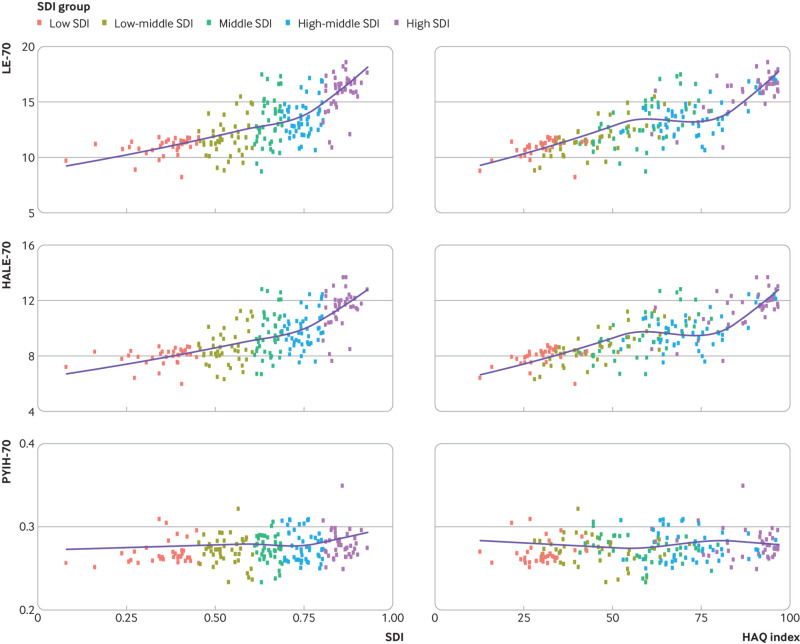
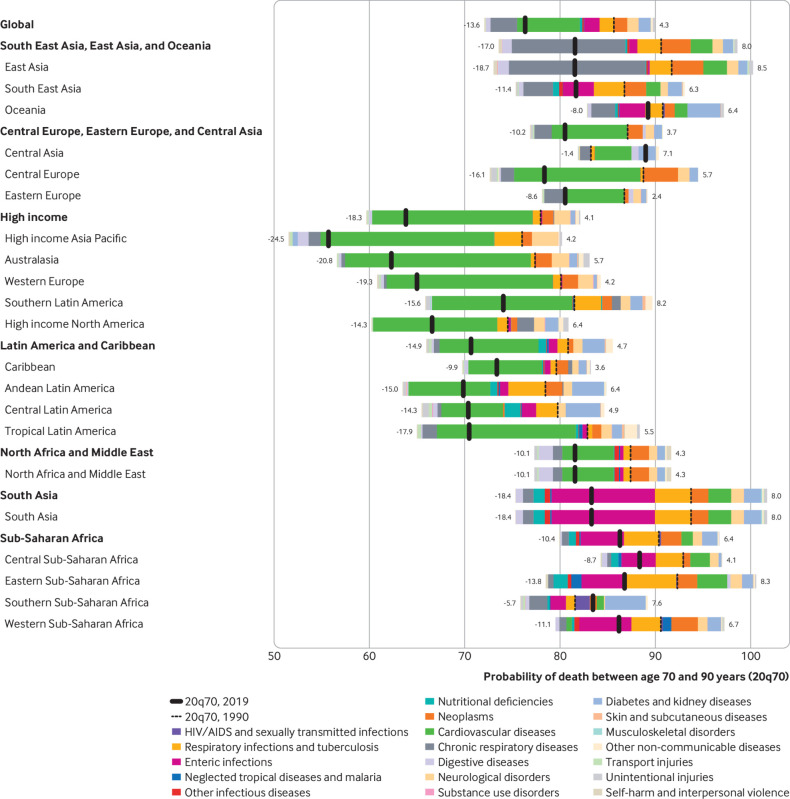
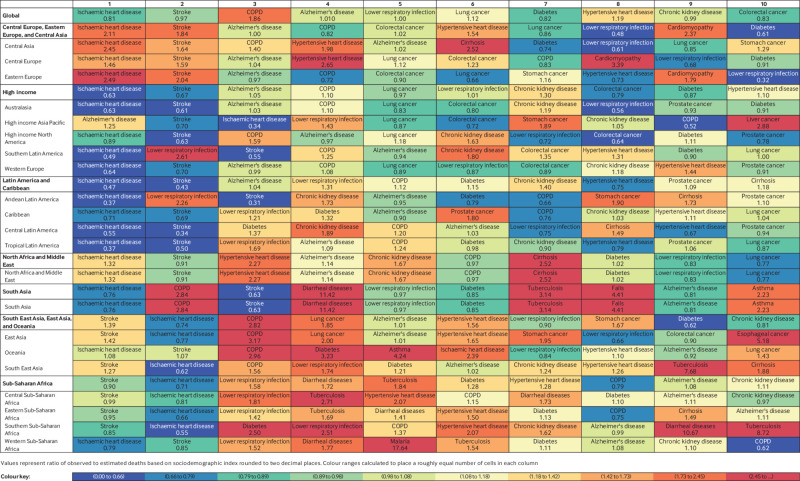
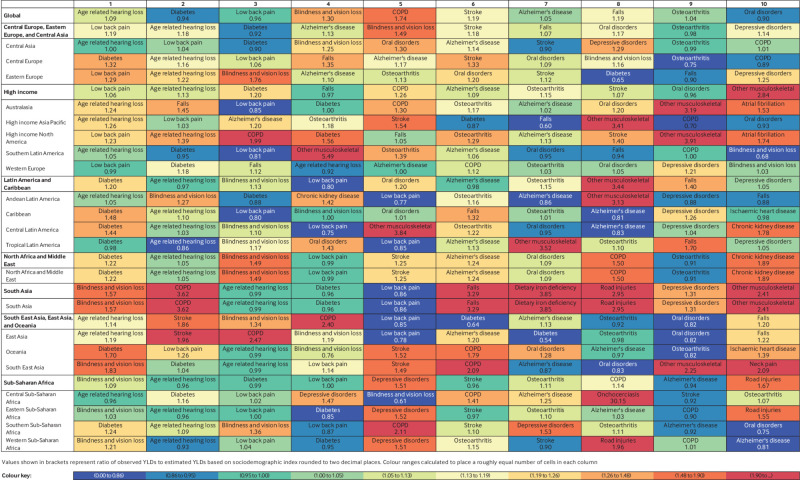
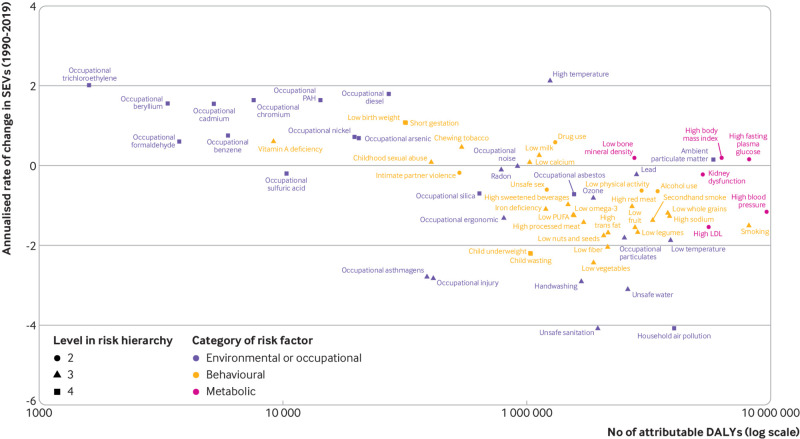
Results: Globally the population of older adults has increased since 1990 and all cause death rates have decreased for men and women. However, mortality rates due to falls increased between 1990 and 2019. The probability of death among people aged 70-90 decreased, mainly because of reductions in non-communicable diseases. Globally disability burden was largely driven by functional decline, vision and hearing loss, and symptoms of pain. LE-70 and HALE-70 showed continuous increases since 1990 globally, with certain regional disparities. Globally higher LE-70 resulted in higher HALE-70 and slightly increased PYIH-70. Sociodemographic and healthcare access and quality indices were positively correlated with HALE-70 and LE-70. For high exposure risk factors, data coverage was moderate, while limited data were available for various dietary, environmental or occupational, and metabolic risks.

Conclusions: Life expectancy at age 70 has continued to rise globally, mostly because of decreases in chronic diseases. Adults aged ≥70 living in high income countries and regions with better healthcare access and quality were found to experience the highest life expectancy and healthy life expectancy. Disability burden, however, remained constant, suggesting the need to enhance public health and intervention programmes to improve wellbeing among older adults.


Conflict of interest statement

Competing interests: All authors have completed the ICMJE uniform disclosure form at www.icmje.org/disclosure-of-interest/ and declare support from CHTF, the Bill and Melinda Gates Foundation, IPEP, Instituto de Salud Carlos III—Spain, and FEDER for the submitted work; no financial relationships with any organisations that might have an interest in the submitted work in the previous three years; no other relationships or activities that could appear to have influenced the submitted work.

Figures

Fig 1
Fig 1
Global population, years lived with disability, and all-cause mortality transition by age group, 1990-2019. Distribution of global population by age group was estimated as simple difference from 1990 to 2019 (top panel), or as percentage change during the same period (second panel). Percentage differences in years lived with disability and all cause mortality as estimated by GBD 2019 are also provided for all age groups from 1990 to 2019 (lower two panels) to indicate quality of life lost due to illness before death and to quantify all cause mortality. All age groups have been included to provide a comparator when assessing health loss in older adults. GBD=Global Burden of Diseases, Injuries, and Risk Factors Study; YLD=years lived with disability
Fig 2
Fig 2
Life expectancy at age 70 (LE-70), healthy life expectancy at age 70 (HALE-70), and proportion of life years spent in ill health at age 70 (PYIH-70) by location for both sexes, 1990-2019. Shaded sections indicate 95% uncertainty intervals. GBD=Global Burden of Diseases, Injuries, and Risk Factors Study
Fig 3
Fig 3
Epidemiological transition between life expectancy at age 70 (LE-70), healthy life expectancy at age 70 (HALE-70), proportion of years spent in ill health at age 70 (PYIH-70), and sociodemographic index (SDI) and healthcare access and quality (HAQ) index for both sexes, 2019. Dots represent countries and different colour coding indicates SDI categorisation
Fig 4
Fig 4
Relation between level 2 causes of death and changes in probability of death between ages 70 and 90 years (20q70) for both sexes by location, 1990-2019. Different colour bars represent different causes of death. All causes to the right of the dotted black line increased from 1990 to 2019, and all those to the left decreased over the same time period. At the global level, the probability of death decreased mainly due to reductions in cardiovascular diseases, chronic respiratory diseases, respiratory infections and tuberculosis, and enteric infections (−13.6% in total), while the probability of death increased due to increases in neoplasms, neurological disorders, diabetes, and kidney diseases (+4.3% in total). 20q70=probability ‘q’ of death for a period of 20 years starting at age 70
Fig 5
Fig 5
Ten leading causes of total deaths with ratio of observed to expected deaths in 2019 by location for population aged ≥70, both sexes. Causes are ranked according to global estimates of deaths and colour coded based on ratio of observed to expected rates. Shades of blue represent lower observed deaths than expected rates based on sociodemographic index whereas red indicates observed deaths exceeded expected rates. Ratios are listed in each cell; ratios greater than one indicate that observed levels exceeded expected levels based on sociodemographic index. COPD=chronic obstructive pulmonary disease
Fig 6
Fig 6
Ten leading causes of total years lived with disability (YLDs) with ratio of observed to expected YLDs in 2019 by location for population aged ≥70, both sexes. Causes are ranked according to global estimates of YLDs and colour coded based on ratio of observed to expected rates. Shades of blue represent lower observed YLDs than expected rates based on sociodemographic index whereas red indicates observed YLDs exceeded expected rates. Ratios are listed in each cell; ratios greater than one indicate that observed levels exceeded expected levels based on sociodemographic index. COPD=chronic obstructive pulmonary disease
Fig 7
Fig 7
Comparison of annualised rate of change in risk exposure measured by summary exposure values (SEVs) for population aged ≥70 (both sexes) from 1990 to 2019 with total attributable disability adjusted life years (DALYs) for all risk factors in 2019. The fraction of disability adjusted life years attributed to each risk factor is depicted in relation to their corresponding population summary exposure values in 2019. Risk factors are colour coded by environmental or occupational (purple), behavioural (yellow), or metabolic (pink) risk factors, and different levels of the risk hierarchy are indicated by different shapes. LDL=low density lipoprotein; PUFA=polyunsaturated fat

Similar articles

Cited by

References

    1. Development in an Ageing World. World Economic and Social Survey 2007. https://www.un.org/en/development/desa/policy/wess/wess_archive/2007wess... (accessed 27 Jan 2018).
    1. European Commission. Population ageing in Europe: facts, implications and policies 2014. https://op.europa.eu/en/publication-detail/-/publication/1e7549b4-2333-4....
    1. Knickman JR, Snell EK. The 2030 problem: caring for aging baby boomers. Health Serv Res 2002;37:849-84. 10.1034/j.1600-0560.2002.56.x. - DOI - PMC - PubMed
    1. Crow RS, Lohman MC, Titus AJ, et al. Mortality risk along the frailty spectrum: data from the National Health and Nutrition Examination Survey 1999 to 2004. J Am Geriatr Soc 2018;66:496-502. 10.1111/jgs.15220. - DOI - PMC - PubMed
    1. Rowe JW, Kahn RL. Successful Aging 2.0: conceptual expansions for the 21st century. J Gerontol B Psychol Sci Soc Sci 2015;70:593-6. 10.1093/geronb/gbv025. - DOI - PubMed

Publication types