. 2022 Mar 1;36(5-6):331-347.
doi: 10.1101/gad.349172.121. Epub 2022 Mar 10.

Nucleolar-based Dux repression is essential for embryonic two-cell stage exit

Affiliations

Nucleolar-based Dux repression is essential for embryonic two-cell stage exit

Sheila Q Xie et al. Genes Dev. .

Abstract

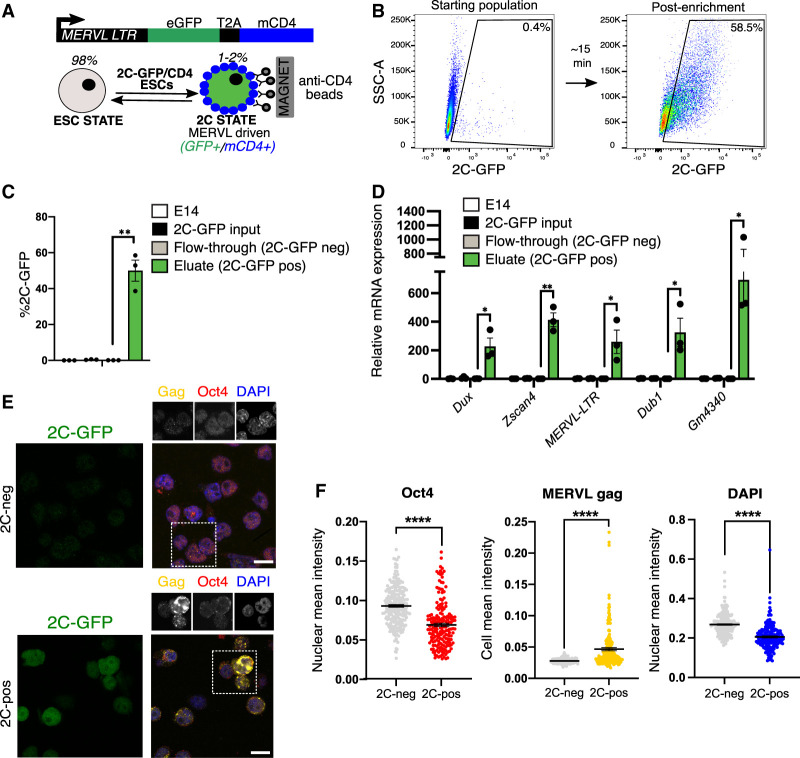
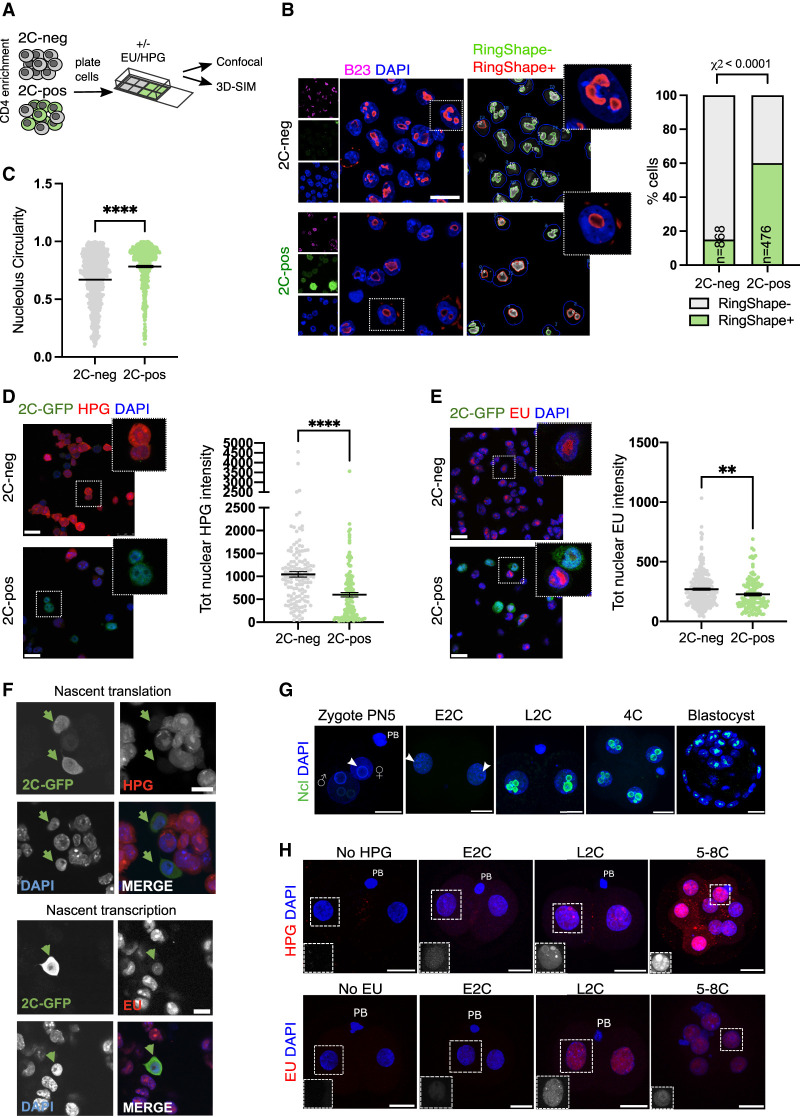
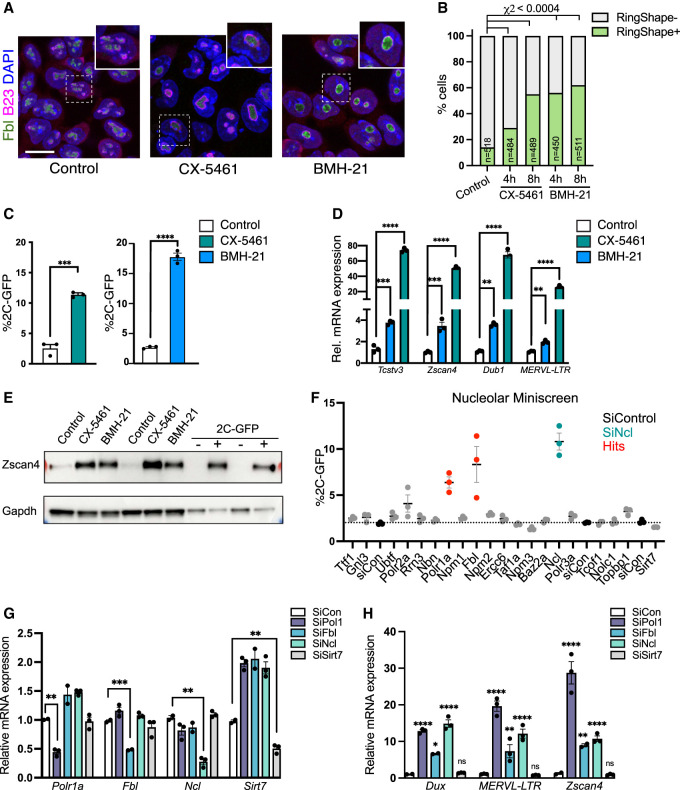
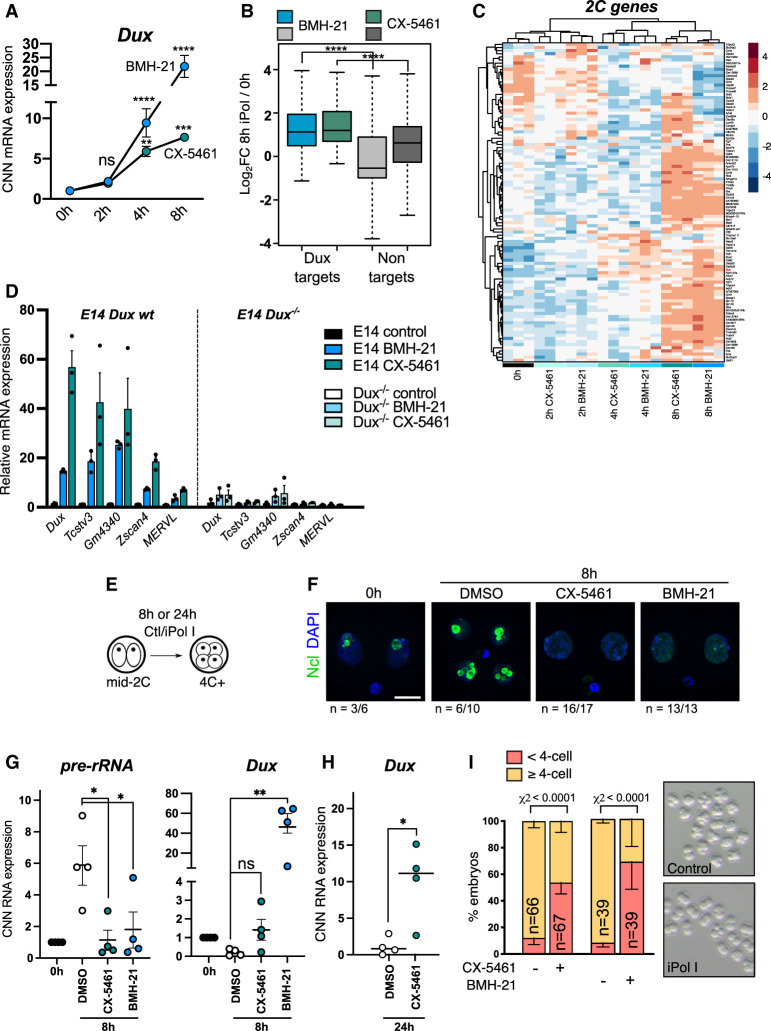
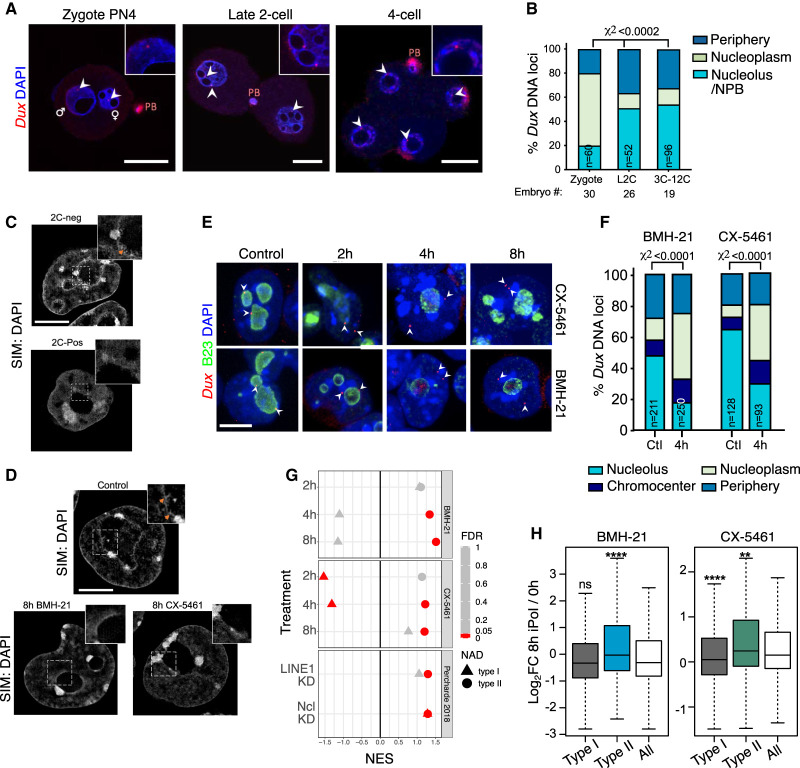
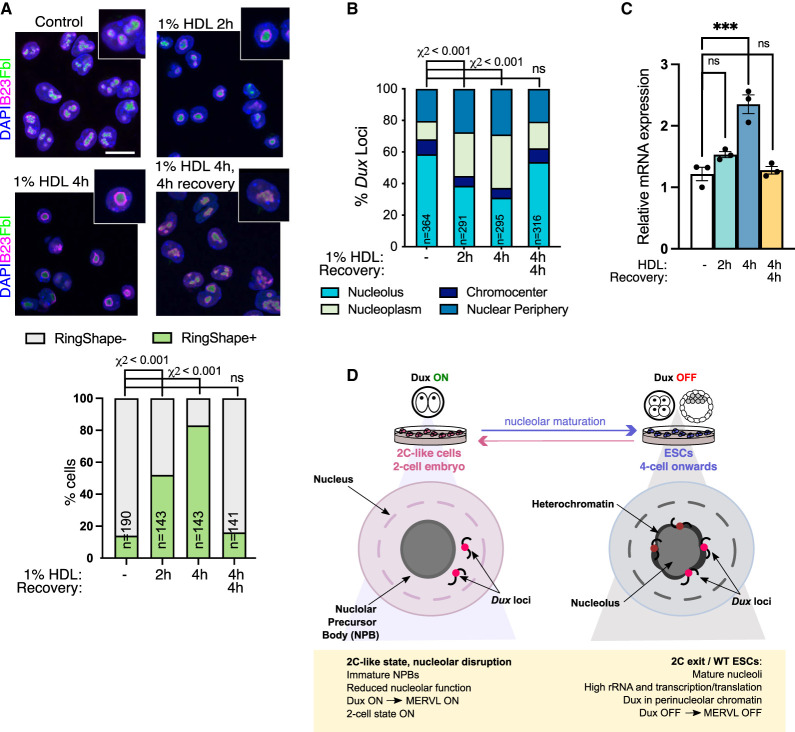
Upon fertilization, the mammalian embryo must switch from dependence on maternal transcripts to transcribing its own genome, and in mice this involves the transient up-regulation of MERVL transposons and MERVL-driven genes at the two-cell stage. The mechanisms and requirement for MERVL and two-cell (2C) gene up-regulation are poorly understood. Moreover, this MERVL-driven transcriptional program must be rapidly shut off to allow two-cell exit and developmental progression. Here, we report that robust ribosomal RNA (rRNA) synthesis and nucleolar maturation are essential for exit from the 2C state. 2C-like cells and two-cell embryos show similar immature nucleoli with altered structure and reduced rRNA output. We reveal that nucleolar disruption via blocking RNA polymerase I activity or preventing nucleolar phase separation enhances conversion to a 2C-like state in embryonic stem cells (ESCs) by detachment of the MERVL activator Dux from the nucleolar surface. In embryos, nucleolar disruption prevents proper nucleolar maturation and Dux silencing and leads to two- to four-cell arrest. Our findings reveal an intriguing link between rRNA synthesis, nucleolar maturation, and gene repression during early development.

Keywords: 2C-like state; Dux; MERVL; nucleolus; totipotency.


Figures

Figure 1.
Figure 1.
A new reporter cell line for purification of 2C-like cells. (A) Reporter design: A previous MERVL-GFP reporter (Ishiuchi et al. 2015) was modified to contain the extracellular portion of the CD4 antigen downstream from GFP and a T2A cleavage element, allowing rapid 2C-like cell purification by anti-CD4 beads. (B) Representative flow cytometry plot depicting proportion of typical 2C-GFP+ enriched cells (>60% pure, 2C-pos) cells before (left) and after (right) CD4-based 2C enrichment. (C) Percent recovery of 2C-GFP-pos cells after CD4-based purification, comparing CD4+ cells (eluate) and CD4 cells (flowthrough). Data are mean ± SEM of three experiments. (D) qRT-PCR validation of high levels of 2C-specific genes and MERVL in the 2C-pos, CD4+ eluate compared with 2C-neg, CD4 fraction and the starting population. Flowthrough cells are set to 1. Data are mean ± SEM of three experiments. (E) Representative confocal images and (F) quantification of levels of Oct4 and MERVL gag proteins and DAPI in 2C-pos versus 2C-neg cells following CD4-based purification. Scale bar, 20 µm. All P-values represent two-tailed, unpaired Student's t-test, with multiple comparisons correction where relevant.
Figure 2.
Figure 2.
2C-like cells and embryos have altered nucleolar morphology and function. (A) Experimental set-up for 2C-like cell profiling: Following CD4-based enrichment, 2C-neg/pos populations were plated into Matrigel-coated chambers for a minimum of 1 h before the indicated downstream applications. (B) Immunofluorescence images and quantification (RingShape+, CellProfiler) appearance in 2C-pos/neg cells, revealing that 2C-like cell nucleoli (2C-GFP, green), stained by the nucleolar marker B23 (Npm1, purple), have rounded, ring-like morphology. (n) Number of cells scored. Scale bar, 20 µm. (C) Nucleolar circularity is significantly increased in 2C-like cells. Very small nucleoli (area <100 pixels) were filtered out as can typically generate unreliable measurements (see the Materials and Methods). (D,E) Immunofluorescence images and quantification of nascent translation (D) and nascent transcription (E) rates in 2C-pos versus 2C-neg cells via HPG or EU Click-iT incorporation experiments, respectively. Scale bar, 25 µm. (F) Confirmation of reduced transcription and translation in 2C-like (2C-GFP+) cells within unsorted populations, using an independent 2C-GFP cell line (Percharde et al. 2018). Scale bar, 10 µm. (G) Nucleolar (nucleolin [Ncl]) staining in in vitro cultured embryos, showing the emergence of Ncl+ nucleoli at the late two-cell stage (L2C). (E2C) Early two-cell stage, (PB) polar body. White arrows denote NPBs. Scale bar, 20 µm. (H) Analysis of nascent transcription/translation in embryos by EU/HPG assays, respectively. Scale bar, 20 µm. Insets show EU/HPG staining alone (grayscale) in a representative blastomere from each image. P-values represent χ2 test (B) and two-tailed Student's t-test (CE), with Welch's correction for uneven variance where relevant; data represent at least two independent experiments.
Figure 3.
Figure 3.
Nucleolar disruption induces the 2C-like state. (A) Representative immunofluorescence images following staining for nucleolar markers (fibrillarin [Fbl]) and B23 4 h after RNA Pol I inhibition (iPol I) with either CX-5461 or BMH-21. Scale bar, 20 µm. (B) Quantification of the percentage of cells with ring-like (RingShape+) nucleoli 4 and 8 h after iPol I. P-values, χ2 test adjusted for multiple comparisons. (n) Number of cells. (C) Percentage of 2C-GFP+ cells following overnight (16- to 24-h) treatment with 0.25 µM iPol I. Data are mean ± SEM. n = 3 biological replicates representative of three or more experiments. (D) qRT-PCR analysis of 2C-specific genes and TEs following iPol I as in C, with P-values in C and D representing two-tailed t-test with two-stage multiple comparisons correction. (E) Western blots showing up-regulation of 2C-specific protein Zscan4 after 16- to 24-h iPol I in ESCs, shown next to purified 2C-GFP/CD4+/− cells. Replicates from two experiments are shown. (F) Flow cytometry analysis of percentage of 2C-GFP+ cells following siRNA knockdown of the indicated factors. Red samples indicate a Z-score of >1, with KD of Ncl shown as a positive control (teal). Data are mean ± SEM of three biological replicates, representative of two repeats of the screen. (G,H) Validation by qRT-PCR of siRNA-mediated knockdown of the indicated factors (G) and up-regulation of 2C-specific genes (H) showing mean ± SEM of n = 2–3 biological replicates, representative of two experiments. P-values, two-way ANOVA followed by Dunnett's multiple comparisons test.
Figure 4.
Figure 4.
Nucleolar disruption causes Dux reactivation in ESCs and embryos. (A) Cell number-normalized (CNN) qRT-PCR time-course analysis of Dux up-regulation following iPol I. Data were analyzed as CNN to exclude potential global effects of iPol I on transcription; however, the same results are seen with Rpl7/H2A normalization. Data are mean ± SEM. n = 3 biological replicates. P-values, two-way ANOVA and Šídák multiple comparisons test. (B) Box plot of log2 fold change values for n = 99 Dux target genes (Percharde et al. 2018) versus significantly altered nontargets (FDR < 0.05, CX-5461: n = 8057; BMH-21: n = 13,830) following 8-h iPol I. P-values, two-sided Wilcoxon rank sum test. (C) Heat map of 2C-specific genes (Macfarlan et al. 2012) showing gradual up-regulation following iPol I. Samples are grouped by unsupervised hierarchical clustering. (D) Expression of Dux and 2C-specific genes in wild-type versus Dux−/− E14 ESCs. The control for each cell line is set to 1. Data are mean ± SEM of three biological replicates, representative of two experiments. (E) Schematic for embryo iPol I inhibitor experiments with 1 µM BMH-21 or CX-5461. (F) Ncl immunofluorescence in mid-2C embryos fixed immediately or cultured for 8 h with the indicated inhibitors. (n) Number of embryos with the representative staining from two experiments. Scale bar, 20 µm. (G) CNN qRT-PCR expression data following 8-h iPol I in mid two-cell embryos showing inhibited Dux repression. Data are mean ± SEM. n = 4 experiments with equal numbers of embryos, with levels at 0 h set to 1 in each experiment. P-values, one-way ANOVA with Dunnett multiple comparisons correction. (H) CNN qRT-PCR expression data showing Dux up-regulation after 24 h for 1 µM CX-5461. Data are mean ± SEM. n = 4 experiments. P-values, Welch's two-tailed t-test. (I) Embryo progression rates following 24-h iPol I treatment in n = 4 experiments (CX-5461) and n = 2 experiments (BMH-21). P-values, χ2 test. n = number of embryos.
Figure 5.
Figure 5.
Nucleolar disruption induces Dux relocalization and activation. (A,B) Representative confocal images and scoring of Dux localization in the indicated embryo stages. (n) Number of pronuclei or nuclei; embryos from two independent experiments were scored. P-values, χ2 test. Scale bar, 20 µm. (C,D) Example images of chromatin distribution as marked by DAPI staining in 3D-SIM imaging experiments in 2C-pos versus 2C-neg cells (C) and in ESCs upon 8-h iPol I (D). (D) 2C-neg cells and control but not iPol I ESCs have nucleolar chromatin fibers, visible as a roughened nucleolar border (orange arrows, inset). Scale bar, 5 µm. (E) Representative immuno-DNA FISH images at the indicated time points of iPol I for Dux alleles (red) compared with nucleolar (B23, green) or nuclear lamina (LaminB; not shown) compartments. Scale bar, 10 µm. (F) Quantification of Dux localization at 4-h iPol I showing movement away from the nucleolus. P-values, χ2 test. (n) Number of nuclei scored. (G) Dot plot of GSEA enrichment scores (NES) and significance (FDR) for type I or type II NADs using expression data following iPol I or following LINE1/Ncl KD (Percharde et al. 2018). (H) Box plot of log2 fold change values for type I NADs (n = 1565) or type II NADs (n = 371) versus all genes at 8-h iPol I. P-values, two-sided Wilcoxon rank-sum test, comparing type I/II NADs with all genes.
Figure 6.
Figure 6.
Disruption of LLPS induces Dux movement and activation. (A) Immunofluorescence for nucleolar markers B23 and Fbl after the indicated times of incubation with 1% 1,6-hexanediol (HDL) with or without washout and recovery in normal media, and quantification of the percentage of cells with RingShape+ nucleoli (below). Scale bar, 20 µm. (n) Number of cells. P-values, χ2 test with Bonferroni adjustment for multiple comparisons. (B) Scoring of Dux locus nuclear positioning following HDL treatments from Dux immuno-FISH experiments. (n) Number of nuclei scored from two FISH experiments. P-values, χ2 test, with Bonferroni adjustment for multiple comparisons. (C) Expression of Dux by qRT-PCR following HDL treatment. Data are mean ± SEM for n = 3 biological replicates, representative of two independent experiments. P-values, one-way ANOVA with Dunnett correction for multiple comparisons. (D) Model: Nucleolar maturation allows for Dux repression and two-cell exit. In early embryos and 2C-like cells, NPBs have altered morphology, reduced function, and reduced chromatin association. We propose that this provides a permissive environment for Dux and subsequent 2C/MERVL expression. In mature nucleoli with high rRNA output, Dux is recruited to perinucleolar chromatin and is repressed. Disruption of nucleolar integrity via iPol I or inhibition of nucleolar phase separation releases Dux and leads to its derepression.

References

    1. Abraham KJ, Khosraviani N, Chan JNY, Gorthi A, Samman A, Zhao DY, Wang M, Bokros M, Vidya E, Ostrowski LA, et al. 2020. Nucleolar RNA polymerase II drives ribosome biogenesis. Nature 585: 298–302. 10.1038/s41586-020-2497-0 - DOI - PMC - PubMed
    1. Azkanaz M, Rodríguez López A, de Boer B, Huiting W, Angrand PO, Vellenga E, Kampinga HH, Bergink S, Martens JH, Schuringa JJ, et al. 2019. Protein quality control in the nucleolus safeguards recovery of epigenetic regulators after heat shock. Elife 8: e45205. 10.7554/eLife.45205 - DOI - PMC - PubMed
    1. Beagrie RA, Scialdone A, Schueler M, Kraemer DC, Chotalia M, Xie SQ, Barbieri M, de Santiago I, Lavitas LM, Branco MR, et al. 2017. Complex multi-enhancer contacts captured by genome architecture mapping. Nature 543: 519–524. 10.1038/nature21411 - DOI - PMC - PubMed
    1. Bersaglieri C, Kresoja-Rakic J, Gupta S, Bär D, Kuzyakiv R, Santoro R. 2020. Genome-wide maps of nucleolus interactions reveal distinct layers of repressive chromatin domains. bioRxiv 10.1101/2020.11.17.386797 - DOI - PMC - PubMed
    1. Binek A, Rojo D, Godzien J, Ruperez FJ, Nunez V, Jorge I, Ricote M, Vazquez J, Barbas C. 2019. Flow cytometry Has a significant impact on the cellular metabolome. J Proteome Res 18: 169–181. - PubMed

Publication types