. 2022 Apr;33(4):810-827.
doi: 10.1681/ASN.2021050680. Epub 2022 Mar 10.

Decreased Renal Gluconeogenesis Is a Hallmark of Chronic Kidney Disease

Affiliations

Decreased Renal Gluconeogenesis Is a Hallmark of Chronic Kidney Disease

Thomas Verissimo et al. J Am Soc Nephrol. 2022 Apr.

Abstract

Introduction: CKD is associated with alterations of tubular function. Renal gluconeogenesis is responsible for 40% of systemic gluconeogenesis during fasting, but how and why CKD affects this process and the repercussions of such regulation are unknown.

Methods: We used data on the renal gluconeogenic pathway from more than 200 renal biopsies performed on CKD patients and from 43 kidney allograft patients, and studied three mouse models, of proteinuric CKD (POD-ATTAC), of ischemic CKD, and of unilateral urinary tract obstruction. We analyzed a cohort of patients who benefitted from renal catheterization and a retrospective cohort of patients hospitalized in the intensive care unit.

Results: Renal biopsies of CKD and kidney allograft patients revealed a stage-dependent decrease in the renal gluconeogenic pathway. Two animal models of CKD and one model of kidney fibrosis confirm gluconeogenic downregulation in injured proximal tubule cells. This shift resulted in an alteration of renal glucose production and lactate clearance during an exogenous lactate load. The isolated perfused kidney technique in animal models and renal venous catheterization in CKD patients confirmed decreased renal glucose production and lactate clearance. In CKD patients hospitalized in the intensive care unit, systemic alterations of glucose and lactate levels were more prevalent and associated with increased mortality and a worse renal prognosis at follow-up. Decreased expression of the gluconeogenesis pathway and its regulators predicted faster histologic progression of kidney disease in kidney allograft biopsies.

Conclusion: Renal gluconeogenic function is impaired in CKD. Altered renal gluconeogenesis leads to systemic metabolic changes with a decrease in glucose and increase in lactate level, and is associated with a worse renal prognosis.

Keywords: chronic kidney disease; gluconeogenesis; metabolism.


Figures

None
Graphical abstract
Figure 1.
Figure 1.
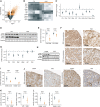
Alterations of the gluconeogenesis pathway in CKD. (A) Analysis of gluconeogenic (PC, FBP1, PCK1, G6PC), glycolytic (HK1, PKM), fatty acid oxydation (ACAA1, ACACB, ACOX1 ACOX2) and key regulator (HNF4α, PPARα, FOXO1, PGC1α) genes in the Affymetrix microarray expression dataset obtained in the European Renal cDNA Kröner-Fresenius Biopsy Bank, sorted by CKD stage (CKD1, n=56; CKD2, n=46; CKD3, n=37; CKD4, n=26; CKD5, n=10). Biopsies from kidney donors (n=42) are used as controls. *q<0.05. (B) Representative immunostaining of FBP1 in 12 kidney biopsies classified according to fibrosis level by an experienced renal pathologist (fibrosis <20%, n=4; between 40% and 50%, n=3; and >70%, n=4). (C) Association between eGFR by creatinine CKD-EPI equation and ranking of FBP1 expression established blindly by two nephrologists in kidney biopsies from 12 CKD patients (fibrosis <20%, n=4; between 40% and 50%, n=3; and >70%, n=4), fitted through linear regression. (D) Gene set enrichment analysis. Top panel displays the enrichment score (ES), defined as the highest deviation from zero in each gene set. A positive ES indicates gene set enrichment whereas a negative ES indicates gene set depletion. The middle panel shows the position of each gene from the gene sets in the ranked list of genes. The bottom panel shows the value of the ranking metric, based on the log fold change between kidney allograft biopsies classified as CKD (n=27) compared with those classified as recovery (n=23). A positive value indicates an increase in gene expression and a negative value indicates a decrease in gene expression in the CKD group compared with the recovery group. Gluconeogenesis (gray) and glycolysis (orange) pathways from the Reactome database were used as reference gene sets. The input metric was the log fold change of gene expression. Adjusted P value for gluconeogenesis is P=0.0015 and for glycolysis is P=0.109. (E) Pearson correlation between metabolic regulators (HNF4α, PPARα, FOXO1, ESRRA) and gluconeogenic (PCK1, FBP1, PC, G6PC) or glycolytic enzyme (PKM, HK1) gene expression in kidney allograft biopsies classified as CKD (n=27). (F) Pearson correlation coefficient between the expression of different biologic pathways and FBP1 and PCK1 expression as assessed by RNA sequencing in biopsies from a cohort of post-transplant in patients with CKD profile (n=27). (G) mRNA expression of gluconeogenic (Pcx, Fbp1, G6pc, Pck1) and glycolytic (Hk1, Pkm) genes after 12 hours of TGFβ (25 ng/ml), albumin (60 mg/ml), or combined, with and without TGFβ inhibitor (SB-431542) (25 µM) treatment in primary culture of cortical cells. n=7, *p<0.05. Results are presented with error bars showing mean ± bootstrapped confidence intervals.
Figure 2.
Figure 2.
Gluconeogenesis enzyme expression is severely impaired in two models of CKD. RNA sequencing data from controls (CTL, n=5) and 28 days POD-ATTAC (POD, n=6) mice. (A) Volcano plot representation showing log fold change (log FC) in mRNA expression among groups according to the log10 of the P value (log10Pvalue). The cutoff is α=0.05. (B) Heatmap displaying mRNA levels of genes of interest in CTL (gray) and POD (orange) animals. (C) mRNA levels of classic genes implicated in the gluconeogenesis (Pcx, Fbp1, Pck1, G6pc) and glycolysis (Hk1, Pkm) pathways and key regulators (Hnf4α, Pparα, Foxo1, Esrra) in PT cells isolated from POD-ATTAC mice at 28 days. (CTL, n=5) and (POD, n=5). *P<0.05. (D) Representative immunoblots of kidney cortex for FBP1 and PCK1 in controls (CTL) and 28 days POD-ATTAC (POD) animals. Loading control corresponds to Ponceau S staining. (E) Protein quantification by Western blotting of FBP1 and PCK1 proteins in the kidney cortex of controls (CTL, n=12) and 28 days POD-ATTAC (POD, n=13) mice. **P<0.01, ****P<0.0001. (F) Representative immunostaining of kidney cortex for FBP1 and PCK1 in controls (CTL) and 28 days POD-ATTAC (POD). (G) mRNA levels of classic genes implicated in the gluconeogenesis (Pcx, Fbp1, Pck1, G6pc) and glycolysis (Hk1, Pkm) pathways in the UUO mouse model at 7 days. Sham-contralateral (SHAM, n=7) and obstructed kidneys (UUO, n=7). *P<0.05. (H) Representative immunoblot of FBP1 and PCK1 proteins in UUO mouse model. Loading control corresponds to Ponceau S staining. (I) Protein quantification by Western blotting of FBP1 and PCK1 proteins in UUO mouse model. Sham-contralateral (SHAM, n=7) and 7 days obstructed kidneys (UUO, n=7). *p<0.5, ****p<0.01. (J) Representative immunostaining of kidney cortex for FBP1 and PCK1 in sham-contralateral (SHAM) and 7 days UUO. (K) FBP1 and PCK1 enzymatic activity measured in the kidney cortex in 28 days POD-ATTAC (POD, n=6) and control (CTL, n=6). *P<0.05. (L) FBP1 and PCK1 enzymatic activity in sham-contralateral (SHAM, n=6) and 7 days after UUO (UUO, n=6). **p<0.01. Results are presented with error bars showing mean ± bootstrapped confidence intervals.
Figure 3.
Figure 3.
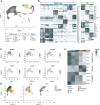
snRNA-seq analyses of mouse IRI kidney identify the persistence of injured PT cells with altered metabolism in chronic phase. (A) UMAP plot of all integrated datasets identifies the different cellular component of the kidney. PT, proximal tubule cells; DTL, descending limb of loop of Henle; ATL, thin ascending limb of loop of Henle; TAL and TAL2, thick ascending limb of loop of Henle; POD, podocytes; DCT, distal convoluted tubule; CNT, connecting tubule; ICA, type A intercalated cells of collecting duct; ICB, type B intercalated cells of collecting duct; PC, principle cells; EC, endothelial cells. (B) Heat map of marker genes for all renal cell types identified categorized into tree broad cell categories. Each cell type is represented by the top five genes ranked by average log fold change of a Wilcoxon rank sum test between one cell cluster versus all other cells. Each column represents the average expression per sample hierarchically grouped by cell type and phase. Gene expression values are normalized from 0 to 1 across rows within each cell category. (C) Feature plot shows expression of differentiated PT (Slc5a12, Slc13a3, Scl16a9) and injury markers (Havcr1, Vcam1, Gdf15) of the total PT cells. (D) UMAP plot highlighting uninjured and injured PT populations across phases. Total includes PT cells in control, early, and late phases, whereas early and late phases include only the samples from the respective indicated phase. (E) Heat map shows expression of gluconeogenic (Pcx, Pck1, Fbp1, G6pc), glycolytic (Pkm, Hk1), and key regulator (Hnf4α, Pparα, Foxo1, Esrra) genes in uninjured and injured PT cells in early and late phases after injury. Each column represents the average expression per cell state (uninjured and injured) in each phase (control, early, late) hierarchically grouped by cell state and phase. Gene expression values are normalized from 0 to 1 across rows.
Figure 4.
Figure 4.
Functional effect of gluconeogenesis alteration in CKD mouse models. Lactate tolerance test in control (CTL, gray, n=8) and 28-days POD-ATTAC (POD, orange, n=5) mice after an acute intraperitoneal sodium lactate load (1.5 g/kg) in fasting animals. (A) Change in blood glucose levels (expressed as fold change from baseline time point in each group) over time. Dots indicate mean and vertical bars represent bootstrapped 95% confidence intervals. (B) Area under the curve (AUC) of glucose level course according to GFR assessed by sinistrin clearance. Regression line is fitted with a logarithmic model. (C) Change in blood lactate levels (expressed as fold change from baseline in each group) and fitted with a nonlinear self-starting asymptotic regression model ex vivo perfused kidney. (D) Schematic representation of the ex vivo kidney perfusion set-up. A perfusion solution is oxygenated with 95% O2 and 5% CO2 with a flow of 2 L/min through a membrane oxygenator. The kidney is isolated from the main circulation and perfused through the renal artery at 350 µl/min flow after a 20-minute wash at 700 µl/min flow, allowing the calculation of renal arterio-venous metabolite flux. (E–H) Renal arterio-venous flux of bicarbonate (HCO3), glucose, lactate, and renal oxygen consumption (VO2) in control (CTL, n=4) and 28 days POD-ATTAC (POD, n=6) kidneys. *P<0.05, **P<0.01. (I) Renal glucose release and uptake in controls (CTL, n=10) and 28 days POD-ATTAC (POD, n=6) kidneys. *P<0.05. Results are presented with error bars showing mean ± bootstrapped confidence intervals.
Figure 5.
Figure 5.
Gluconeogenesis impairment is correlated with kidney function and fibrosis in human CKD. (A) Renal lactate and glucose flux in a mixed cohort of patients undergoing cardiac surgery and patients with congestive heart failure, stratified by eGFR (estimated using creatinine CKD-EPI equation). eGFR>100 ml/min per 1.73 m2, n=6; eGFR <100 and >70 ml/min per 1.73 m2, n=62; eGFR <70 and >40 ml/min per 1.73 m2, n=34; eGFR <40 ml/min per 1.73 m2, n=6. Results are expressed in micromoles per minute per kilogram. (B) Individual eGFR trajectories of CKD patients admitted to ICU and displaying during their ICU an impaired metabolism (n=130) or a baseline (n=105) metabolic profile, fitting by linear regression. P=0.012. General model was fitted using a linear mixed model and plotted as a plain line. Results are presented with error bars showing mean ± bootstrapped confidence intervals. (C) Odds ratio for fibrosis progression assessed by the 3 and 12 months difference in the Banff Lesion Score IFTA (ci+ct) relative to transcript levels of key regulator (PPARα, HNF4α, PGC1α, ESRRA, FOXO1, blue), gluconeogenic (PC, FBP1, PCK1, G6PC, dark blue), and glycolytic (HK1, PKM, orange) genes in 42 biopsies from allograft kidney recipients sampled 3 months after transplant. The line represents a 95% confidence interval.

References

    1. Ruiz-Ortega M, Rayego-Mateos S, Lamas S, Ortiz A, Rodrigues-Diez RR: Targeting the progression of chronic kidney disease. Nat Rev Nephrol 16: 269–288, 2020 - PubMed
    1. Grgic I, Campanholle G, Bijol V, Wang C, Sabbisetti VS, Ichimura T, et al. : Targeted proximal tubule injury triggers interstitial fibrosis and glomerulosclerosis. Kidney Int 82: 172–183, 2012 - PMC - PubMed
    1. Basile DP, Bonventre JV, Mehta R, Nangaku M, Unwin R, Rosner MH, et al. ; ADQI XIII Work Group : Progression after AKI: Understanding maladaptive repair processes to predict and identify therapeutic treatments. J Am Soc Nephrol 27: 687–697, 2016 - PMC - PubMed
    1. Yang L, Besschetnova TY, Brooks CR, Shah JV, Bonventre JV: Epithelial cell cycle arrest in G2/M mediates kidney fibrosis after injury. Nat Med 16: 535–543, 2010 - PMC - PubMed
    1. Chung KW, Dhillon P, Huang S, Sheng X, Shrestha R, Qiu C, et al. : Mitochondrial damage and activation of the STING pathway lead to renal inflammation and fibrosis. Cell Metab 30: 784–799.e5, 2019 - PMC - PubMed

Publication types